The origin of S-stars and a young stellar disk: distribution of debris stars of a sinking star cluster
Abstract
Within the distance of 1 pc from the Galactic center (GC), more than 100 young massive stars have been found. The massive stars at 0.1–1 pc from the GC are located in one or two disks, while those within 0.1 pc from the GC, S-stars, have an isotropic distribution. How these stars are formed is not well understood, especially for S-stars. Here we propose that a young star cluster with an intermediate-mass black hole (IMBH) can form both the disks and S-stars. We performed a fully self-consistent -body simulation of a star cluster near the GC. Stars escaped from the tidally disrupted star cluster were carried to the GC due to a 1:1 mean motion resonance with the IMBH formed in the cluster. In the final phase of the evolution, the eccentricity of the IMBH becomes very high. In this phase, stars carried by the 1:1 resonance with the IMBH were dropped from the resonance and their orbits are randomized by a chaotic Kozai mechanism. The mass function of these carried stars is extremely top-heavy within . The surface density distribution of young massive stars has a slope of within from the GC. The distribution of stars in the most central region is isotropic. These characteristics agree well with those of stars observed within from the GC.
1 Introduction
More than 100 young massive stars have been found in the Galactic centerr (GC) by near-infrared observations (Krabbe et al. 1995; Paumard et al. 2006; Lu et al. 2006; Do et al. 2009; Bartko et al. 2010). These stars appear to reside in one or two disks at more than from the GC (Lu et al. 2006; Paumard et al. 2006), while B-type stars within (S-stars) have an isotropic and thermal distribution (Schödel et al. 2003; Gillessen et al. 2009). Two major scenarios have been proposed for the formation of these stars. One is the in-situ formation in an accretion disk (Levin & Beloborodov 2003) and the other is the migration of a star cluster formed several parsec or more away from the GC (Gerhard 2001).
In the 1990s, only OB and Wolf–Rayet (WR) stars could have been observed in the GC. However, recent advance in observation techniques has made it possible to identify many late-type stars, and now we can obtain their spacial distribution. While the OB and WR stars have a power-law distribution with a slope of about , the slope for all stars including late-type giants is nearly 0 (Do et al. 2009; Buchholz et al. 2009; Bartko et al. 2010). The orbits of S-stars appear to be isotropic and thermal (Schödel et al. 2003), but the most recent observation showed that it is more eccentric with the distribution of (Gillessen et al. 2009). How these distributions have formed is the key to the understanding of the formation process of the young stars near the GC. The mass function of the young stars have also been determined from the observations. It is quite top-heavy (Do et al. 2009; Buchholz et al. 2009; Bartko et al. 2010). Formation scenarios should also explain the mass function.
In-situ formation of S-stars is difficult because of the strong tidal field of the central supermassive black hole (SMBH). Therefore, it is necessary to carry young stars to the current location from somewhere outside. Recently, several scenarios have been proposed to carry stars which were born on a gaseous disk at around 0.1–0.5 pc from the GC and to randomize their orbits. The scenarios include migration via the gravitational torques in the stellar disk (Levin 2007; Griv 2009), migration as a star cluster core (Berukoff & Hansen 2006), randomization of the orbital elements of S-stars by an IMBH (Gualandris & Merritt 2009; Merritt et al. 2009) or stellar-mass black holes (Perets et al. 2009), and the formation of S-stars due to disruptions of binaries (Löckmann et al. 2008; Madigan et al. 2009). On the other hand, Bonnell & Rice (2008) suggested the direct formation of S-stars in a gaseous disk formed from a giant molecular cloud infalling to the GC. However, none of them is well established.
We have shown that star clusters can carry young stars to the GC, if an IMBH forms in the clusters. In Fujii et al. (2009), we performed a fully self-consistent -body simulation, in which both the internal dynamics of a star cluster and the interaction between the cluster and its parent galaxy are handled correctly. The star cluster migrating into the GC was completely disrupted by the tidal force and the stars escaping from the cluster formed a disk structure. Before the disruption, an IMBH formed through the runaway collisions of stars in the cluster. We found a new migration mechanism of young stars, a 1:1 mean motion resonance with the IMBH. The IMBH carries young stars to the GC by the 1:1 resonance after the disruption of the cluster. In this simulation, however, the spacial resolution around the SMBH was limited to 0.2 pc because of the use of a large softening length for the SMBH. Hence, it was impossible to compare the distributions of the young stars obtained in the simulation with the observed one.
In this Letter, we report the result of a new simulation performed using our improved code which does not need softening for the SMBH. In this simulation, we can follow the orbits of stars down to the AU scale, where S-stars reside. We found that the distribution of stars obtained from the simulation agrees very well with the observations in the following three points: the surface density of young massive stars has a slope of , the young stars have an extremely top-heavy mass function, and the orbits of young stars in the inner most region are thermal and isotropic. A sinking star cluster can explain both a young stellar disk and S-stars at the same time.
We describe the method of our -body simulation in Section 2. In Section 3, we show the results of simulations. Section 4 is for summary.
2 -body simulation
We adopted a King model with the non-dimensional central potential of as the Galaxy model. We placed a central SMBH with a mass of (Eisenhauer et al. 2005). Our galaxy model represents the central region of our Galaxy. The total mass of our galaxy model is in the real scale (excluding the SMBH). The number of particles is and the mass of a particle is 9.7 . The half-mass radius is 22 pc and the initial core radius before we place the SMBH is 0.8 pc. As a model of a star cluster, we also adopted a King model with the non-dimensional central potential . The number of particles is 64k. We started a simulation with the initial position of the cluster of 12.5 pc from the GC and with an eccentric orbit. The initial orbital velocity is 0.67 times the circular velocity. The total mass of the cluster is and the half-mass radius is 0.16 pc. Initial mass function (IMF) of stars in the clusters is a Salpeter IMF with lower and upper cutoff at 1 and 100 (Salpeter 1955). We assigned each star a mass randomly chosen from the Salpeter IMF, irrespective of its position. In this simulation, we adopted collisions of stars in the star cluster, mass-loss from very massive stars, and formation of an IMBH in the cluster. The details are described in (Fujii et al. 2009).
The calculation was performed using the Bridge code (Fujii et al. 2007), which is a tree-direct hybrid scheme. It can treat dense regions embedded in a larger-scale system. In this simulation, the internal motion of star clusters and field stars within 0.28 pc from the central SMBH are calculated using a direct code, the sixth-order Hermite scheme (Nitadori & Makino 2008), and other interactions are calculated using a treecode (Barnes & Hut 1986). The softening length is pc for field stars. We did not use softening for other interactions. We assume that stars in the distance 200 times the Schwarzshild radius of the SMBH (0.14 AU) merge to the SMBH. The step size for the treecode is 15 years. It is short enough to resolve the orbital motion at the boundary between the tree and direct regions. Thus, we can follow the orbits of stars down to the AU scale, in which S-stars are located. We used the opening angle with the center-of-mass approximation for the treecode. The simulation was performed on the Cray XT4 at National Astronomical Observatory of Japan. We used 256 cores, and the total CPU time for the calculation was about 100 days.
3 Distribution of young stars in the Galactic center
The star cluster spiraled into the GC due to the dynamical friction. At around 1 pc from the GC, the cluster was completely disrupted by the tidal force of the parent galaxy and the remnant stars of the star cluster formed a thick disk. Before the disruption, an IMBH formed in the cluster through the runaway collisions of stars. A massive star grew via repeated collisions and finally the mass of the massive star reached about 16000 . After the disruption, the IMBH continued to sink to the GC, and a few hundred stars which were the members of the cluster also migrated into the GC due to the 1:1 mean motion resonance of the IMBH. This evolution is the same as that shown in Fujii et al. (2009), but in the current simulation we can follow the orbits of the IMBH and stars down to AU scales, while in Fujii et al. (2009) stars could not go below 0.2 pc because of the large softening length.
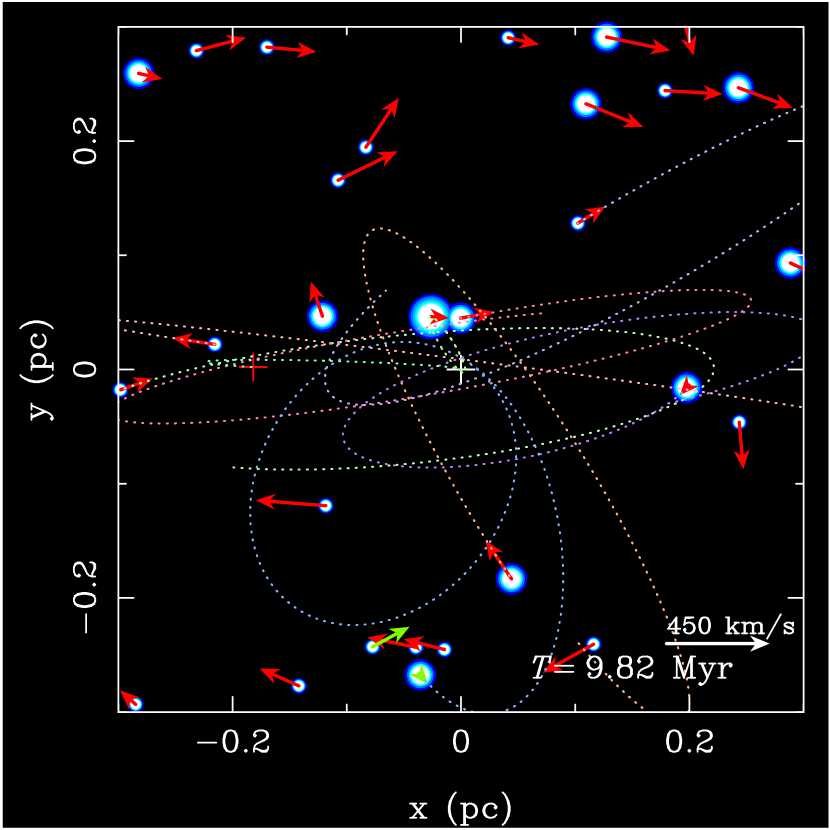
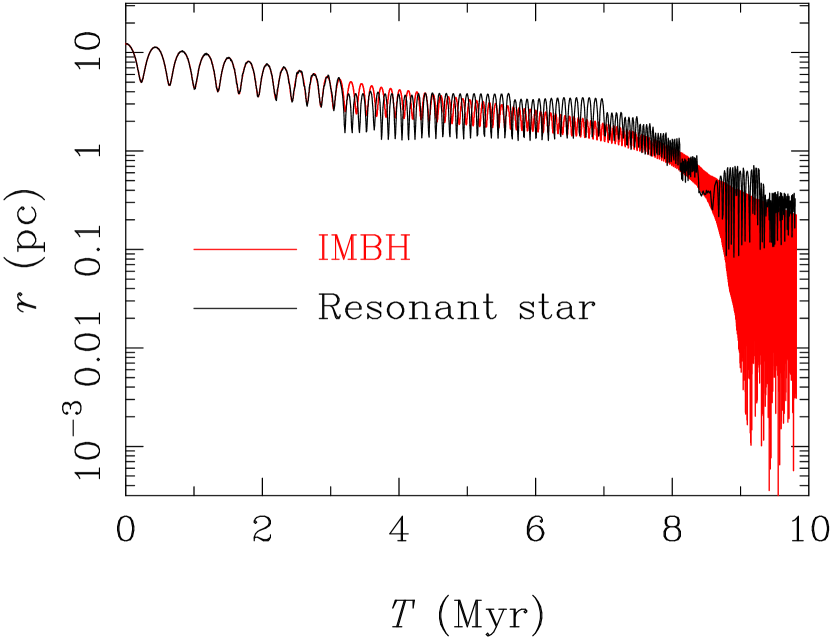
Figure 1 shows the projected distribution of stars at the end of the run (9.82Myr). We plotted only the stars which were originally the members of the star cluster. The orbital plane of the star cluster has an inclination of with respect to the plane of the sky and with a half-line of ascending nodes at east of north. These values follow the result of Paumard et al. (2006). The arrows show the proper motions of the stars. Red arrows are clockwise and green ones are counterclockwise. Dotted curves show the orbits of stars which reached the projected distance less than 0.05 pc from the central SMBH. The distribution of stars in this snapshot is very similar to those of S-stars, but the scale is larger in the simulation. As we stated above, these stars are carried by the 1:1 mean motion resonance with the IMBH and released from the resonance when the orbit of the IMBH becomes highly eccentric (see figure 2). Thus, the radial distribution of the carried stars strongly depends on the radius at which the IMBH orbit becomes eccentric. Baumgardt et al. (2006), Matsubayashi et al. (2007), and Iwasawa et al. (preprint) showed that the orbit of IMBHs becomes highly eccentric after their orbital decay slowed down because of the depletion of stars. The mechanism is as follows (Iwasawa et al, preprint): When the orbit of the IMBH is exactly circular, the orbits of stars with the semimajor axis larger than that of the IMBH would follow the Kozai cycle, which is a large-amplitude coupled oscillation of eccentricity and inclination. In this case, the -component of the angular momentum, , is conserved, since the time-averaged potential of the SMBH and the IMBH is axisymmetric. If the orbit of the IMBH is not exactly circular, for some stars is no longer conserved. Thus, they can exchange the angular momentum with the IMBH. Moreover, they are likely to be ejected by the IMBH when they are in the prograde orbits with the peri-center distance comparable to the semi-major axis of the IMBH. On average, these stars carry away the orbital angular momentum of the IMBH and cause an increase in the eccentricity of the IMBH.
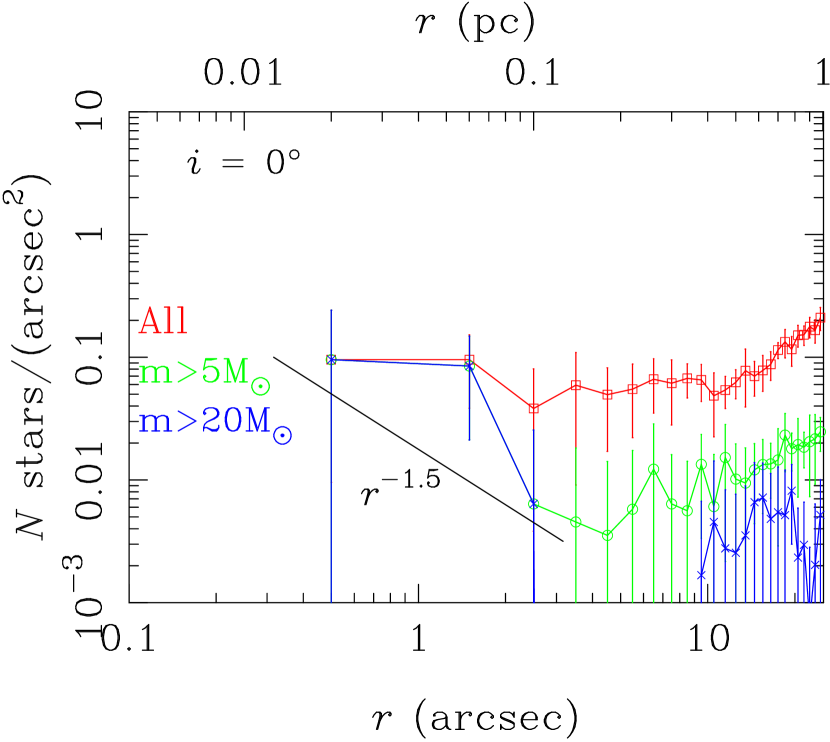
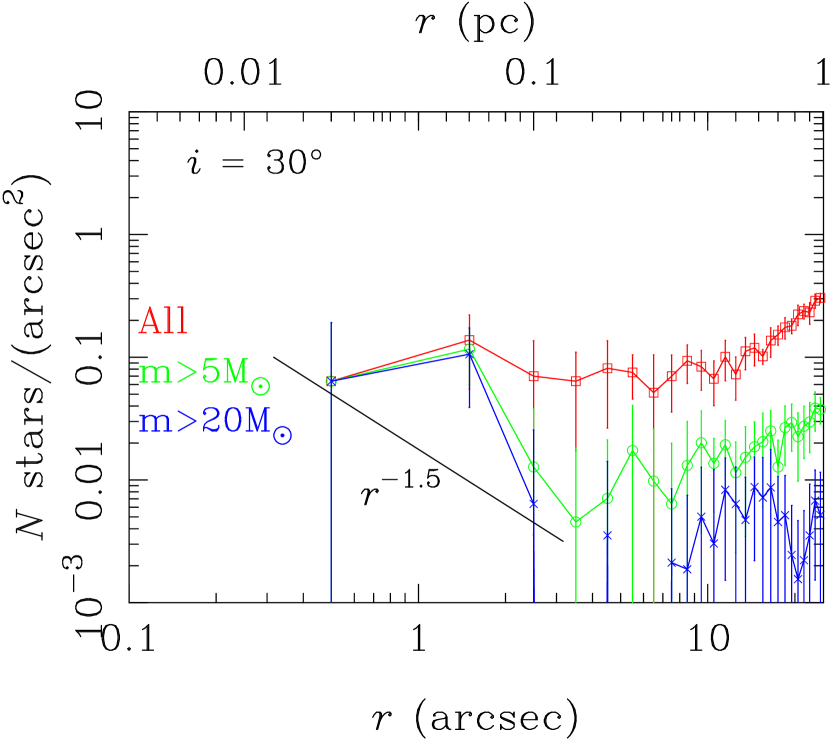
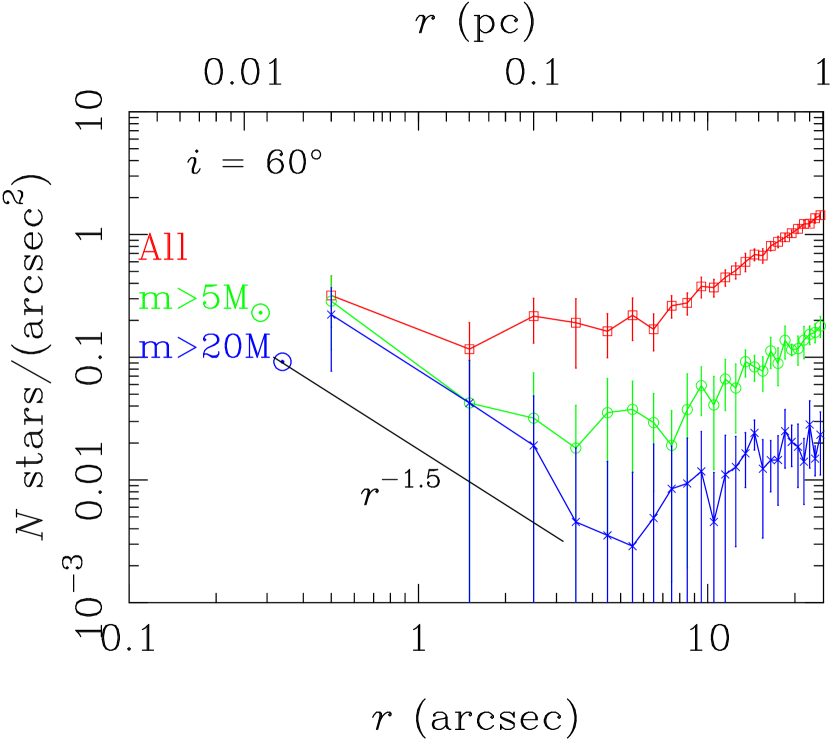
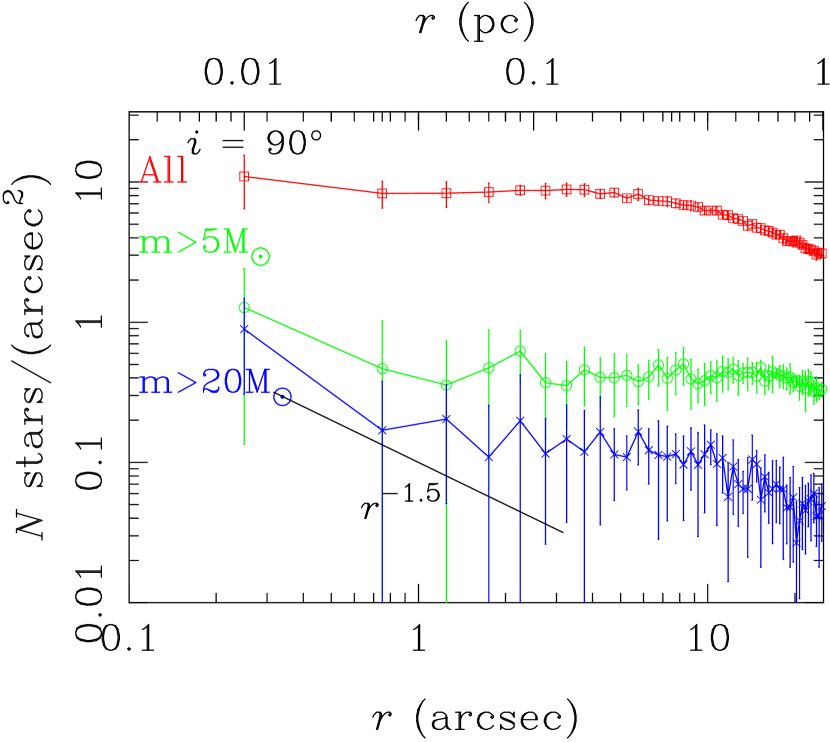
We investigated the surface density profile, averaged over the last 10 snapshots with a time interval of around 8000 years. Since the young stars distribute mainly in the orbital plane of the star cluster, we plotted the projected surface density for inclinations , , , and . The inclination of the observed clockwise disk at 0.1–1 pc is (Paumard et al. 2006). It is similar to . Red curves in figure 3 show the surface density of all young stars. Green and blue curves show those of massive stars only with and , respectively. The error bars show their standard deviations. While the massive stars concentrate on the GC, the distribution of all stars is rather flat in all inclinations. The slope of the projected surface density profile of the massive stars is around within , although it is slightly different for the different inclinations and the number of particles is too small to fit in the case of small inclinations. This result agrees well with the observed surface density of young massive stars (Bartko et al. 2010; Buchholz et al. 2009; Do et al. 2009).
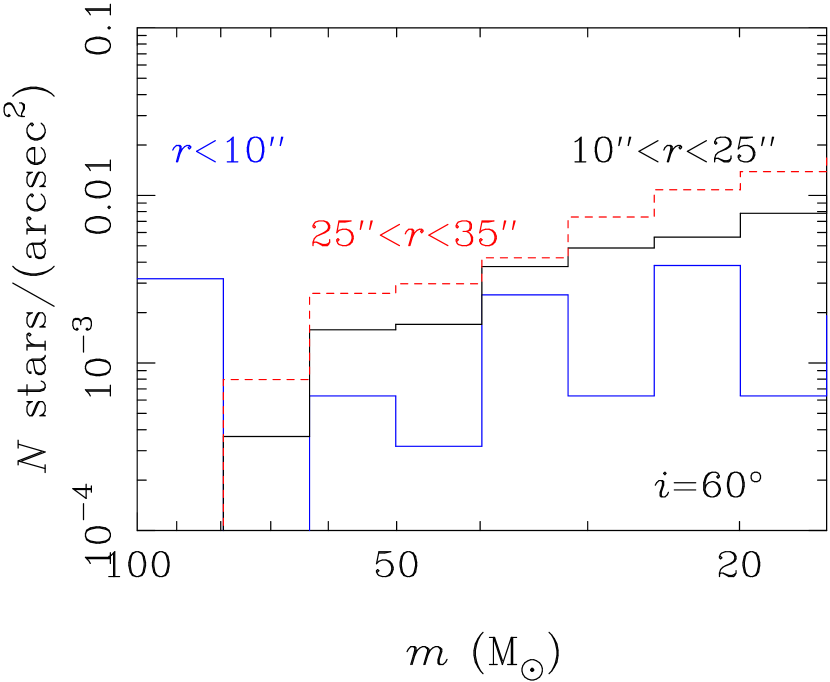
We also investigated the mass functions of young stars in three intervals, , and , averaged within the last 10 snapshots. Figure 4 shows the result for , which is a similar angle to the observed young stellar disk. The mass function was extremely top-heavy in the inner-most region, , and approaches a power-law mass function in the outer region. These results are consistent with the observation (Bartko et al. 2010).
As shown in Fujii et al. (2009), the star cluster can carry massive stars efficiently to the GC because of the following mechanisms. Massive stars sink to the cluster center because of the mass segregation. When a star cluster is disrupted by the tidal force of the parent galaxy, stars in the outer region of the cluster become unbound first. Therefore, massive stars tend to be carried close to the GC. After the disruption of the star cluster, some of the massive stars are carried further into the inner region by the 1:1 mean motion resonance of the IMBH.
Figure 5 shows the probability distribution function of young stars within 0.3 pc from the GC (left panel of figure 5) and the distribution of inclinations (right panel of figure 5). The distribution of the eccentricity shows a thermal distribution, (Heggie 1975). This result agrees with the simulation performed by Merritt et al. (2009). The inclination is randomized near the GC, but no star has an inclination larger than 90∘ in this snapshot. However, the inclination of one resonant star exceeded 90∘. Several stars escaping the cluster by slingshot also had retrograde orbits and have the pericenter distance less than 0.1 pc.
4 Summary and Discussion
We performed a fully self-consistent -body simulation of a star cluster near the GC. The star cluster migrated to the GC owing to the dynamical friction and was disrupted by the tidal force. The stars which are initially the members of the star cluster formed a disk structure. Before the disruption, an IMBH formed in the cluster via runaway collisions of stars. After the disruption of the cluster, the IMBH continued to sink to the GC and stars which were caught in the 1:1 mean motion resonance of the IMBH also sank to the GC. Near the GC, the spiral-in of the IMBH slowed because of the depletion of field stars, and the orbit of the IMBH became highly eccentric. At this stage, the stars were kicked out from the resonance and the orbits were efficiently randomized by the non-axisymmetric perturbing potential of the IMBH.
We investigated the distributions of the stars carried to the GC by the star cluster and the IMBH. We found that they agree well with the observed ones. The surface density within had a slope of . The mass function of the young stars was extremely top-heavy in the inner-most region. The eccentricities and inclinations of the young stars carried near the central SMBH by the resonance were a thermal and isotropic distribution, while young stars in the outer region were distributed in a disk. These distributions agree with that of S-stars and a young stellar disk. Thus, the distributions of “debris stars” of the sinking star cluster agree well with the observations. The star cluster scenario with an IMBH can explain the origin of both a young stellar disk and S-stars.
Here, we discuss possible conditions for the formation of S-stars. In our simulation, the distances of young stars carried by the resonance were larger than those of S-stars. However, how deeply the IMBH can carry stars to the GC depends on the distance where the orbit of the IMBH becomes eccentric. It occurs when the mass of the IMBH is comparable to the enclosed mass of the field stars (Matsubayashi et al. 2007) and this distance strongly depends on the density distribution of the GC and the mass of the IMBH. First, we discuss the density distribution. The enclosed mass of the field stars in our model is only % of that estimated by observed visible stars (Schödel et al. 2007) at 0.15 pc, where the orbit of the IMBH became eccentric in our simulation. If the density profile is a broken power-law fitted by observed visible stars, the enclosed mass is even at 0.01 pc (Schödel et al. 2007; Genzel et al. 2003). We also estimate the case of a power-law with , which is theoretically expected (Bahcall & Wolf 1976). In this case, the enclosed mass is 8000 at 0.01 pc (2000 AU) and 1000 at pc (400 AU). These values are smaller than the upper limit of the enclosed mass from the observation of S2, 3–4 at 0.01 pc (Ghez et al. 2008). Recent observations show a flat density profile of old stars (Do et al. 2009; Buchholz et al. 2009; Bartko et al. 2010). However, it is unlikely that this distribution reflects the true mass distribution. There are certainly dark masses composed of stellar mass black holes, neutron stars, and white and brown dwarfs. On the other hand, the timescale of collisions between main-sequence stars is pretty small, around 0.1–1 Gyr for inner 1 pc, if a stellar cusp developed through thermal relaxation (Duncan & Shapiro 1983). Therefore, the lack of old stars is probably the result of collisional disruptions. Compact objects are not disrupted by collisions, and brown dwarfs are also less likely to be disrupted by collisions due to their high density. Thus, it seems natural to assume that the innermost region of the GC is dominated by dark mass.
Next, we discuss the possible range of the IMBH mass. In our simulation, the IMBH is more massive than the observational upper limit, (Reid & Brunthaler 2004), but it is possible to form smaller IMBHs from different initial conditions or with higher mass loss rates (Fujii et al. 2009). Even if we assume an extreme mass loss rate, it is possible to form a star with a few thousand solar masses through runaway collisions because the star cluster near the GC is very compact. For the lower limit, is sufficient for the randomization of stars (Merritt et al. 2009). Less massive IMBHs can carry stars closer to the GC, but it takes a longer time to migrate due to the dynamical friction. Star clusters migrate to around 1pc and are disrupted there. Its typical timescale is 2–10 Myr for a star cluster at 5–10 pc from the GC with around (Fujii et al. 2009). After the disruption, IMBHs migrate due to the dynamical friction. We estimated the timescale for IMBHs migrating from 1 pc to pc using the equation derived from Matsubayashi et al. (2007). We assumed that the Bahcall–Wolf cusp and obtained 1 Myr for the IMBH with 16000. This result is consistent with our simulation. We also tried broken power laws (Genzel et al. 2003) and obtained similar results. The timescale is inversely proportional to the IMBH mass. Thus, IMBHs with a few thousand solar masses are capable for this scenario.


References
- Bahcall & Wolf (1976) Bahcall, J. N., & Wolf, R. A. 1976, ApJ, 209, 214
- Barnes & Hut (1986) Barnes, J., & Hut, P. 1986, Nature, 324, 446
- Bartko et al. (2010) Bartko, H., et al. 2010, ApJ, 708, 834
- Baumgardt et al. (2006) Baumgardt, H., Gualandris, A., & Portegies Zwart, S. 2006, MNRAS, 372, 174
- Berukoff & Hansen (2006) Berukoff, S. J., & Hansen, B. M. S. 2006, ApJ, 650, 901
- Bonnell & Rice (2008) Bonnell, I. A., & Rice, W. K. M. 2008, Science, 321, 1060
- Buchholz et al. (2009) Buchholz, R. M., Schödel, R., & Eckart, A. 2009, A&A, 499, 483
- Do et al. (2009) Do, T., Ghez, A. M., Morris, M. R., Lu, J. R., Matthews, K., Yelda, S., & Larkin, J. 2009, ApJ, 703, 1323
- Duncan & Shapiro (1983) Duncan, M. J., & Shapiro, S. L. 1983, ApJ, 268, 565
- Eisenhauer et al. (2005) Eisenhauer, F., et al. 2005, ApJ, 628, 246
- Fujii et al. (2007) Fujii, M., Iwasawa, M., Funato, Y., & Makino, J. 2007, PASJ, 59, 1095
- Fujii et al. (2009) —. 2009, ApJ, 695, 1421
- Genzel et al. (2003) Genzel, R., et al. 2003, ApJ, 594, 812
- Gerhard (2001) Gerhard, O. 2001, ApJ, 546, L39
- Ghez et al. (2008) Ghez, A. M., et al. 2008, ApJ, 689, 1044
- Gillessen et al. (2009) Gillessen, S., Eisenhauer, F., Trippe, S., Alexander, T., Genzel, R., Martins, F., & Ott, T. 2009, ApJ, 692, 1075
- Griv (2009) Griv, E. 2009, ApJ, 702, L1
- Gualandris & Merritt (2009) Gualandris, A., & Merritt, D. 2009, ApJ, 705, 361
- Heggie (1975) Heggie, D. C. 1975, MNRAS, 173, 729
- Krabbe et al. (1995) Krabbe, A., et al. 1995, ApJ, 447, L95+
- Levin (2007) Levin, Y. 2007, MNRAS, 374, 515
- Levin & Beloborodov (2003) Levin, Y., & Beloborodov, A. M. 2003, ApJ, 590, L33
- Löckmann et al. (2008) Löckmann, U., Baumgardt, H., & Kroupa, P. 2008, ApJ, 683, L151
- Lu et al. (2006) Lu, J. R., Ghez, A. M., Hornstein, S. D., Morris, M., Matthews, K., Thompson, D. J., & Becklin, E. E. 2006, Journal of Physics Conference Series, 54, 279
- Madigan et al. (2009) Madigan, A., Levin, Y., & Hopman, C. 2009, ApJ, 697, L44
- Matsubayashi et al. (2007) Matsubayashi, T., Makino, J., & Ebisuzaki, T. 2007, ApJ, 656, 879
- Merritt et al. (2009) Merritt, D., Gualandris, A., & Mikkola, S. 2009, ApJ, 693, L35
- Nitadori & Makino (2008) Nitadori, K., & Makino, J. 2008, New Astronomy, 13, 498
- Paumard et al. (2006) Paumard, T., et al. 2006, ApJ, 643, 1011
- Perets et al. (2009) Perets, H. B., Gualandris, A., Kupi, G., Merritt, D., & Alexander, T. 2009, ApJ, 702, 884
- Reid & Brunthaler (2004) Reid, M. J., & Brunthaler, A. 2004, ApJ, 616, 872
- Salpeter (1955) Salpeter, E. E. 1955, ApJ, 121, 161
- Schödel et al. (2003) Schödel, R., Ott, T., Genzel, R., Eckart, A., Mouawad, N., & Alexander, T. 2003, ApJ, 596, 1015
- Schödel et al. (2007) Schödel, R., et al. 2007, A&A, 469, 125