Spectral Classification; Old and Contemporary
Abstract
Beginning with a historical account of the spectral classification, its refinement through additional criteria is presented. The line strengths and ratios used in two dimensional classifications of each spectral class are described. A parallel classification scheme for metal-poor stars and the standards used for classification are presented. The extension of spectral classification beyond M to L and T and spectroscopic classification criteria relevant to these classes are described. Contemporary methods of classifications based upon different automated approaches are introduced.
Keywords: Spectral classification, luminosity classes, metal-poor stars, M-L-T sectral classes
1 Historical Account of Spectral Classification
In 1866, Fr Angelo Secchi a Jesuit astronomer working in Italy observed prismatic spectra of about 4000 stars visually and divided stars in four broad spectral classes using common absorption features of hydrogen. During 1886-97, Henry Draper Memorial Survey at Harvard carried out a systematic photographic spectroscopy of stars brighter than 9th magnitude covering entire sky using telescopes at Harvard and Arequipa, Peru under the leadership of E.C.Pickering. The Henry Draper Catalog was published in 9 volumes of the Annals of Harvard College Observatory between 1918 and 1924. It contains rough positions, magnitudes, spectral classifications for 225,300 stars. Earlier work by W. Fleming essentially subdivided the previously used Secchi classes (I to IV) into more specific classes, by giving letters from A to N. The strength of hydrogen lines being the main classifier, the spectral type A was assigned to stars with strongest hydrogen lines followed by B,C with weaker hydrogen lines. This system was found to be unsatisfactory since the line strengths of other lines varied irregularly and so did the B-V color. This system was improvised by A.Maury, A.J.Cannon and E.Pickering who re-arranged the spectral sequence taking into consideration the changes in other lines and this new spectral sequence was also a sequence according to the color of the stars. But well-known stars had been already assigned the older spectral classes for long hence it was not possible to change them. We, therefore, have a spectral sequence essentially temperature dependent but goes like OBAFGKM. At the cool end the classification becomes more complex with parallel branches of R,N,S stars. While the M stars have TiO bands, S stars display ZrO bands, while R and N are carbon stars showing strong bands of various molecules with carbon. These have more recently been merged into a unified carbon classifier C scheme of C1, C2 etc with the old N0 starting at roughly C6. Another subset of cool carbon stars are the J-type stars, which are characterized by the strong 13CN molecules in addition to those of 12CN.
Each of the above mentioned spectral classes OBAFGKM have been subdivided into ten subclasses e.g A0, A1 … A9.
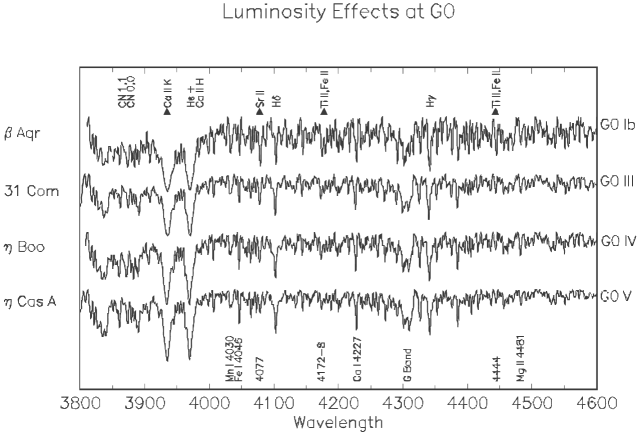
1.1 Luminosity Effects in Stellar Spectra
E. Hertzsprung suggested in 1905 that spectral line widths were related to the luminosity of the stars. He pointed out that at a given apparent magnitude, the low proper motion stars would be at larger distance from us than the high proper motion stars of the same apparent magnitude and hence of higher intrinsic luminosity. These low proper motion stars were found to be exhibit narrower spectral lines so Hertzsprung concluded that these narrow line stars have larger intrinsic luminosity than the broad line stars.
In 1943, W.Morgan, P.C. Keenan and E.Kellman introduced luminosity as second classification parameter. Morgan noticed the near constancy of the gravity along the main sequence in HR diagram and luminosity class parameter was an attempt to identify stars of different gravities and hence radii at nearly constant temperature.
The above mentioned system also known as Yerkes Spectral Classification. Within the system, six luminosity classes are defined on the basis of standard stars over the observed luminosity range.
The Six classes are:
Ia: most luminous supergiants
Ib: less luminous supergiants
II: luminous giants
III: normal giants
IV: subgiants
V: main sequence stars
The main sequence class (dwarfs) are the stars at the main sequence, sustaining themselves through the conversion of hydrogen to helium by nuclear fusion in the stellar core, giant is a post main sequence star which is no longer burning hydrogen at the core but has H-burning shell outside the core. Giants as well as supergiant have comparable mass to dwarfs but have expanded to a much larger radii resulting in a decrease in their surface gravities. The spectral lines appear broad in the dense atmospheres of dwarfs primarily due to pressure broadening and Stark broadening while the same line would appear narrow in the low gravity atmospheres of supergiants.
The luminosity effects are not restricted to the narrowing of strong lines. The line strengths and ratios of line strengths of neutral and ionized species also show remarkable variations over spectral classes and luminosity types and have been used for defining the subclasses and luminosity types. In addition, there are well-known luminosity indicators such as the emission components in the lines of CaII H and K in late type stars which are related to the luminosity (absolute magnitude) of the stars and the calibration of this relationship has been carried out by O. Wilison and M.K.V.Bappu in 1957. The strength of near IR OI triplet at 7771-75 has been used by Osmer (1972), Arellano Ferro, Giridhar and Goswami (1991) Arellano Ferro, Giridhar and Rojo Arellano (2003) for absolute magnitude calibration of A-G stars. In the next section, we will describe the line strengths and their ratios which are used to define the spectral classes and luminosity types.
2 Classification Criteria for various spectral types
Beginning from O stars which are hottest, we will briefly describe the spectral characteristic for each spectral class and also list the spectral type and luminosity class indicators. Most of the information for this tutorial section is taken from Jascheck and Jascheck (1987). The figures used in this section illustrating the different spectral types and also the luminosity effects at various spectral types are taken from ”A Digital Spectral Classification Atlas v1.02 ” by R.O.Gray with his permission. More figures can be found on the website http://nedwww.ipac.caltech.edu/level5/Gray/frames.html.
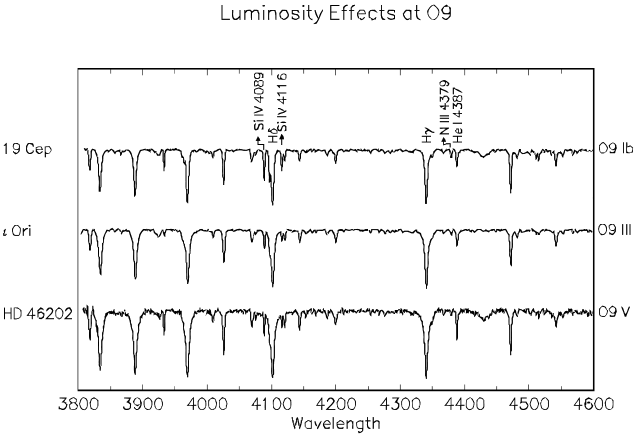
O-type Stars
These are hot stars with temperature range of 28,000K to 50,000K. These stars exhibit strong lines of neutral and ionized helium. The strength of HeII lines decrease and HeI as well HI lines increasei in strength towards later O-types. Over the spectral range O4 to B0 the line strength of HeII line at 4541Å decreases from 800mÅ to 200mÅ , while HeI line at 4471Å increases from 100mÅ to 1000mÅ and that of HI line at 4341Å increases from 1.5Å to 2.5Å . The O-type spectra also exhibit the features of doubly and triply ionized carbon, nitrogen, oxygen and silicon. The line ratios such as CIII 4649/ HeII 4686 are used for luminosity classification. Similarly, the ratio of Si IV / HeI4143 serves as good luminosity indicator in late O type stars. Wolf-Royet stars are a special family of O-type stars that are characterized by broad emission lines of ionized helium, carbon (WC sequence) or nitrogen (WN sequence). The WC stars exhibit emission lines of HeII such as HeII 4686, ionised carbon such as CII4267, CIII 3609,4187,4325,4650 etc CIV 4441,4658,4758 etc and lines of OII,OIII, OIV and OV. These star are subdivided into WC classes from WC2-WC10 based upon the line ratios of CIII5696/OV 5592, CIII5696 / CIV5805 etc.
The WN stars exhibit emission lines of HeII , NIII4097, 4640,5314, NIV 3483,4057 and NV 4605,4622. These stars are also subdivided into WN subclasses using the line ratios such as NIII4640 / HeII4686.
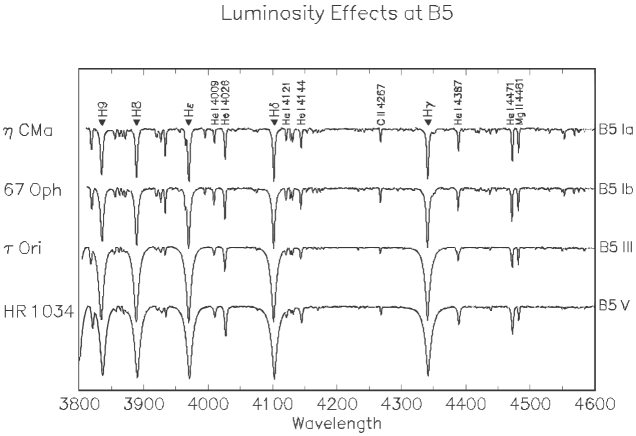
B-type Stars
The B type spectra contains lines of HeI, HI, CII, CIII, NII, NIII, OII, SiII, SiIII, SiIV, MgII. The lines of higher ionized states of C,N,O are present in early B stars. The maximum strength of HeI line reaches near B2. Many B stars are fast rotators and a emission lines are present in some of them.
The line ratios SiIII / SiIV , SiII 4128-30 / HeI 4121 and SiII 4128-30 / HeI 4144 are used for spectral class determination. The luminosity criteria used include the ratios of features at 4119 (SiIV+HeII) / 4144 (HeI), 4481 (MgII) / 4471 (HeI) which increase with luminosity. Profiles of Balmer lines become narrower with luminosity. These are blue white stars with temperature range of 10,000K to 28,000K.
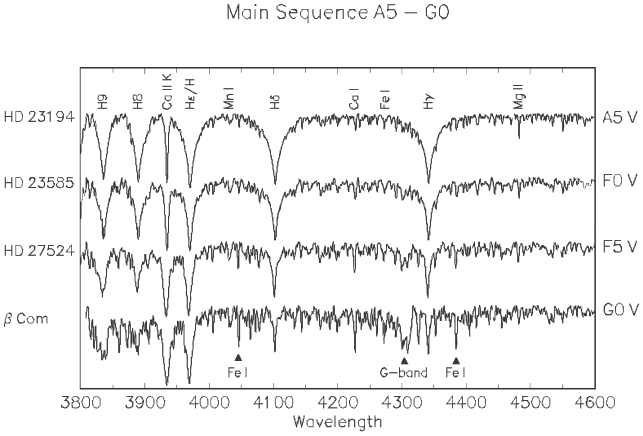
A-type Stars
These are white stars with temperature range of 7,500K to 10,000K. The A type stars exhibit strong hydrogen lines of Balmer series. The hydrogen lines are strongest at spectral type A2. The Hγ has a strength of 13.6 at A0, 17 at A2 and decreases to 13 at A7 and to 8 at F0. The similar pattern is followed by other lines of Balmer series. The metallic lines gradually increase in strength from A0 to A9. The helium lines are absent. To assign subclasses the line ratios CaI4227 / MgII 4481, FeI 4045 / FeII 4173, MgII 4481 / FeI 4485 MgII 4481/ FeII 4416 are useful. However other line ratios are also used. The luminosity criteria used are blend ratios such as FeI,FeII 4383-85 / MgII 4481, FeII 4417 / MgII 4481 which become stronger towards higher luminosity. The hydrogen lines also become narrower towards higher luminosity. The additional luminosity indicators are SrII 4215 / CaI 4226, FeII 4351 / MgII 4481 which increase at higher luminosity. The near infrared OI triplet at 7771-75 is a very good indicator of luminosity for A-F stars.
Additional sub-classification of A type stars such as Am. Ap, is done based on their chemical peculiarities, magnetic fields and rotation and the presence of emission lines in their spectra.
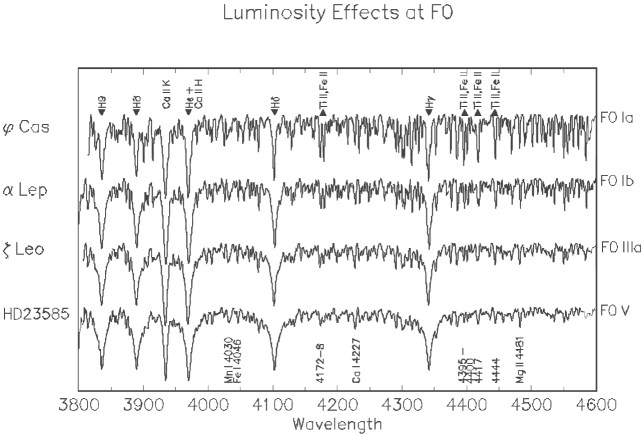
F-type Stars
These are white-yellow stars with temperature range of 6,000K to 7,500K. The F type spectra have large number of metallic lines, Ca II H and K lines are very strong which become stronger than hydrogen lines of Balmer series. The hydrogen lines although present, are on decline from F0- F9. The G band of CH molecule makes its appearance around F3. The Ca II at 3933 increases from 6.5 at F0 to 17.0 at G0, CaI at 4226 increases from 0.25 at F0 to 1.1 at G0 while Hγ decreases from 8 at F0 to 3 at G0. Due to large number of lines present, at the resolution used for classification, most feature are blended. For the spectral class the criteria used are FeI 4045 / Hδ, CaI 4226 / Hγ, MnI 4030-34 / Si II 4128-32 etc.
The CaII lines show positive luminosity effect, ratios Ti II 4444 / MgII 4481, SrII 4077 / FeI4045 , SrII4077 / Hδ are used for luminosity classification.
G-type Stars
These are yellow stars with temperature range of 4,900K to 6,000K. In G type stars the hydrogen lines are further weakened and become comparable to the strength of metal lines. Metal lines are stronger and more numerous towards later G, molecular bands of CH and CN become visible. The spectral types are obtained by taking the ratio of metal lines with those of hydrogen lines e.g. using the raios such as FeI 4384/ Hγ, FeI 4143 / Hδ, FeI 4045 / Hδ, Ca I 4226 / Hδ etc. For Spectral types later than G5 the CaI 4226 / Hδ can be used. The line ratios such as CrI 4254 / FeI 4250 or CrI 4742 / FeI 4271 are recommended for stars showing compositional anomalies such as weak metal line stars or weak G band stars.
Luminosity effects at low dispersion can be seen through CN bands. The ratio of the SrI+FeI blend at 4216 / Ca I 4226 is known to be luminoity sensitive. Ratios of YII+FeI at 4376 / FeI 4383, SrII 4077/ Hδ is also known to be luminosity sensitive but will not be suitable for stars with anomalous s-process abundances. MgI triplet at 5167-83 are luminosity sensitive for spectral type range G8-K5.
K-type Stars
These are orange stars with temperature range of 3,500K to 4,900K. In these stars the hydrogen lines are very weak but strong numerous metal lines are seen. The CaII lines are very strong and CH molecular band like G band becomes very strong. In late K stars TiO and VO bands are also seen.
The line ratios for spectral type used are CrI 4254 / FeI 4250, CrI 4254 / FeI 4260, CrI 4254 / FeI 4271. Additional qualifiers are TiI 3999 / FeI 4005, FeI 4144 / Hδ, CaI 4226 / FeI 4250. The TiO band becomes visible at K7 and MgH at K5.
The CN band increases with luminosity, so does H 4101 / FeI 4071. SrII 4077 / FeI 4063, TiII /4400,08 /FeI 4405 also increase with luminosity.
Carbon Stars
A carbon star is a late type giant with strong bands of carbon compound but no metallic oxide band. In their spectra, very intense bands of C2, CN and CH are present but no bands of TiO, VO are seen. The carbon stars as a group have been studied by Secchi(1868) although in older classification they were given two different types R and N. The R type stars were similar to late G and early K but exhibited very strong Swan C2 band around 4700 and 4395 which is as strong as G-band of CH. In N stars the the Swan band is so strong that the spectrum appears chopped up into the section of different intensities. Although based upon CN band (at 4216 and 3833) strengths a sequence R0,R1 to R10=N0 and subsequently upto N7 can be defined, but the same pattern is not shown by Swan C2 bands, which become strongest at R5 and weakest at N0 and further strengthening towards later N types. A more detailed study by Shane(1928) revealed that temperature variations over the subclasses are not large and branching of these stars R and N stars is caused by abundance difference in C and O. If oxygen is more abundant than carbon then the spectrum is dominated by oxides like TiO (M stars). Keenan and Morgan (1941) used the term ”carbon stars” instead of R and N wherein the overabundance of carbon varied from the star to star. They established the sequence of carbon stars by means temperature index of CrI 4254 / FeI 4250 and the strength of resonance lines of NaI at 5890-96 which are good temperature indicators for the late spectral type stars. The temperature sequence C0 to C7 covers full range of R0 to N7 which in temperature is very similar to the sequence of G4-M4. J stars are another group of carbon stars characterized by unusually strong isotopic bands of carbon which implies very low C12/C13 ratio.
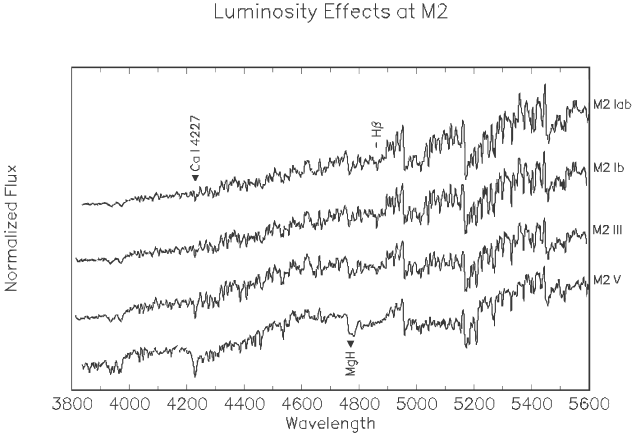
M-type Stars
These are red stars with temperature range of 2,000K to 3,500K. The spectra of M stars are dominated by strong bands of TiO, VO, LaO. The bands used for classification upto M2 are those of TiO at 4584, 4761, 4954 5448. After M3 these bands saturate, those at 5759, 5810 saturate after M5. The VO bands at 5737, 7373, 7865, 7896 become conspicuous after M7.
The luminosity effect in early M type stars can be seen through decrease of CaI 4226 at higher luminosity; a similar negative luminosity dependence is exhibited by Cr I feature at 4254-74-90. Ratios SrII 4077 / FeI 4263 and (YII +FeI ) 4376 / FeI 4386 increase with luminosity. The KI 7699, NaI 8183 and 8185 decrease in intensity from dwarfs to giants. The Ca II triplet at 8498, 8542 and 8662 is a very important luminosity indicator in these stars. It is very weak in dwarfs but becomes very strong in giants and supergiants.
S-type Stars
These stars are similar in temperature to K5 to M stars but exhibit strong bands of ZrO at with band heads at 4640, 5551 and 6474.
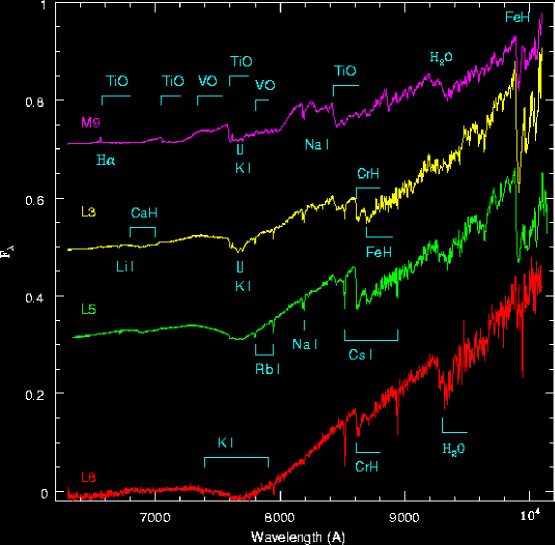
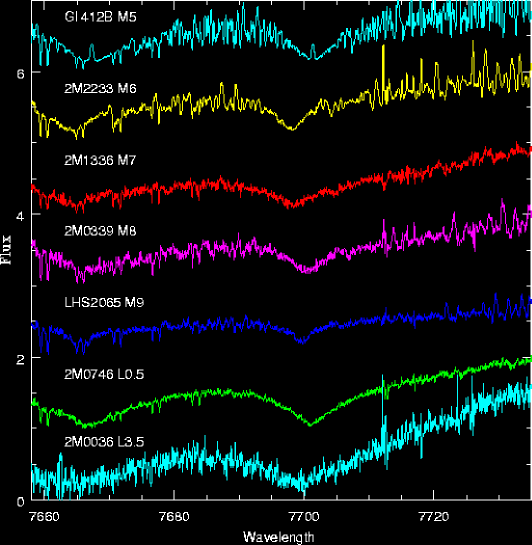
3 New Spectral types L and T
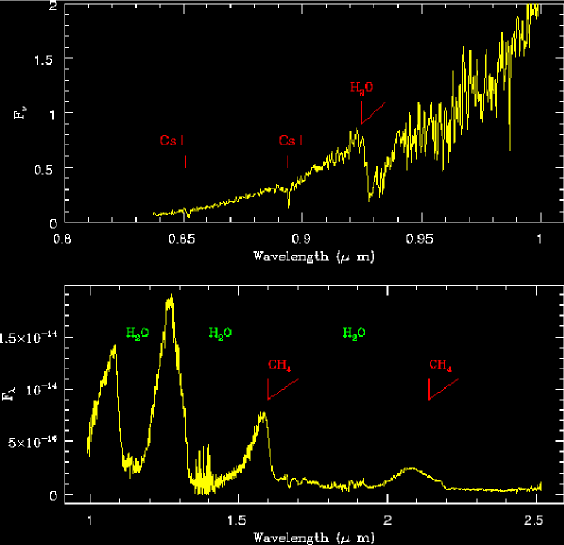
These are the coolest stars with temperatures less than 2500K. Since they are very cool, they emit mostly in infrared wavelengths. The original classification scheme of L dwarfs based on red to far-red spectral region has been described in Kirkpatrick et al. (1999,2000). The L stars have a temperature range of 2500K to 1300K and exhibit some overlapping features with M stars such as TiO, VO although these features do not remain as strong. These features are very weak in L3 and almost disappear at L6 leaving only metal hydride bands of FeH, CaH, CrH. These bands have maximum strength at mid L but become weak in late L types where H2O presents a strong feature at 9300. The atomic features such as resonance lines of RbI at 7800, 7948 and CsI8521, 8945 can be seen in early L and grow in strength throughout the sequence. The resonance line of LiI at 6708 is present in L dwarfs. The KI resonance doublet shows very remarkable change. Being somewhat narrower and weak at M9, it broadens and become strong through L0 onwards such that at L5 two separate cores are indistinguishable and doublet looking like a broad trough is wide; at L8 it is wide. The NaI resonance doublet also follows the same pattern by becoming broad and shallow at L5 .
These spectral variations like disappearance of TiO, VO and other molecular features at later L subclasses are believed to be caused by formation of various types of condensates at the temperatures lower than 2600K. Lodders (1999) have made extensive chemical equilibrium calculations and the atmospheric composition changes as the material is removed from gas to solid phase.
3.1 The T dwarfs
As the brown dwarfs cool to temperatures below 1400K, a drastic change occurs between 1400K to 1200K when CH4 bands become strong while CO band weaken. The CH4 bands are extremely broad in near infrared and they even modify the near infrared broad band colors. Strong methane absorption at 1.6 and 2.2 reduces more than half flux from H and K pass-band giving them unrealistic colors.
A set of flux ratios measuring the strengths of methane and H2O have been attempted to classify the T dwarfs by Burgasser et al (2002) and others. Considerable progress will be made through deeper IR surveys.
4 Modification of MK system
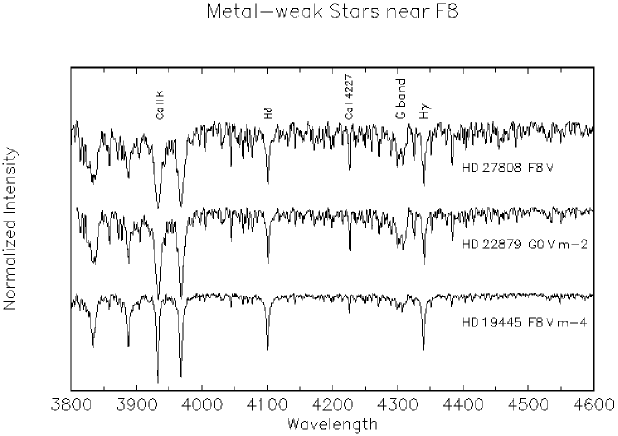
The MK system has gone through extensive research and refinement. The important work in refining and extending the MK system in dimensions beyond the traditional two dimensional spectral type luminosity class grid has been carried out by Keenan and co-workers and the use of third ”metallicity parameter” is recommended. Gray (1989) has carried out the extension of MK system to metal-weak F and G stars. A grid of metal-poor stars standard stars has been prepared with the objective of providing a mean of classifying metal-weak stars using a standard of similar metallicity rather than the old method of comparing the metallic line strengths of the program stars with that of a considerable earlier solar composition standard.
The earlier attempt of deriving spectral types for metal-poor stars relied upon hydrogen line strengths or G-band strength due to their strong temperature dependence. However these classifiers are not adequate; the hydrogen line strengths do depend upon other stellar parameters and are not suitable at the later spectral types. Corbally (1987) pointed out that the ratio of CrI resonance triplet at 4254, 4274, 4290 to the neighboring lines of FeI at 4251, 4272, 4362 arising from excited level is nearly independent of metallicity and hence can serve as temperature indicator. For luminosity classification the ratios of features like Ti II, Fe II 4172-9 / Fe I 4203, 4271 is useful for F stars while for G stars SrII 4077/ FeI 4063, 4046 and Fe,YII 4373/ 4383 features may be useful since these lines (blends) are very strong and remain discernible even at low metallicity. A list of standard stars for metallicity classification can be found in Gray(1989).
5 Contemporary methods of spectral classification
Stellar classification has been an important tool in stellar and Galactic astronomy since it provides empirical measure of the fundamental stellar parameters such as the temperatures, luminosity and metallicity.
The massive surveys both ground based as well from space missions provide large number of stellar spectra covering distant components of Galaxy. To understand the complex evolutionary history of our Galaxy, rapid and accurate methods of stellar classification are necessary. A short review of the automated procedures are presented here. The most commonly used automated spectral classification methods are based on (a) Minimum Distance Method (MDM) (b) Gaussian Probability Method (GPM), (c) Principal Component Analysis (PCA) and (d) Artificial Neural Network (ANN). It is beyond the scope of this talk to explain all of them. We chose to describe only two of them to introduce the automated approach of classification.
In MDM, the classification is done by minimizing the distance metric between the object to be classified and each member of a set of templates. The object is assigned the class of the template, which gives the smallest distance. In this approach the number of templates used to define subclasses limit the accuracy of classification. Interpolation can be made to make intra-class assignment. Katz et al. (1998) used this method with 2 minimizing on high resolution Elodie spectra using a large number of reference stars of known Teff, log and [M/H] to derive atmospheric parameters of target stars. These authors achieved accuracy of 86 K in Teff, 0.28 in log and 0.35 in [M/H].
The Neural Network methods have become very popular due to their speed and objectivity. As explained in the papers by Bailer-Jones et al. (1998,2002), Ted von Hippel et al. (1994), Singh et al.(2002) and more recently in Giridhar, Muneer & Goswami (2006), is a computational method which can provide non-linear parametrized mapping between an input vector (a spectrum for example) and one or more outputs like SpT, LC or Teff, log and [M/H]. For the network to give required input-output mapping, it must be trained with the help of representative data patterns. These could be stellar spectra ( or a set of line strengths measured from a spectrum) for which classification or stellar parameters are well determined. The training procedure is a numerical least square error minimization method. The training proceeds by optimizing the network parameters (weights) to give minimum classification error. Once the network is trained the weights are fixed, the network can be used to produce output SpT, LC or Teff, log and [M/H] for an unclassified spectrum.
The ANN has been used in very large number of stellar applications. Vieira and Ponz (1995) have used ANN on low-resolution IUE spectra and have determined SpT with an accuracy of 1.1 subclass. Bailer-Jones, Irwin and von Hippel (1998) used ANN to classify spectra from Michigan Spectral Survey with an accuracy of 1.09 SpT. Allende Prieto et al. (2000) used ANN in their search of metal-poor stars. Snider et al. (2001) used ANN for the three dimensional classification of metal-poor stars.
We have made a modest effort to use ANN for parametrization of a sample of stars in temperature range 4500 to 8000 K. We have used a medium resolution Cassegrain spectrograph with the 2.3 m Vainu Bappu Telescope at VBO, Kavalur, India to get spectra at resolution (R) of 2000. Using the 90 spectra for stars of known parameters, and ANN of 680:11:3 architecture we could attain an accuracy of 200K in temperature and 0.3dex in metallicity.
It is very important to envisage an approach that would give quick, reliable spectral classifications (or stellar parameters) for stars falling in all regions of HR diagram. The pipeline procedures are being developed for the future ambitious missions such as Gaia, Pan-Stars.
References
- (1) C.Allende Prieto, R.Rebolo, et al. AJ, 120, 1516, (2000)
- (2) A.Arellano Ferro, S.Giridhar and A.Goswami, MNRAS, 250, 1, (1991)
- (3) A.Arellano Ferro, S.Giridhar and E.Rojo Arellano , RMxAA 39, 3, (2003)
- (4) C.A.L. Bailer-Jones, M.Irwin,& T. von Hippel, MNRAS, 298, 361, (1998)
- (5) C.A.L. Bailer-Jones, An Introduction to Artificial Neural Networks In: Automated Data Analysis in Astronomy, Eds R.Gupta,H.P.Singh et al. (New Delhi; London : Narosa Pub. House), p83, (2002)
- (6) A.J.Burgasser et al. ApJS, 24, 247 (1972)
- (7) C.J.Corbally, AJ, 94, 161, (1987)
- (8) C.Jaschek, and M.Jaschek, The classification of stars, Cambridge University Press,Cambridge 1987
- (9) S.Giridhar, S.Muneer & A. Goswami, MmSAI, 77, 1130
- (10) R.O.Gray, AJ, 98, 1049, (1989)
- (11) R.O.Gray, A Digital Spectral Classifcation Atlas V1.02, 2003
- (12) D.Katz, C. Soubiran et al. A&A, 338, 151 (1998)
- (13) J.D.Kirkpatrick, I.N. Reid, J. Liebert, et al. ApJ 519,802,(1999)
- (14) J.D.Kirkpatrick, I.N. Reid, J. Liebert, et al. AJ 120,447,(2000)
- (15) K.Lodders, ApJ, 519, 793 (1999)
- (16) P.S.Osmer, ApJS, 24, 247 (1972)
- (17) B.R.Oppenheimer, S.R.Kulkarni, ApJ 502, 932 (1998)
- (18) I.N.Reid, J.D.Kirkpatrick et al. AJ, 119, 369 (1999)
- (19) A.Sechhi, Mem. Soc. Ital. Sciencze (2),3, 73 (1868)
- (20) H.P.Singh, C.A.L. Bailer-Jones, R.Gupta, Principal Component Analysis and its Application to Stellar Spectra In: Automated Data Analysis in Astronomy, Eds R.Gupta,H.P.Singh et al. (New Delhi; London : Narosa Pub. House), p69, (2002)
- (21) C.D.Shane, Lick, Bull. 13, 123 (1928)
- (22) S.Snider, C.Allende Prieto, T.von Hippel et al. ApJ, 562,528,(2001)
- (23) E.F. Vieira,J.D.Ponz, A&AS,111,393, (1995)
- (24) T. von Hippel,L.J. Storrie-Lombardi et al. MNRAS, 269, 97, (1994)
- (25) O.C.Wilson, M.K.V.Bappu, ApJ, 125, 661 (1957)