Flux pinning in (1111) iron-pnictide superconducting crystals
Abstract
Local magnetic measurements are used to quantitatively characterize heterogeneity and flux line pinning in PrFeAsO1-y and NdFeAs(O,F) superconducting single crystals. In spite of spatial fluctuations of the critical current density on the macroscopic scale, it is shown that the major contribution comes from collective pinning of vortex lines by microscopic defects by the mean-free path fluctuation mechanism. The defect density extracted from experiment corresponds to the dopant atom density, which means that dopant atoms play an important role both in vortex pinning and in quasiparticle scattering. In the studied underdoped PrFeAsO1-y and NdFeAs(O,F) crystals, there is a background of strong pinning, which we attribute to spatial variations of the dopant atom density on the scale of a few dozen to one hundred nm. These variations do not go beyond 5 % – we therefore do not find any evidence for coexistence of the superconducting and the antiferromagnetic phase. The critical current density in sub-T fields is characterized by the presence of a peak effect, the location of which in the –plane is consistent with an order-disorder transition of the vortex lattice.
pacs:
74.25.Sv; 74.25.Uv; 74.70.Xa ; 74.25.Wx ; 74.62.EnI Introduction
The characterization of the physical properties of new superconducting materials such as the recently discovered iron-pncitide superconductors Kamihara2006 ; Kamihara2008 ; Takahashi2008 ; Chen2008 ; Ren2008 ; Ren2008ii ; Kito2008 requires a good knowledge of sample morphology and microstructure. The measurement and interpretation of thermodynamic quantities such as the magnetization, the magnetic torque,Kubota2008 or the specific heat, or transport properties such as the resistance or irreversible magnetization, may be complicated by material inhomogeneity on mesoscopic or macroscopic length scales. On the other hand, microscopic disorder is well-known to be beneficial for vortex line pinning and high critical currents. Finally, from the defect-vortex interaction, one might hope to extract information on electronic scattering mechanisms in the iron-pnictide superconductors, as well as on the premise of phase co-existence. In underdoped pnictides especially, it has been argued that the coexistence of the low-doping anti-ferromagnetic state and the superconducting state at higher doping levels may affect physical properties.Drew2008
Vortex pinning and the critical current density in the iron pnictide superconductors has mainly focussed on the so-called “122” compounds, since large single crystals of these are available. Most notably, magnetic flux penetration in Ba(Fe0.93Co0.07)2As2 has been studied using magneto-optical imaging by Prozorov et al..Prozorov2008 ; Prozorov2009 The same authors reported on the irreversible magnetization and flux creep in this compound, and found qualitative agreement with collective creep in the so-called bundle regime.Blatter94 The non-monotonous behavior of the sustainable current as function of magnetic field was interpreted in terms of a crossover to plastic creep.Prozorov2008 A similar behavior was found for crystals with different doping levels;Prozorov2009 ; Shen2010 the overall behavior of the critical current density as function of doping was attributed to the changing density of structural domain walls, that act as strong pinning centers.Prozorov2009ii Yamamoto et al. obtained similar results on the same Ba(Fe0.9Co0.1)2As2, but attributed the temperature- and field-dependent features of the critical current density to an inhomogeneous distibution of Co atoms.Yamamoto2009 Very large critical currents, as well as a non-monotonous width of the irreversible magnetization loops correponding to a peak-effect in the critical currentKokkaliaris99 ; Rassau99 ; vdBeek2000ii ; Paltiel ; Klein2010 were measured by Yang et al. in single crystalline Ba0.6K0.4Fe2As2,Yang2008ii who concluded to the presence of small-sized normal state regions in their samples. Finally, irreversible magnetization and flux creep measurements were conducted on SmFeAsO0.9F0.1 Yang2008 and polycrystalline NdFeAsO0.82Fe0.18,Prozorov2008ii ; Wang2008 members of the “1111” family of compounds. In all the above cases, the critical current at low fields was characterized by a peak and negligible magnetic relaxation, followed by more pronounced thermally activated flux motion at higher fields, which was found to be in qualitative agreement with the collective creep theory.Blatter94 However, no quantitative analysis of the data has been performed, and no definite consensus as to the defects at the origin of flux pinning has been established.
The aim of the present paper is the identification of defects responsible for flux pinning in single crystals of the (Re)FeAsO “1111” family of superconducting compounds. The microstructure is characterized by the undulation of the FeAs layers and the presence of sparse nanometer-sized defects, both of which do not seem to influence flux pinning. The largest contribution to the critical current is shown to arise from the dopant atoms, which act as scatterers for quasi-particles in the vortex cores. One therefore deals with pinning by local variations of the mean-free path ( mechanism). The temperature- and field dependence of is very well described by collective flux pinning in the single-vortex limit, but superposed on a strong pinning contribution arising from small fluctuations of the doping level on the scale of dozens of nm.
II Experimental Details
PrFeAsO1-y crystals (with the P4/mmm structure) were grown at 1300∘C and 2 GPa from pressed pellets consisting of the starting materials PrAs, Fe, and Fe2O3, in the nominal composition PrFeAsO0.6.Ishikado2009 ; Okazaki2009 The typical size of the crystals is m3; the average final composition corresponds to . A number of monolithic crystals from this batch has been previously used for the measurement of the superfluid density,Hashimoto2009 the field of first flux penetration,Okazaki2009 and the electrical resistivity in the vicinity of the upper critical field (with the coherence length).Okazaki2009 The superconducting properties of the compound are therefore completely characterized. The temperature dependence of the in-plane penetration depth (for currents parallel to the plane) is well described by a simple two-gap model, without any nodes of the order parameter. The magnitude of the low temperature penetration depth is nm.Okazaki2009 Table 1 gathers the superconducting parameters of PrFeAsO1-y, including the characteristic energy (corresponding to times the condensation energy), the low-field anisotropy ratio , and the depairing current ( Hm-1).
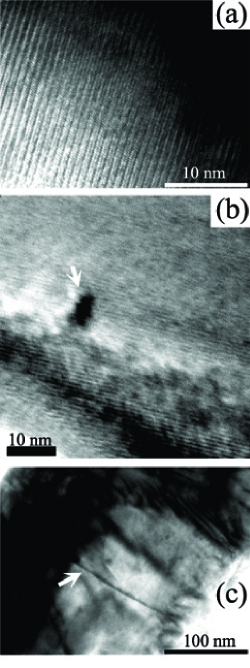
Several PrFeAsO1-y crystals were prepared for Transmission Electron Microscopy (TEM). In each case, two crystals, of lateral dimensions m, were glued between 0.5 mm thick Si platelets; these were then thinned down until the crystals were flush with the edges. Further thinning yielded sections parallel to the -axis, suitable for TEM. Figure 1a, a high resolution image of one of the sections, shows clear contrast corresponding to the FeAs planes, with some undulation. The presence of 5 - 10 nm sized defects, possibly secondary phase precipitates, is also observed (Fig. 1b). These defects are separated by a distance of the order of several dozen to several hundred nm, depending on location. Finally, Fig. 1 shows contrast associated with the presence of a linear dislocation core, occasional examples of which were found.
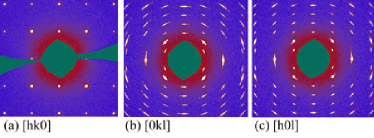
Three PrFeAsO1-y crystals (# 1, 3, and 7) were characterized by X-ray diffraction using 28.3 keV (0.43811 Å) radiation on the CRISTAL beam at the SOLEIL synchrotron. Images of diffraction spots were collected on a 2D CCD detector when the sample was rotated around an axis in the plane. From the 360 measured images, successively collected during 1 s after a progression of 1∘ of the crystal rotation, layers of reciprocal space were numerically reconstructed. Three such sections, containing the origin, are shown in Fig. 2. The [hk0] section reveals very good translational order in the basal plane. However, the fulfilment of the Laue condition over extended streaks in the [h0l] and [0kl] planes shows that crystalline order along the -axis is not as good. The pronounced elongation of both low- and higher order nodes in the [00l] direction indicates that this disorder more than likely originates from the undulation of the planes observed in TEM. Other kinds of -axis disorder such as stacking faults or anti-phase boundaries would have yielded a larger broadening of nodes outside the [hk0] plane, as compared to the lower order nodes. From the elongation of the nodes at [100] and [010], we estimate the buckling of the layers to result in a variation of their orientation of up to 5∘. The same results were obtained for all studied crystals.
The NdFeAsO0.9F0.1 crystals used in this study are the same as that of Ref. Kacmarcik2009, ; they were synthesized at high pressure in a cubic, multi-anvil apparatus. The crystals, extracted from a polycrystalline batch, had dimensions m3 (# 1) and m3 (# 2), and critical temperatures K (# 1) and K (# 2). The superconducting parameters of NdFeAs(O,F) of this particular doping level have been studied in Refs. Kacmarcik2009, and Pribulova2009, , and are summarized in Table 1.
| compound | ||||||
|---|---|---|---|---|---|---|
| PrFeAsO0.9 Okazaki2009 | 280 nm | 0.4 | 1.8 nm | Jm-1 | Am-2 | |
| NdFeAsO0.9F0.1 Pribulova2009 ; Kacmarcik2009 | nm | 0.25 | 2.4 nm | Jm-1 | Am-2 |
In order to obtain the value and local distribution of and , flux penetration into the superconducting crystals was imaged using the direct magneto-optical imaging (MOI) method.Dorosinskii92 Crystalline inhomogeneity in the vicinity of the critical temperature was characterized using the Differential Magneto-Optical (DMO) method.Soibel99 In MOI, a ferrimagnetic garnet indicator with in-plane anisotropy is placed on top of the sample under study, and observed using a polarized light microscope. The presence of a non-zero perpendicular component of the magnetic induction is revealed, by virtue of the Faraday effect of the garnet, as a non-zero intensity of reflected light when the polarizers of the microscope are (nearly) crossed. Thus, light areas in the MO images correspond to areas of high perpendicular induction, while dark regions have small or zero . In DMO, magneto-optical images taken at applied fields and (with Oe) are subtracted; the procedure is repeated 100 times, and the subtracted images averaged.
The local critical current density of the investigated crystals was obtained by calibrating the luminous intensity of the MOI images, so as to obtain a map of the local induction. was then determined as twice the gradient of the local flux density, measured over an interval of length 20 m perpendicular to the sample boundary, and averaged over a width of 20 m, (parallel to the sample boundary). This procedure is justified in that, given our crystals’ aspect ratio, flux profiles at the sample surface are nearly linear.Brandt96 In what follows, the area over which was measured was chosen such that Oe over the m2 region.
Further measurements were carried out using a micron-sized Hall probe array, tailored in pseudomorphic GaAlAs/GaAs heterostructure. Shibauchi2007 ; Okazaki2009 The 10 Hall sensors of the array had an active area of m2, while an eleventh sensor was used for the measurement of the applied field. The Hall probe magnetometry technique is complementary to magneto-optical imaging in that it has greater sensitivity and can be used up to substantially higher magnetic fields; on the other hand, it only allows the measurement of along the array of sensors, and not over the entire two-dimensional sample surface.
III Results
III.1 PrFeAsO1-y
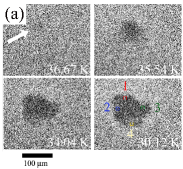
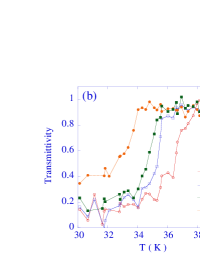
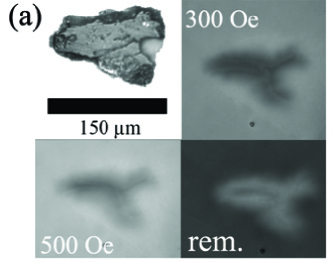
Spatial inhomogeneity of the critical temperature in single crystals was investigated by the DMO images near the transition. A typical example is shown in Fig. 3a, depicting four DMO images, acquired with a Oe modulation in the absence of a static field, at various temperatures spanning the normal-to-superconducting transition. In this particular case, diamagetic screening first appears at K in the upper left-hand corner of the crystal. Magnetic flux is progressively excluded from the crystal bulk, until the largest part is fully screened at K. However, the small grain at the bottom is only fully screening at K. Fig. 3b shows the ac permeability, determined from the luminous intensities as , for four regions indicated in the last panel of Fig. 3a. It is seen that, locally, the crystal shows sharp transitions to the superconducting state. However, a global measurement (e.g. by a commercial magnetometer) would clearly result in a broadened transition.
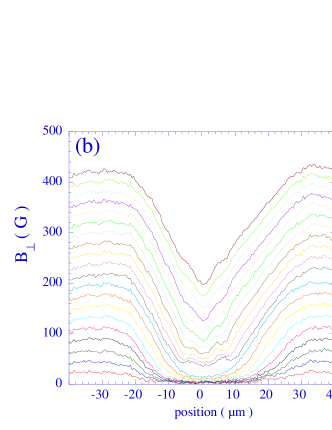
Local values of the critical current density are obtained from the MO imaging of the largest grains in polycrystalline conglomerates, or from the flux distribution in monolithic crystals, such as depicted in 4a, for PrFeAsO1-y crystal # 7. The magnetic flux distributions in such crystals are characteristic of the Bean critical state;Brandt96 ; Bean62 ; Brandt93 ; Zeldov94 Fig. 4 shows an example of profiles obtained across the central part of crystal # 7 at K. Due to the relatively large thickness-to-width ratio of the crystal, , flux profiles resemble straight lines; can be straightforwardly obtained from the flux density gradient.Brandt96
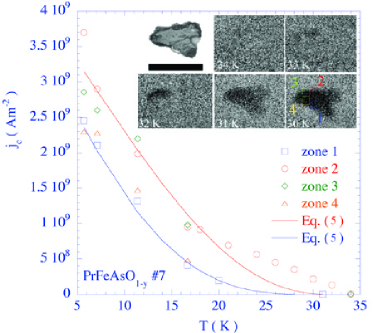
Resulting values of the critical current density in four areas of PrFeAsO1-y crystal # 7 are shown in Fig. 5, as function of temperature. The inset to the Figure reveals the inhomogeneity of for this particular crystal; the regions in which was measured are also indicated. It is found that Am-2 at the lowest measured temperature. The temperature dependence depends on location. Low areas show a smooth decrease with temperature, whereas regions where is higher feature a crossover in the temperature dependence. Similar behavior is found in all investigated PrFeAsO1-y crystals, see Fig. 6. We shall, in section IV, attribute this behavior to the additive effect of weak collective pinning by oxygen dopant atoms, yielding a strong temperature dependence, and strong pinning, with a weak temperature dependence, coming from disorder of the doping level on the scale of 10 - 100 nm .
.
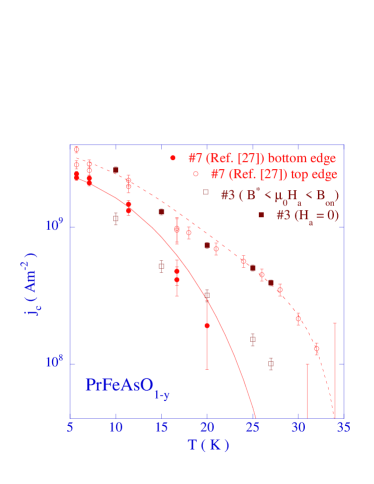
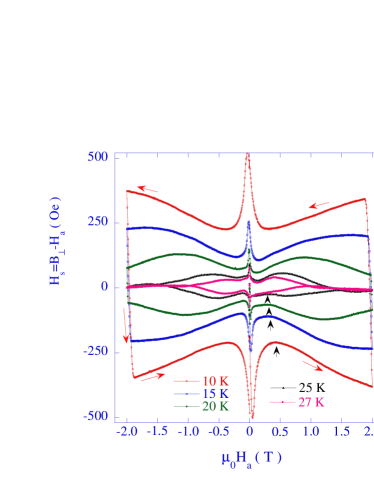
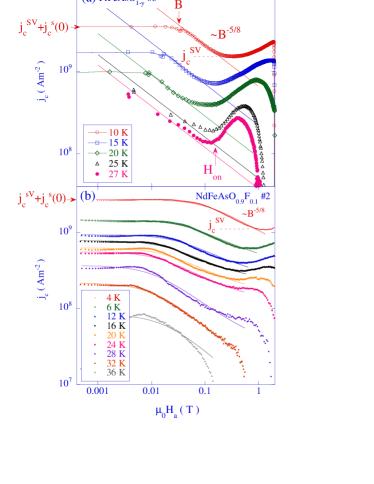
Measurements in higher magnetic fields were performed using the Hall array magnetometry technique. Typical results for the self-field, defined as , measured on the central part of the top surface of crystal # 7, are shown in Fig. 7. The screening current density is proportional to the difference measured on the decreasing– and increasing field branches, respectively. A clearly non-monotonous field-dependence of the critical current is observed, with the sustainable current density rapidly decreasing as the is first increased, followed by an intermediate regime of constant . Fig. 11(a) shows that the low-field behavior, a plateau up to , followed by a power-law decrease , is archetypal for a strong pinning contribution to the critical current. However, at intermediate fields, around 0.1 T in Fig. 11(a), does not vanish, but saturates at a value - Am-2 at low temperature. The temperature dependence of the zero-field– and intermediate (constant) values of the critical current are plotted in Fig. 6. One sees that the contribution is spatially rather more homogeneous, and also that it corresponds to the critical current measured in the most weakly pinning areas of the crystals. Below, we shall attribute this contribution to weak collective pinning by dopant atoms. The strong pinning contribution strongly depends on the location at which it is measured, and it is responsible for the larger measured critical current densities.
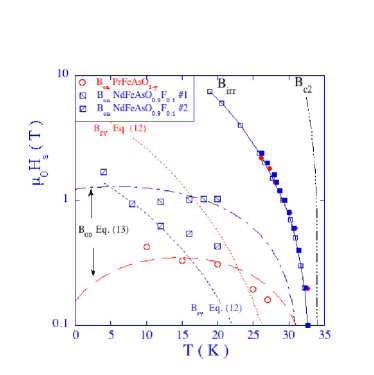
Finally, we turn to higher applied magnetic fields. It is observed that the hysteresis loops open up at a field , corresponding to the increase of at the so-called “fishtail” or peak–effect.Prozorov2008 ; Kokkaliaris99 ; Paltiel ; Klein2010 ; Shen2010 ; Yang2008 ; Yang2008ii ; Wang2008 The data are collected, together with the irreversibility fields determined from the appearance of a third harmonic component in the ac-response vdBeek95ii , in Fig. 12.
As in previous studies on other iron pnictide superconductors,Prozorov2008 ; Yang2008 ; Shen2010 ; Yang2008ii ; Wang2008 the local flux density in Tesla fields is observed to decay with time, with a typical relaxation rate for fields below and for . As in other studies,Shen2010 magnetic relaxation was not observed to affect the low-field MO data. it therefore does not affect the measured temperature dependence of the critical current density in what follows.
III.2 NdFeAsO1-xFx
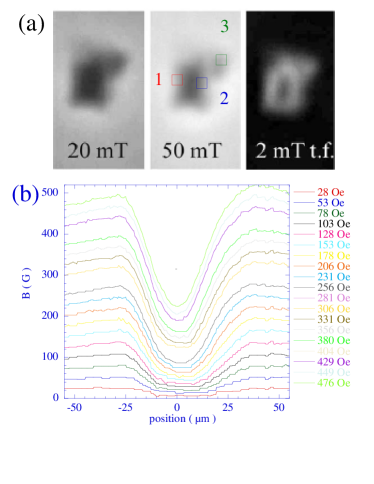
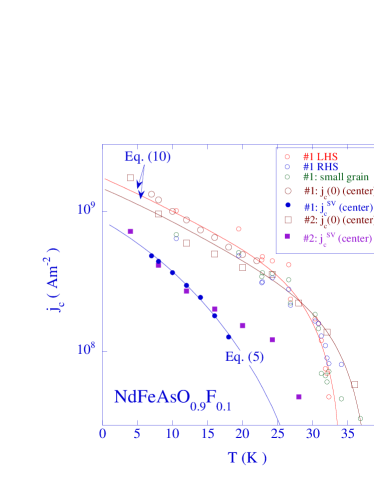
Fig. 8a shows magneto-optical images of flux penetration into NdFeAsO0.9F0.1 crystal # 1. The sample turns out to be a bicrystal, with a similar spread in as observed in PrFeAsO1-y. As shown by Fig. 8b, flux distributions inside the crystalline grains are well-described by the Bean critical state model.Brandt96 Local values of the critical current density at Oe were obtained in the same manner as described above. Results for the three regions outlined in the center panel of Fig. 8a are rendered as function of temperature in Fig. 9, together with results obtained by Hall probe magnetometry over the central regions of crystals #1 and 2. Field-dependent results are shown in fig. 11(b). The overall behavior recalls that reported in Ref. Wang2008, , and is very similar to that observed in PrFeAsO1-y: high critical current areas correspond to a large local contribution of strong pinning, whereas the lower measured at intermediate fields much above corresponds to the critical current density in the more weakly pinning areas of the crystals. In contrast to PrFeAsO1-y, the strong pinning contribution outweighs by a factor 2–3. NdFeAsO(O,F) crystal # 2 shows a clear “fishtail” or peak-effect, the corresponding values are plotted in Fig. 12. A hint of a peak-effect is also observed in crystal # 1, but the relative increase of the sustainable current density is much more modest than in the other investigated samples, with data resembling those of Ref. Wang2008, . Finally, Fig. 12 shows that the irreversibility field measured from the onset of screening Kacmarcik2009 coincides with that determined from the onset of a third harmonic response in ac Hall-probe array magnetometry. Moreover, the irreversibility field for NdFeAs(O,F) and PrFeAsO1-y crystals with the same are, within experimental accuracy, identical.
IV Discussion
IV.1 Weak collective pinning
We start by analyzing the critical current contribution in terms of the weak collective pinning theory.Larkin79 ; Blatter94 ; Blatter2008 The vortex lattice order is characterized by the transverse and longitudinal displacement correlation lengths
| (1) | |||
| (2) |
where denotes the deformation field of the vortex lattice at position (with ), and is the range of the pinning potential.Brandt86 The transverse displacment correlation length
| (3) |
can be obtained, without a priori assumptions, from the value of the critical current density. Using the appropriate parameters (Table 1), one has, for Am-2, nm in single crystalline PrFeAsO1-y, and nm corresponding to Am-2 in NdFeAsO0.9F0.1. These values are much smaller than the intervortex spacing at 300 Oe, at which the data in Figs. 5, 6, and 9 were obtained. The pinning-induced displacement of each vortex is thus independent of that of neighboring vortices. In this so-called single vortex pinning limit, one may now estimate the longitudinal displacement correlation length as
| (4) |
one finds nm and 10 nm for PrFeAsO1-y and NdFeAsO0.9F0.1, respectively. This length largely exceeds the spacing of the FeAs planes, which clearly establishes pinning as being in the three-dimensional single-vortex (3DSV) limit.Blatter94 ; Blatter2008
From here on, we show that the critical current density in the (1111) iron oxypnictide superconductors can be understood as arising from mean-free path variations induced by the dopant atoms, oxygen vacancies in the case of PrFeAsO1-y, and F ions in the case of NdFeAsO0.9F0.1. The pinning force of a single defect is expressed as , where is the transport scattering cross-section, is the effective ion radius, and is the Gor’kov function. The disorder parameter , with the Fermi velocity, the mean free path, and the (temperature-independent) Bardeen-Cooper-Schrieffer coherence length.Thuneberg84 ; Blatter94 The critical current is determined by the fluctuation of the elementary pinning force, , and reads vdBeek2002
| (5) | |||||
| (6) |
The numerical factor under the parentheses in Eq. (5) depends on the precise type of scattering.Thuneberg84 Since the temperature dependences and are known from Refs. Okazaki2009, and Pribulova2009, (yielding for PrFeAsO1-y and for NdFeAsO0.9F0.1), one is in the position where a full consistency check of both the magnitude and the temperature dependence of is possible.T-dependence
In the case of PrFeAsO1-y, Eq. (5), we start from the hypothesis that O vacancies are responsible for the lion’s share of flux pinning. The ion radius m. Inserting this value into Eq. 5 reproduces the low-temperature value Am-2 with the single free parameter m-3. This nicely corresponds to 0.1 O vacancy per formula unit (half a unit cell of volume 65 Å3). Eq. (5) reproduces the low- temperature dependence of the critical current density in the high- regions, and the temperature dependence over the full range from 5 K to in the low- regions. The spatially more homogeneous contribution to the critical current density of oxygen deficient single crystalline PrFeAsO1-y is therefore well-described by pinning by O-vacancies by the mechanism.
In the case of NdFeAsO0.9F0.1, the analysis is hindered by our ignorance of the effective scattering cross-section: doping is through chemical substitution, not oxygen depletion. If one adopts the view that F substitution is at the origin of pinning, one has m-3 for our average doping level. To reproduce the value of the measured low- Am-2 then requires m2, corresponding to an effective defect radius of 0.9 Å(this can be compared to the F ion radius of 1.3 Å). The temperature dependence of is again very well described by Eq. (5). It is not quite as strong as in PrFeAsO1-y, an effect that can be attributed to the different –dependence of the penetration depth [ nearly perfectly follows ] and of the anisotropy ratio ( seems to be nearly independent of temperature in NdFeAs0.9F0.1).Pribulova2009
IV.2 Spatial variations of and link with doping
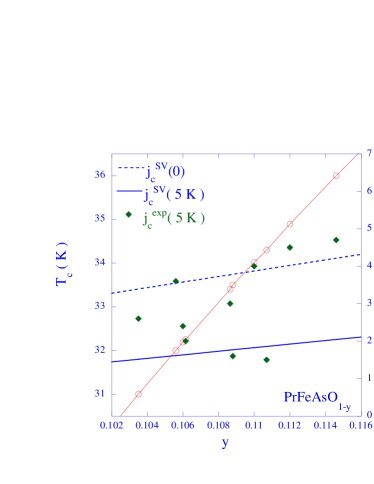
Both investigated (1111) compounds show spatial variations of both the critical temperature and the low-temperature critical current density . It is tempting to correlate the two: knowing the temperature dependence of both the superfluid density and the anisotropy ratio, as well as the evolution of the respective vs. doping phase diagramsRotundu2009 ; Chen2008 , Eq. (5) predicts what the dependence should be. In the case of PrFeAsO1-y, our measurements yield sufficient statistics for the expected increase of with to be, indeed, observed. In the considered portion of the phase diagram, the more vacancies are added, the higher , but also the stronger the pinning. Fig. 10 shows a compilation of critical temperatures and low-temperature critical currents of all investigated regions in all our PrFeAsO1-y crystals. The experimental data follow the dependence of the low temperature as this follows from Eq. (5), even though this dependence is weak. The contribution to this dependence via , arising from the addition of oxygen vacancies, is actually weaker than the expected contribution from the doping dependence of the the superfluid density, which we have assumed to follow the relation .Uemura89 ; Drew2008 Significant scatter due to the strong pinning contribution remains in Fig. 10, which we shall attribute to the presence of doping inhomogeneity on the 10 – 100 nm scale .
In the framework of weak collective pinning, the observed spatial variation of in NdFeAs0.9F0.1 would, if attributed to the macroscopic variation of the dopant atom density , correspond to a variation of the doping level of , within a given single crystal. The concomittant variation would be from 26 K to nearly 50 K, which is not what is observed by DMO. Moreover, and contrary to the observation in PrFeAsO1-y, the critical current density of the investigated crystal is larger in areas with low , both as far as different regions of crystal # 1 are concerned, as the observed differences between crystals # 1 and 2. In the absence of sufficient statistics, we tentatively ascribe this behavior to the presence of strong background pinning.
IV.3 Strong pinning background
As described in section III, the spatial variation of the critical current density in single crystalline PrFeAsO1-y is reflected in the temperature dependence of , higher local corresponding to the presence of a break in the temperature dependence. Also, the higher local critical current densities are responsible for the low-field –peak observed in Fig. 7, which cannot be explained within the single-vortex collective pinning framework. There must therefore be supplementary sources of pinning, inhomogeneously distributed throughout the samples, with a temperature dependence that is weaker than that of the weak collective pinning described above.
The field dependence of the associated critical current density, a plateau, followed by a power-law decrease , is in very satisfactory agreement with the theory of strong pinning developped in Refs. Ovchinnikov91, ; vdBeek2002, . In the presence of a density of strong pins of size larger than the coherence length, one hasvdBeek2002
| (7) | |||||
| (8) | |||||
The crossover field is determined as that above which the so-called vortex trapping area of a single pin is limited by intervortex interactions.vdBeek2002 The identification of the experimental with Eq. (7), and of the power-law decrease with Eq. (8), allows for the determination of the elementary pinning force of a strong pin from the ratio . It is found that N for both investigated compounds, with a temperature dependence coinciding with that of the superfluid density. Hence, we find a measured . The density of strong pins can be straightforwardly estimated from : m-3 for PrFeAsO1-y, and m-3 and m-3 for NdFeAsO0.9F0.1 crystals # 1 and 2, respectively.
These data can be compared to the results of TEM observations. The first candidate strong pins are extended (nm-sized) pointlike inclusions or precipitates, such as observed in Fig. 1b. Assuming such defects to be non-superconducting, one would have . Typical observed defect dimensions are – 5 nm, yielding – at low temperature. Therefore, the smaller defects of radius 2 nm might do the job, were it not that the temperature dependence expected for such voids is at odds with experiment.
Next, the observed undulations of the FeAs layers impose an intermittant bending of vortex lines as these move through the crystal lattice. The necessary force to produce this bending can be estimated as the product of the line tension and the variance of the tilt angle; here, corresponds to the buckling angle. Such a mechanism would yield the experimental temperature dependence of , but, at , grossly underestimates the measured elementary force.
Third, the higher strong pinning critical current density observed for lower doped NdFeAs(O,F) could be linked to the observation of phase coexistence in the underdoped state of this material.Drew2008 Without going as far as invoking the presence of nm-scale magnetically ordered regions in our crystals, the idea of phase coexistence suggests that there are spatial fluctuations of the dopant atom density on the scale of several nm. The ensuing dispersion of weakly superconducting regions with critical temperature inside a more strongly superconducting matrix would certainly lead to flux pinning. Its description would be similar to that of non-superconducting precipitates, but with a smaller pinning energy, a vortex passing through an area of lower gaining only a fraction of the condensation energy . Assuming the condensation energy to be proportional to the critical temperature, the pinning force can be written as
| (9) | |||||
with , and . For small spatial variations of the critical temperature, e.g. or K, and nm, Eq. (9) nicely mimics the measured temperature dependence . As shown in Figs. 6, 9, and 11(b), the total critical current density, obtained by summing Eqs. (7) [with (9) inserted] and (5),
| (10) |
is also in good agreement with experimental observations. One is thus lead to the conclusion that, in addition to the macroscopic inhomogeneity of doping level, there also exists an inhomogeneity on the nano-scale, much similar to that reported by Yamamoto et al. in Ba(Fe0.9Co0.1)2As2. However, the doping level modulation, necessarily of the order of the –variation, , that explains the strong pinning contribution, is far too small to support any claims of phase coexistence in the underdoped (1111) pnictides investigated here. If similar disorder should exist for smaller doping levels, near the superconductivity onset, one would have , and a near certain coexistance of magnetic and superconducting regions. This is a premise that needs further investigation.
For completeness, one may also contemplate surface roughness as a source of flux pinning.Mathieu88 ; Simon95 ; Lazard2002 The critical current density is then determined by the force needed to push a vortex line out of a surface trough or across a ridge, and reads, in the limit of small magnetic fieldsvdBeek2002 ; Flippen95
| (11) |
Here, would be the crystal thickness, the spacing between surface defects or troughs, and the typical ridge height, that is, the variance of the thickness. In Refs. Mathieu88, ; Simon95, ; Lazard2002, , the ratio is interpreted as the sine of a “contact angle” . In the Mathieu-Simon modelMathieu88 ; Simon95 ; Lazard2002 the field dependence is expected to correspond to that of the vortex chemical potential, i.e. the equilibrium magnetization. This is not observed. Moreover, if one reinterprets the experimental and in terms of surface pinning, one finds a ratio of ridge height to ledge width , for a ledge separation of nm. Such a high aspect ratio would mean that the surface defects are located on the crystal edge, since the alternative, cracks on the surface, are not observed. Strong pinning by impurities, located in surface regions only, leads to the same dependences (7,8), but with defects .
IV.4 Fishtail effect and phase diagram
The knowledge of pinning parameters of the (1111) superconductors under study allows one to confront features of the mixed-state -phase diagram with theoretical models. In particular, the fishtail effect at was attributed to a crossover in vortex dynamics as, with increasing magnetic field, one leaves the single vortex pinning regime for the bundle pinning regime,KrusinElbaum92 ; Civale94 or the occurence of a first order phase transition from an ordered, “elastically pinned” low-field vortex phase, the so-called Bragg-glass,Giamarchi97 to a high field disordered phase characterized by the presence of topological defects.Kierfeld2000 ; Mikitik2001 The latter scenario has been unambiguously verified in the high temperature superconductors YBa2Cu3O7-δ and Bi2Sr2CaCu2O8+δ,Kokkaliaris99 ; Rassau99 ; vdBeek2000ii , in the cubic superconductor (Ba,K)BiO3,Klein2001 in NbSe2,Paltiel as well as in MgB2.Klein2010
In the first case, the onset field should coincide with the single-vortex- to bundle pinning crossover field , determined by the equality of [see Eq. (3)] and the vortex spacing :
| (12) |
Inserting the experimentally obtained into Eq. (12) yields the dotted lines in Fig. 12. Clearly, while the experimental data for more strongly pinning PrFeAsO1-y lie below those for more weakly pinning NdFeAsO0.9F0.1, Eq. 12 predicts otherwise. Therefore, even if the peak effect onset lies in the vicinity of the single-vortex to bundle pinning crossover, it cannot be directly associated with it.
On the other hand, the vortex ensemble can undergo a structural transition whereby it lowers its energy by adapting itself more efficiently to the underlying pinning potentiel, at the expense of the generation of topological defects.Giamarchi97 ; Kierfeld2000 ; Mikitik2001 In the absence of a theory for this order-disorder transition of the vortex lattice, a Lindemann-like criterion was developped in Refs. Ertas94, ; Giamarchi97, and Vinokur98, in order to, at least, estimate its position in the –plane. The Lindemann approach considers that topological defects can be generated when pinning is sufficiently strong to provoke the wandering of vortex lines outside their confining cage formed by the nearest neighbor flux lines. The different results Ertas94 ; Vinokur98 have been summarized in Ref. Mikitik2001, . In the regime of single vortex pinning, relevant for collective pinning in the (1111) compounds, the position of the order-disorder transition is given by
| (13) |
where , , is the Lindeman number, is a numerical constant, , and . The use of the parameters of Table 1, the experimentally measured , and yields the dashed lines in Fig. 12. These show more than satisfactory agreement with the experimentally measured positions of . We therefore conclude that, most likely, a bulk order-disorder transition of the vortex lattice lies at the origin of the peak effect in (1111) pnictide superconductors. However, more work, especially on vortex dynamics and possible hysteresis associated with the transition, should be performed to ascertain this.
V Conclusion
It is found that superconducting iron pnictide single crystals show significant spatial variations of both the critical temperature and the critical current density . Variations of these quantities on the macroscopic scale, from several to several hundred m, are at the origin of a smearing of globally measured properties, and notably of the width of the superconducting transition. This implies the necessity of local measurements, such as magneto-optical imaging or Hall-probe magnetometry, to extract superconducting parameters. From such local measurements, it is found that the critical current in iron oxypnictide superconductors of the (1111) family of compounds arises from two distinct contributions. The first is weak collective pinning by dopant atoms or vacancies, vortex lines being pinned by the small scale fluctuations of the local dopant atom density. The pinning mechanisme is identified as being due to mean-free path variations in the vortex core ( mechanism). This means that dopant atoms should also be effective quasi-particle scatterers. The second pinning contribution manifests itself at low fields. The corresponding critical current contribution can be completely parametrized by the strong pinning theory developped in Refs. Ovchinnikov91, ; vdBeek2002, , which means that extended defects are at its origin. An analysis of the magnitude and field-dependence of this strong pinning contribution shows that spatial variations of the doping level on the scale of several dozen to one hundred nm may be at stake. These variations do not support the possible coexistence of the anti-ferromagnetic metallic and the superconducitng phases. Finally, we contend that a bulk order-disorder transition of the vortex ensemble is at the origin of the “fishtail” or peak effect observed in the critical current in sub-T fields.
Acknowledgements
We wish to acknowledge V. Mosser for providing the Hall sensor arrays. This work was supported by KAKENHI from JSPS, and by Grant-in-Aid for the Global COE program “The Next Generation of Physics, Spun from Universality and Emergence” from MEXT, Japan. R.O. was supported by the JSPS Research Foundation for Young Scientists. Work at the Ames Laboratory was supported by the Department of Energy, Basic Energy Sciences under Contract No. DE-AC02-07CH11358.
References
- (1) Y. Kamihara, H. Hiramatsu, M. Hirano, R. Kawamura, H. Yanagi, T. Kamiya, H. Hosono, J. Am. Chem. Soc 128, 10012 (2006).
- (2) Y. Kamihara, T. Watanabe, M. Hirano, H. Hosono, J. Am. Chem. Soc. 130, 3296 (2008).
- (3) Hiroki Takahashi, Kazumi Igawa, Kazunobu Arii, Yoichi Kamihara, Masahiro Hirano2, and Hideo Hosono, Nature 453, 376.
- (4) G.F. Chen, Z. Li, D. Wu, G. Li, W.Z. Hu, J. Dong, P. Zheng, J.L. Luo, and N.L. Wang, Phys. Rev. Lett. 100, 247002 (2008).
- (5) Z.-A. Ren, J. Yang, W. Lu, W. Yi, G.-C. Che, X.L. Dong, L.-L. Sung, and Z.-X. Chao, Mater. Res. Innovations 12, 105 (2008)
- (6) Ren Zhi-An, Lu Wei, Yang Jie, Yi Wei, Shen Xiao-Li1, Zheng-Cai, Che Guang-Can, Dong Xiao-Li, Sun Li-Ling, Zhou Fang, and Zhao Zhong-Xian,Chinese Phys. Lett. 25 2215-2216 ( 2008 )
- (7) Hijiri Kito, Hiroshi Eisaki, and Akira Iyo, J. Phys. Soc. Jpn., 77, 063707 (2008).
- (8) M. Rotter, M. Tegel, and D. Johrendt, Phys. Rev. Lett. 101 107006 (2008).
- (9) A.J. Drew, F.L. Pratt, T. Lancaster, S.J. Blundell, P.J. Baker, R.H. Liu, G. Wu, X.H. Chen, I. Watanabe, V.K. Malik, A. Dubroka, K.W. Kim, M. Rössle, and C. Bernhard, Phys. Rev. Lett. 101, 097010 (2008).
- (10) D. Kubota, T. Ishida, M. Ishikado, S. Shamoto, H. Eisaki, H. Kito, A. Iyo, arXiv:0810.5623v1.
- (11) R. Prozorov, N. Ni, M.A. Tanatar, V.G. Kogan, R.T. Gordon, C. Martin, E.C. Blomberg, P. Prommapan, J.Q. Yan, S.L. Bud’ko, and P.C. Canfield, Phys. Rev. B 78, 224506 (2008).
- (12) R. Prozorov, M.A. Tanatar, E.C. Blomberg, P. Prommapan, R.T. Gordon, N. Ni, S.L. Bud’ko, and P.C. Canfield, Physica C 469, 667 (2009).
- (13) G. Blatter, M.V. Feigel’man, V.B. Geshkenbein, A.I. Larkin, and V.M.Vinokur, Rev. Mod. Phys. 66, 1125 (1994).
- (14) Bing Shen, Peng Cheng, Zhaosheng Wang, Lei Fang, Cong Ren, Lei Shan, and Hai-Hu Wen, Phys. Rev. B 81, 014503 (2010).
- (15) R. Prozorov, M. A. Tanatar, N. Ni, A. Kreyssig, S. Nandi, S. L. Bud ko, A. I. Goldman, and P. C. Canfield, Phys. Rev. B 80, 174517 (2009).
- (16) A. Yamamoto, J. Jaroszynski, C. Tarantini, L. Balicas, J. Jiang, A. Gurevich, D.C. Larbalestier, R. Jin, A.S. Sefat, M.A. McGuire, B.C. Sales, D.K. Christen, and D. Mandrus, Appl. Phys. Lett. 94, 062511 (2009).
- (17) S. Kokkaliaris, P.A.J. de Groot, S.N. Gordeev, A.A. Zhukov, R. Gagnon, and L. Taillefer, Phys. Rev. Lett. 82, 5116 (1999).
- (18) A.P. Rassau, S.N. Gordeev, P.A.J. de Groot, R. Gagnon, and L. Taillefer, Physica C 328, 14 (1999).
- (19) C.J. van der Beek, S. Colson, M.V. Indenbom, and M. Konczykowski, Phys. Rev. Lett. 84, 4196 (2000).
- (20) S. Bhattacharya and M.J. Higgins, Phys. Rev. Lett. 70, 2617 (1993); Y. Paltiel, E. Zeldov, Y.N. Myasoedov, H. Shtrikman, S.Bhattacharya, M.J. Higgins, Z.L. Xiao, E.Y. Andrei, P.L. Gammel, and D.J. Bishop, Nature (London) 403, 398 (2000).
- (21) T.Klein, R.Marlaud, C.Marcenat, H.Cercellier, M.Konczykowski, C.J. van der Beek, V.Mosser, H.S.Lee, and S.I.Lee, submitted to Phys. Rev. Lett. (2009).
- (22) Huan Yang, Huiqian Luo, Zhaosheng Wang, and Hai-Hu Wen, Appl. Phys. Lett. 93, 142506 (2008).
- (23) Huan Yang, Cong Ren, Lei Shan, and Hai-Hu Wen, Phys. Rev. B 78, 092504 (2008).
- (24) R. Prozorov, M. E. Tillman, E. D. Mun, P.C. Canfield, New Journal of Physics 11, 035004 (2009).
- (25) X.L. Wang, S.R. Ghorbani, S.X. Dou, X.L. Shen, W. Yi, Z.C. Li, and Z.A. Ren, arXiv:0806.1318v1.
- (26) M. Ishikado, S. Shamoto, H. Kito, A. Iyo, H. Eisaki, T. Ito, and Y. Tomioka, Physica C 469, 901 (2009).
- (27) R. Okazaki, M. Konczykowski, C.J. van der Beek, T. Kato, K. Hashimoto, M. Shimozawa, H. Shishido, M. Yamashita, M. Ishikado, H. Kito, A. Iyo, H. Eisaki, S. Shamoto, T. Shibauchi, and Y. Matsuda, Phys. Rev. B 79, 064520 (2009).
- (28) K. Hashimoto, T. Shibauchi, T. Kato, K. Ikada, R. Okazaki, H. Shishido, M. Ishikado, H. Kito, A. Iyo, H. Eisaki, S. Shamoto, and Y. Matsuda, Phys. Rev. Lett. 102, 017002 (2009).
- (29) J. Kacmarcik, C. Marcenat, T. Klein, Z. Pribulova, C.J. van der Beek, M. Konczykowski, S.L. Budko, M. Tillman, N. Ni, and P.C. Canfield, Phys. Rev. B 80, 014515 (2009).
- (30) Z. Pribulova, T. Klein, J. Kacmarcik, C. Marcenat, M. Konczykowski, S. L. Bud’ko, M. Tillman, and P. C. Canfield, Phys. Rev. B 79, 020508(R) (2009).
- (31) L.A. Dorosinskiĭ, M.V.Indenbom, V.I. Nikitenko, Yu.A. Ossip’yan, A.A. Polyanskii, and V.K. Vlasko-Vlasov, Physica C 203, 149 (1992).
- (32) A. Soibel, E. Zeldov, M.L. Rappaport, Y. Myasoedov, T. Tamegai, S. Ooi, M. Konczykowski, and V. Geshkenbein, Nature 406, 282 (2000).
- (33) E.H. Brandt, Phys. Rev. B 54, 4246 (1996).
- (34) T. Shibauchi, M. Konczykowski, C.J. van der Beek, R. Okazaki, Y. Matsuda, J. Yamaura, Y. Nagao, and Z. Hiroi, Phys. Rev. Lett. 99, 257001 (2007).
- (35) C.P. Bean, Phys. Rev. Lett. 8, 250 (1962)
- (36) E.H. Brandt, M.V. Indenbom and A. Forkl, Europhys.Lett. 22, 735 (1993).
- (37) E. Zeldov, J.R. Clem, M. McElfresh, and M. Darwin, Phys. Rev. B 49, 9802 (1994).
- (38) C.J. van der Beek, M. Konczykowski, V.M. Vinokur, G.W. Crabtree, T.W. Li, and P.H. Kes, Phys. Rev. B 51, 15492 (1995).
- (39) A.I. Larkin and Yu. N. Ovchinnikov, J. Low Temp. Phys. 21, 409 (1979).
- (40) G. Blatter et V.B. Geshkenbein, Vortex Matter , in “Superconductivity. Conventional and Unconventional Superconductors Vol. 1”, pp 495-625, Ed. K. Bennemann et J.B. Ketterson, Springer, Berlin (2008).
- (41) E. H. Brandt, Phys. Rev. Lett. 57, 1347 (1986).
- (42) E.V. Thuneberg, J. Kürkijärvi, and D. Rainer, Phys. Rev. Lett. 48, 1853 (1982); Phys. Rev. B 29, 3913 (1984).
- (43) C.J. van der Beek, M. Konczykowski, A. Abal’oshev, I. Abal’osheva, P. Gierlowski, S.J. Lewandowski, M.V. Indenbom, S. Barbanera, Phys. Rev. B 66, 024523 (2002).
- (44) The different temperature dependences arise from the different temperature dependence of in the two compounds; Whereas increases with temperature in PrFeAsO1-y it is nearly temperature independent in NdFeAs0.9F0.1.
- (45) C.R. Rotundu, D.T. Keane, B. Freelon, S.D. Wilson, A. Kim, P.N. Valdivia, E. Bourret-Courchesne, and R.J. Birgeneau, arXiv:0907:1308v1.
- (46) G. F. Chen, Z. Li, D. Wu, J. Dong, G. Li, W. Z. Hu, P. Zheng, J. L. Luo, and N. L. Wang, Chin. Phys. Lett. 25, 2235 (2008) .
- (47) Y.J. Uemura, G.M. Luke, B.J. Sternlieb, J.H. Brewer, J.F. Carolan, W.N. Hardy, R. Kadono, J.R. Kempton, R.F. Kiefl, S.R. Kreitzman, P. Mulhern, T.M. Riseman, D.L. Williams, B.X. Yang, S. Uchida, H. Takagi, J. Gopalakrishnan, A.W. Sleight, M.A. Subramanian, C.L. Chien, M.Z. Cieplak, G. Xiao, V.Y. Lee, B.W. Statt, C.E. Stronach, W.J. Kossler, X.H. Yu, Phys. Rev. Lett. 62, 2317 (1989).
- (48) Yu. N. Ovchinnikov and B.I. Ivlev, Phys. Rev. B 43, 8024 (1991).
- (49) P. Mathieu and Y. Simon, Europhys. Lett. 5, 67 (1988).
- (50) Y. Simon, B. Plaçais, and P. Mathieu, Phys. Rev. B 50, 3503 (1994).
- (51) G. Lazard, P. Mathieu, B. Plaçais, J. Mosqueira, Y. Simon, C. Guilpin and G. Vaquier, Phys. Rev. B 65, 064518 (2002).
- (52) R.B. Flippen, T.R. Askew, J.A. Fendrich, and C.J. van der Beek, Phys. Rev. B 52, R9882 (1995).
- (53) L. Krusin-Elbaum, L. Civale, V.M. Vinokur, F. Holtzberg, Phys. Rev. Lett. 69, 2280 (1992).
- (54) L. Civale, L. Krusin-Elbaum, J.R. Thompson, and F. Holtzberg, Phys. Rev. B 50, 7188 (1994).
- (55) T. Giamarchi and P. Le Doussal, Phys. Rev. B 55, 6577 (1997).
- (56) J. Kierfeld and V.M. Vinokur, Phys. Rev. 61, R14928 (2000); ibid. 69, 024501 (2004).
- (57) G.P. Mikitik and E.H. Brandt, Phys. Rev. B 64, 184514 (2001); ibid Phys. Rev. B, 68, 054509 (2003); ibid Phys. Rev. B, 71, 012510 (2005).
- (58) T. Klein, I. Joumard, S. Blanchard, J. Marcus, R. Cubitt, T. Giamarchi, P. Le Doussal, Nature (London) 413, 404 (2001).
- (59) D. Ertaş and D.R. Nelson, Physica C 272 , 79 (1996).
- (60) V.M. Vinokur, B. Khaykovich, E. Zeldov, M. Konczykowski, R.A. Doyle, and P.H. Kes, Physica C 295, 209 (1998).