The rest-frame ultraviolet spectra of GRBs from massive rapidly-rotating stellar progenitors
Abstract
The properties of a massive star prior to its final explosion are imprinted in the circumstellar medium (CSM) created by its wind and termination shock. We perform a detailed, comprehensive calculation of the time-variable and angle-dependent transmission spectra of an average-luminosity Gamma-Ray Burst (GRB) which explodes in the CSM structure produced by the collapse of a 20 , rapidly rotating, progenitor star. We study both the case in which metals are initially in the gaseous phase, as well as the situation in which they are heavily depleted into dust. We find that high-velocity lines from low-ionization states of silicon, carbon, and iron are initially present in the spectrum only if the metals are heavily depleted into dust prior to the GRB explosion. However, such lines disappear on timescales of a fraction of a second for a burst observed on-axis, and of a few seconds for a burst seen at high-latitude, making their observation virtually impossible. Rest-frame lines produced in the termination shock are instead clearly visible in all conditions. We conclude that time-resolved, early-time spectroscopy is not a promising way in which the properties of the GRB progenitor wind can be routinely studied. Previous detections of high velocity features in GRB UV spectra must have been due either due to a superposition of a physically unrelated absorber or to a progenitor star with very unusual properties.
1 Introduction
For a few hours after their onset, the afterglows of Gamma-Ray Bursts (GRBs) are the brightest sources in the far Universe. Their high luminosity, together with their powerlaw, featureless spectrum, make them ideal sources to probe their surrounding environment through the absorption lines imprinted in their spectra.
Theoretical studies have suggested that long Gamma Ray Bursts (GRBs) are produced by the collapse of rapidly-rotating, chemically homogeneous, massive stars (e.g. Macfadyen & Woosley 1999). The association between GRBs and massive stars, which has been observationally supported (Stanek et al., 2003; Hjorth et. al, 2003), makes absorption studies potentially useful as a new way to probe star-forming regions at intermediate and high redshifts, and/or the last hundreds of years of the progenitor evolution. Absorption lines imprinted by the material ejected by the star prior to its explosion allow one to probe the velocity structure and metal content of the ejecta. High-resolution spectroscopy of GRB afterglows has been performed in a number of cases (e.g. Möller et al. (2002); Matheson et al. (2003); Mirabal et al. (2003); Schaefer et al. (2003); Starling et al. (2005); Fiore et al. (2005); D’Elia et al. (2009); Chen et al. (2008); Prochanska et al. (2008a), (2008b); Fox et al. (2008); Thoene et al. (2008); see also Whalen et al. 2008 for an extended discussion on absorbers in GRBs), yielding constraints on the nature of the absorbing medium. An especially well studied burst was GRB 021004, whose high-resolution spectroscopy revealed a complex velocity structure of the absorbing material, with velocities up to km/s. The interpretation of these features has been controversial. Initial studies claimed that the high velocity lines were a direct proof of the association of GRBs with WR stars. Starling et al. (2005) argued that the lines must be produced in a fossil stellar wind with hydrogen enrichment from a companion. Mirabal et al. (2003) and Schaefer et al. (2003) interpreted the lines as the result of shells of material which are present around the progenitor.
More recent studies have however cast doubts on the initial interpretation. Lazzati et al. (2006) performed a detailed time dependent analysis, taking into account the burst flash ionization. Even though they still considered the wind of the WR progenitor star as the best absorber candidate, they pointed out that such an interpretation would require a termination shock at a distance of at least 100 pc. Such a large radius of the termination shock is somewhat at odds with current wind models and could be accounted for only if the progenitor were an extremely massive star evolving in a fairly low-density environment. Chen et al. (2007) studied a sample of 5 GRBs with high velocity features (among which GRB 021004). Using fine-structure transitions and the presence of low-ionization species, they argued that the location of the absorber is very likely at a large distance from the burster ( kpc), favoring an intervening halo, physically unrelated to the GRB, as the location of the absorbing material. Similarly, Vreeswijk et al. (2007) modeled fine structure lines present in the spectrum of GRB 060418 with a UV pumping model and concluded that the absorbers are at a distance of 1.7 2 kpc. These results are consistent with a GRB completely ionizing the local CSM, and with high-velocity absorbers elsewhere in the host galaxy or intervening intergalactic space (see also Prochanska et al. (2008a,b) and D’Elia et al. (2009a) for similar findings in the case of other GRBs they studied).
Most of these studies do not take into account the possible shielding effects of an unusually dense CSM, as well as any effects due to dust. Additionally, when photoionization calculations are performed, most assume a steady state solution, whereas the radiation fields of GRBs are highly temporally variable, with initial burst timescales of a few to tens of seconds, and the afterglow varying over minutes to hours. Disentangling the physical origin of the spectral absorption features seen in GRB afterglows is clearly of great importance for a full understanding of the GRB phenomenon.
The aim of this paper is a detailed, systematic study of the time-dependent transmittance spectrum of a GRB exploding in a dusty circumburst medium (CSM) shaped by its progenitor star. Recent studies have suggested that long GRBs are produced by the collapse of rapidly-rotating, chemically homogeneous, massive stars (Yoon & Langer, 2005; Woosley & Heger, 2006; Yoon et al., 2006; Cantiello et al., 2007). This kind of evolution is believed to take place at low metallicity, where stellar winds are weak and angular momentum loss by winds is marginal. The wind of numerous types of GRB and SN progenitors has been simulated by van Marle et al. (2008), including one model which recreates an anisotropic wind close to the star. This theoretical scenario has found support in recent observations. Campana et al. (2008) performed a detailed study of the X-ray spectrum of GRB 060218, discovering a larger than normal N/O ratio in the surrounding of the burst progenitor. They concluded that only a progenitor star characterized by a fast stellar rotation and sub-solar initial metallicity could produce such a metal enrichment.
In this paper we perform a detailed and comprehensive study of the effects of the GRB and afterglow radiation on the CSM structure produced by the stellar wind of a rapidly-rotating, low-metallicity, massive progenitor star (van Marle et al., 2008). We aim at predicting the time-variable, angle-of-sight dependent transmittance spectra of a GRB afterglow which resulted from the collapse of such a star. We study two cases, that of a CSM whose metals are initially in the gaseous phase (i.e. no dust), and that of a CSM whose metals are heavily depleted into dust prior to the GRB explosion. Even though the formation and survival of dust in the wind of Wolf-Rayet stars may seem surprising, dust is observed in WR winds (Allen et al., 1972; Williams et al., 1990). The gas temperature and the exposure to the star’s UV radiation make the wind a very harsh environment for dust particles. If the dust were to share the temperature of the gas phase, the grains would quickly sublimate. One key ingredient that allows the dust to survive is its capability of radiatively cooling to temperatures lower than the gas in which it is embedded (e.g. (Lazzati, 2008)). Even so, there are still many unknown riddles in the way in which dust particles are born and survive in WR winds, but their presence has been clearly detected (e.g. Crowther 2003).
Although it is presently unknown whether the particular stellar evolution model that we consider here is truly representative of critically rotating stars in general, we believe that the ability to compare theoretical absorption features with observational data can be potentially useful to the study of both GRBs and massive star evolution.
2 The CSM of the Progenitor Star and Spectra Calculations
2.1 The CSM of the Progenitor Star
Van Marle et al. (2008) computed the evolution of the circumstellar density profile around a rapidly rotating, , low metallicity star () star, which is considered representative of a typical GRB progenitor. Due to the anisotropy associated with the rotation of the star, the calculation yielded density profiles which are dependent on the angle between the rotation axis (presumably coinciding with the GRB jet axis), and the line of sight.
We choose 3 different radial profiles to show the angular and radial dependence in detail, at , , and degrees. The calculations of van Marle et al. (2008) provide the density, the radial and tangential velocity and , the ionization state of hydrogen, and the internal energy as a function of radius and angle . The internal energy is used to compute the initial temperature as a function of radius by means of the ideal gas equation of state with the polytropic index . The initial ionization state of elements heavier than hydrogen is computed using the photoionization code of Perna & Lazzati (2002), assuming photoionization equilibrium under the blackbody radiation field from a star with a characteristic temperature of K and a luminosity of , which correspond to the properties of the star at the end of its life as given by van Marle et al. (2008).
The density profile is assumed constant in time throughout the calculation, which is reasonable since the hydrodynamical timescales are much longer than the ionization timescales. For the same reason, the radial velocities of the gas are assumed constant in time as well.
For the metal content of the CSM, we use the metallicity history of the stellar photosphere as calculated by Yoon et al. (2006). This, combined with the radial velocity information, is used to compute a radially-dependent metallicity profile. The outer shell, with near-zero radial velocity, has the initial metallicity (75% H 25% He with trace elements), while the inner region, dominated by the stellar wind, is very helium enriched. The helium enrichment is due to the rapid rotation of the star; it causes the star to evolve homogeneously because of mixing, so that at the end of the star’s life nearly all of the hydrogen has burned into helium.
For the species that are not included in the calculations of Yoon et al. (2006) (Sulfur, Argon, Calcium, and Nickel), we assumed a metallicity of with the relative weights of the species as in the solar case (Anders & Grevesse, 1989), for both regions of the CSM. The abundance values we used for all 12 species are given in Table 1. The HI column density is about cm-2.
| Element | Outer Shell Abundances | Inner Region Abundances |
| He | 10.90 | 13.84 |
| C | 7.28 | 8.64 |
| N | 6.68 | 10.33 |
| O | 7.61 | 8.62 |
| Ne | 6.75 | 8.92 |
| Mg | 6.17 | 8.47 |
| Si | 6.20 | 8.52 |
| S | 5.9 | 5.9 |
| Ar | 5.6 | 5.6 |
| Ca | 5.0 | 5.0 |
| Fe | 6.19 | 8.51 |
| Ni | 5.0 | 5.0 |
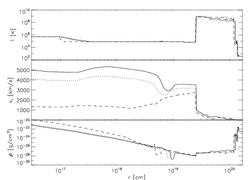
The velocity, density and temperature profiles produced by the simulations above are displayed in Fig.1 for the three lines of sight under consideration. Full 2D plots of the velocity, density, and temperature are shown for completeness in Fig.2, 3, and 4. These figures display the physical conditions of the CSM just as the star is about to explode.
An component which is not included in these models is dust. As a matter of fact, while it is known that dust is produced by stars, there is very little information on the precise radial distribution, grain-size distribution and composition of the dust grains in the close CSM of the star. Therefore, in our study we consider two limiting situations, one in which there is no dust (all the metals are in the gaseous phase to start with), and one in which the metals are heavily depleted into dust at all radii. In this case, we take a dust population similar to that of the Milky Way, consisting of graphite and silicate grains with a power-law distribution in size with slope -3.5, and a range of sizes between .005 m and .25 m. Since the metallicity of the CSM is radially dependent, we determine at each radius the dust-to-gas ratio by assuming that 90% of the least abundant element among the ones making up the grains (C, Mg, O, Si, Fe) is depleted into dust. We point out that the precise details of the initial dust distribution are not very important for our results, since the dust grains close to the GRB location are quickly destroyed by the intense radiation from the burst. Similarly, any uncertainty in the destruction rates by a factor of a few would not affect sensibly our results, since recycling is extremely fast with respect to photoionization. However, there is a fundamental difference between an initial condition with no dust and an initial condition with dust. In the former, low-ionization species such as CII, FeII, SiII are photoionized by the strong radiation field of the progenitor star in its close CSM, where the high-velocity, free-streaming wind resides. Therefore, high-velocity lines from these elements are never visible. In the latter case, these elements are initially shielded within the dust grains. Then, when the star explodes and the prompt GRB and afterglow radiation impinge on the grains, those depleted elements are recycled into the medium, and they are visible for a period of time until they get photoionized. Thanks to the use of the code by Perna & Lazzati (2002), we are able to model self-consistently the destruction of the dust grains, their redistribution into the CSM, and their subsequent photoionization. When there is dust, high-velocity lines from low-ionization species become visible111We need to point out that the results we display in the following would change qualitatively if the dust composition were radically different from the MW distribution assumed here. For example, if the grains, instead of being composed of Fe, Mg, Si, O and C (as in the MW dust distribution), were made up of other elements, then lines from those elements would be seen coming from the wind.


We thus have all the initial conditions of the medium at the time at which the star explodes and produces a GRB: temperature, density, radial velocity, metallicity and dust as a function of radius and polar angle. These conditions provide the starting point for the computation of the time-dependent transmittance spectra expected during the GRB afterglow phase.
2.2 Numerical Setup and Radiative Transfer
We divided each line of sight (the three chosen values of ) into 1909 radial bins, matching the resolution of the data generated by van Marle et al. (2008). In the time coordinate, we chose logarithmically spaced time steps starting at seconds and ending at a time of 3 days. It’s worth noting that time is defined as when the first photons reach the observer. Thus, observational effects like superluminal velocities of ionization fronts are apparent, not actual. Ionization profiles are, instead, in the rest frame of the burst. Complete ionization profiles (necessary for generating the spectra) were therefore extracted as a function of time.
The simulation of time-dependent photoionization and radiation transfer was performed using the code by Perna & Lazzati (2002) (see also Perna et al. (2003); Lazzati & Perna (2003)). This code keeps track of the 13 most abundant elements (H, He, C, N, O, Ne, Mg, Si, S, Ar, Ca, Fe, Ni) and computes their ionization state as a function of time. The continuum opacity is also part of the computation, while the opacity due to resonant lines is calculated separately (see §2.4). The radiative transfer is performed in the spectral range.
We note that, once the ions from the sublimated grains return to the gaseous phase, they are given the temperature of the gas at that location. This is likely to be inaccurate, but unfortunately, at this stage it is not possible to implement a more accurate prescription in our code for both a technical and a theoretical limitation. Technically, once the ions are ejected from the dust, they are not distinguishable (in the code) from the gas ions. The code does not allow for two components of the same ion at different temperatures. Furthermore, even if the code were to include this possibility, there is not a single dust temperature. The temperature of the sublimating dust grains depends on the grain size and on the distance to the burst. Therefore one would need to consider a continuum of temperatures and the problem would become numerically untreatable. Finally, there is a theoretical uncertainty in what is the distribution of the ejected ion energies. One possibility is that the ions are ejected with a thermal energy distribution corresponding to the temperature of the dust. The issue with this procedure is that the ejected particles have to overcome a potential barrier (the binding energy to the grain) to leave the dust grain, and there is no clear recipe on how to compute the ejected particle energy distribution. For big grains, it is likely to be an exponential tail (and therefore non-thermal), but for small grains quantum effects are important. We consider a detailed implementation of all these effects, albeit interesting, beyond the scope of this paper.
2.3 The Light Curve of the GRB and its Afterglow
The light curve of the GRB and its afterglow was modeled with the sum of two separate components: a prompt emission component and an afterglow component. The models we adopted are described in this section. For each, we let our light curve take the form:
| (1) |
where is an appropriate normalization constant, contains the time dependence of the radiation, is the flux at a given frequency , and represents the half opening angle of the jet core within the context of a structured jet (Rossi et al., 2002; Zhang & Mészáros, 2002). This is observed to vary from less than 1∘ to as much as 15∘ (Panaitescu 2007; Liang et al. 2008) and is taken here to be . Note that the angular dependence of the luminosity does play a significant role in the ionization timescale of the various elements at different polar angles.
Both the spectral function and the time function are normalized so that the integrals over frequency and time, respectively, are equal to 1, making the normalization of the luminosity entirely contained within the constant . Additionally, we note that
| (2) |
where is the effective isotropic luminosity for the line of sight we are interested in, an important input onto the radiative transfer code.
2.3.1 The Prompt Emission
For the GRB prompt emission, we choose a simple Gaussian function with a FWHM of 10 seconds and a peak emission at 10 seconds (Kouveliotou et al., 1993):
| (3) |
The value of the constant is determined so that the Gaussian is normalized to 1 in the interval .
We use the broken power law form given by Band et al. (1993) for the frequency dependent component of the prompt emission:
| (4) |
where is in units of keV, is the knee of the power law, taken to be 300 keV, and are the slopes of the power law for and , respectively, and is a normalization constant. In our model, and . Using these values makes the integral easy to solve analytically:
yielding the normalization constant .
Thus the model for the prompt emission is
| (5) |
where is the total isotropic energy output along the line of sight determined by . It is related to through .
2.3.2 Afterglow Model
The time component of the afterglow emission is modeled as a smoothly broken power law
| (6) |
with and a fitting constant, picked so that at peak emission The powerlaw break is at s. We analytically find the peak time to be s, and our fitting constant was determined to be .
To normalize the frequency dependent component we use the observation that for a z = 1 GRB. (van Paradijs et al., 2000). To fit this, we used the R-Band Bessel filter zero point: at a flux density of 3080 Jy at Hz. This gives an flux density of .00308 Jy at the same frequency. Using a luminosity distance Mpc (for a cosmology with , and km/s/Mpc), we find a specific luminosity erg/s/Hz. Since , then with the typical value of (corresponding to an index of the electron distribution). This readily yields . Thus, the spectral component is
| (7) |
giving the following model for the afterglow component
| (8) |
with and defined as we just discussed. This corresponds to a total effective isotropic energy output across the range 1 eV to 10 keV of about ergs, about of the prompt emission.
2.4 Computation of the Transmittance
During the radiative transfer calculation, we keep track of the time-dependent density of each ion present in each radial bin, hence obtaining the evolving ionization profile as a function of radius for each ion of interest. We track the following ions: HI, HeI, HeII, CII, CIII, CIV, SiII, SiIV, MgI, MgII, FeII, and OII. This, combined with our radial velocity and temperature profile, is sufficient to generate a time-dependent transmittance, which we compute at infinite instrument resolution.
To calculate the transmittance, we compute the Voigt line profile function for each individual line,
| (9) |
where is the Voigt function:
| (10) |
with and . Here is the Doppler width and is the transition rate, which is approximated by , the spontaneous decay rate (Rybicki & Lightman, 1979). The cross section for a given line is
| (11) |
from which we can calculate the optical depth . The transmittance is thus
| (12) |
where is its value before being affected by the opacity of the given line.
The transmittance was calculated at each radial bin taking into account 21 resonant transitions from the above mentioned ions; thanks to the inclusion of the Doppler effect, any structure present in the velocity profiles is correspondingly reflected in the simulated spectra. We limited ourselves to 21 resonant transitions since this was the most computationally expensive part of our study. The lines were selected based on observed GRB spectra (Fiore et al., 2005) rest wavelength, and oscillator strength . The lines present in our calculations are listed in Table 2. The reported values were calculated from the Einstein A coefficients given by Ralchenko et al. (2008). It is worth noting that we only treat lines that arise from resonant transitions in the ground state of each ion, although fine-line transitions are commonly observed in GRB afterglow spectra (Vreeswick et al. 2003, 2007; Prochanska et al. 2006; D’Elia et al. 2009a,b). At present time, there is no time-dependent, radiative transfer code that treats self-consistently transitions from both the ground and the excited levels, as well as the time-dependent evolution of the dust grains. However, we estimated the effect of our approximation by using a time-dependent code (van Adelsberg et al. in prep.) which computes the evolution of the excited states of the ions under the influence of a time-variable radiation field. By running this code with the luminosity function in §2.3 and viewing angle , we found that, for ions such as SiII and FeII, in the innermost region of the wind ( pc) the ground level depopulates to about 20% on a timescale of several seconds, while in the outermost regions of the wind ( pc), it depopulates to about 30% on a timescale of several hundred seconds. The depopulation timescales become longer at larger viewing angles. Therefore, given the timescales over which the transient high-velocity features live (§3), the correction to the strength of the ground-level resonant lines due to the depopulation of the ground level is not expected to be significant. In the case of CIV, we found the population of the excited levels to be negligible across the full extent of the wind.
| Ion | Ion | ||||
|---|---|---|---|---|---|
| HI | 1215.67 | 0.278 | CII | 903.962 | 0.336 |
| CII | 1334.53 | 0.127 | CIII | 977.03 | 0.759 |
| CIV | 1548.20 | .190 | CIV | 1550.77 | 0.0952 |
| MgI | 2852.50 | 1.80 | MgII | 2796.35 | 0.566 |
| MgII | 2803.53 | 0.303 | SiII | 1190.42 | 0.139 |
| SiII | 1193.29 | 0.574 | SiII | 1260.42 | 1.224 |
| SiII | 1304.37 | 0.0928 | SiII | 1808.01 | 0.00248 |
| SiIII | 1206.50 | 1.67 | SiIV | 1393.76 | 0.512 |
| FeII | 2344.21 | 0.11 | FeII | 2374.46 | 0.028 |
| FeII | 2382.77 | 0.38 | FeII | 2586.65 | 0.065 |
| FeII | 2600.17 | 0.22 |
3 Results
Our calculations were performed both for a non-dusty CSM and for a dusty CSM. In the non-dusty case, most of the inner region is completely or near-completely ionized before the burst occurs due to the ionizing photons from the progenitor star, vastly reducing the signatures of the high-velocity wind close to the star. These features, that is high-velocity lines from low-ionization elements, are instead visible in the case in which metals are initially locked into dust grains and later recycled into the ISM by the GRB radiation. The absorption features from the outer shell, on the other hand, are very similar for the non-dusty and the dusty scenarios. Therefore, we present in the following detailed results only for the case of a GRB exploding in the dusty CSM of a massive star.
Figures 5, 6, and 7 display the results of the time dependent ionization profiles for HI, HeII, SiII, SiIII, SiIV, CII, CIV, and FeII, along lines of sights corresponding to , , and . To incorporate velocity information, we show a shaded column density map for each line of sight and a few key ions, with color/shade indicating the observable column density along the line of sight, the y-axis indicating the velocity, and the x- axis indicating time. A negative velocity here represents a blue-shifted velocity towards the observer. Note that the maximum velocity does vary with angle, as a result of the anisotropic nature of the CSM produced by a rotating star. The displayed times range logarithmically from about seconds to seconds.
There are some common features that are interesting to note. In particular, the column densities of the gaseous components of the low-ionization states of C, Fe and Si, which are locked into dust grains before the burst goes off, are negligible at (explosion time), they then increase as the grains are destroyed by the burst radiation and recycled into the ISM, and eventually decrease as the ions are photoionized. This time evolution sequence is much faster at small viewing angles, given the stronger radiation field from the GRB.
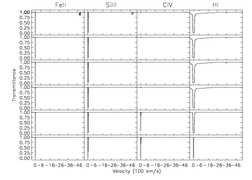
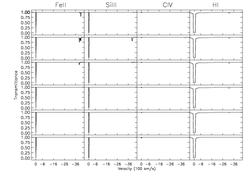
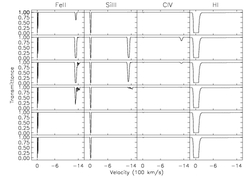
Figures 8 through 10 show several snapshots (between s and s) of the normalized transmission spectra for each of the three representative lines of sight. The times in these figures correspond to the vertical dotted lines in the aforementioned column density plots. We do not include information at later times because the spectra have stopped evolving at this point, as is apparent from Figures 5, 6, and 7.
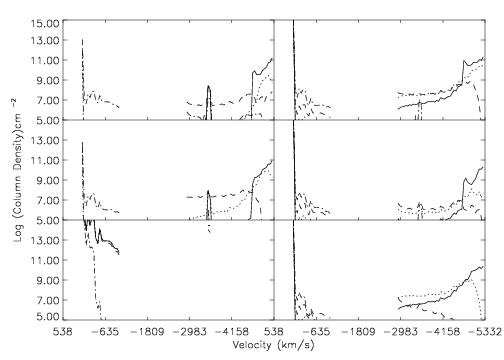
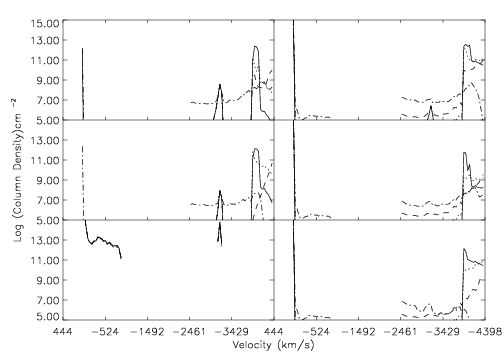
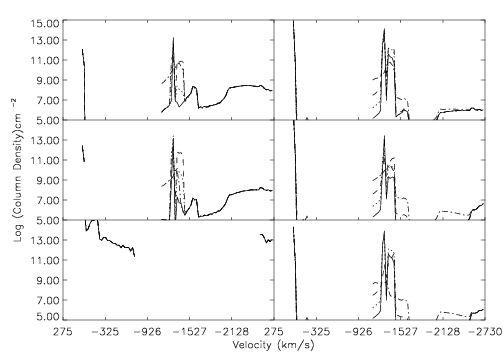
Additionally, we include cross sections across the column density plots for the time steps shown in the sample spectra (Figures 11, 12,and 13). These simply show, perhaps in a simpler manner than the column density maps, the column densities vs. the velocity of the gas for a few selected ions. We indicate the most notable features in section 3.1.
3.1 Manifestation of the Velocity Structure.
To keep these results in context, it is helpful to refer to Figs. 1 and 2, since the velocity structure depends on , and also it is helpful to note the location of certain velocity structures since this has a direct impact on the ionization timescale. For example, along all lines of sight, the free streaming region extends from our minimum radius of cm, and experiences a slow variation in velocity from there to a distance of about cm. This is the innermost area of the CSM in our simulation. The inner subset of this region, up to about cm, has the highest number density, and a temperature around K (Figure 1). This is the region where the high-velocity features seen in the spectra are produced. For example, for (Figure 5), this accounts for the 3500 km/s feature for HI, as well as the 5000 km/s component present in several of the other ions.
As Figure 1 indicates, there are indeed isolated structures at specific velocities. The most dominant one is perhaps the least interesting, the outer shell which is nearly at rest ( km/s), and is expected by the most basic stellar wind models. This is observable as the high density feature at the bottom of each shaded column density plot. Equally ubiquitous is a large bubble of shocked wind, which is visible in Figure 1 as the sudden drop in velocity at about cm. This region occupies the majority of our simulation space, and because of its very hot, K temperatures, none of the ions that we track are present in this region.
We present the spectra for four different ions where we seek to determine if the velocity structure becomes visible. First, we note that Hydrogen is highly ionized in the inner region and thus is a poor tracer of velocity structure. However, the outer shell does contribute a large hydrogen component and the near 1215.67 rest frame Ly- feature can thus act as a diagnostic of the outer shell.
In the case, (Fig. 8), we see some higher velocity components for ions associated with dust such as SiIII, FeII, and CIV. These appear only at early times, when the burst initially destroys the dust, releasing Si and Fe. However, at this head-on angle, the intensity of ionizing radiation is high, quickly ionizing the released ions and destroying this signature of the high velocity wind almost immediately.
In the line of sight, the rest frame Ly- line exhibits a behavior similar to the case, but on longer timescales. Rest frame and near rest frame features also exhibit a very similar behavior as in the case. Of particular note is Figure 10, corresponding to the viewing angle, in which we see finely structured FeII and SiIII lines due to the release of gas from dust in the high velocity region of the CSM. These survive on the order of a few seconds before being ionized to higher states.
4 Summary and Discussion
In this paper we have presented a comprehensive calculation of the spectra of a typical GRB which explodes in the CSM created by a massive, chemically homogeneous, low-metallicity rotating star. We have explored both a dusty CSM as well as a dust-free one. These stars are strong candidates for the typical progenitors of long GRBs; therefore, the models presented here, in combination with an average GRB luminosity and spectrum, are expected to yield the typical expectations for the spectra during both the prompt and the afterglow phase of the GRB. We emphasize, however, that an accurate prediction can be obtained only from a tailored time-dependent simulation for each particular burst, and hence our results should rather be seen as an example of the overall evolution, whose details will then depend on the spectrum and luminosity of the specific burst.
We have performed the calculation of the transmittance for different lines of sights with respect to the GRB jet axis (assumed to coincide with the rotation axis of the star), thus exploring the latitudinal variation of the spectra, which include the -dependence of both the CSM profiles as well as of the GRB luminosity.
The highest velocity components of the CSM, reaching velocities above 5000 km/s, exist predominantly at small viewing angles (with respect to the rotation axis of the progenitor). This is where the burst is most luminous, and thus ionization timescales are very fast. We do see the presence of several ions at these velocities, but this region becomes completely ionized in a fraction of a second, and an actual observation of the high velocity features seems hopeless, at least for the star considered in this study.
Lines of sight at higher latitude are characterized by smaller maximum velocities, with the maximum being around 2800 km/s in the case of a line of sight at . In our model, even at these latitudes, ions with lines around 1000 km/s cannot survive the entire burst without being photoionized. From a purely theoretical prospective, the time variability of the high velocity lines, and in particular, the transition from a nearly featureless spectrum to high column density lines back to a featureless or weak lined system like the one observed in our study, is a clear signature that the lines are associated with the CSM, and furthermore, that they are due to the destruction of dust in the CSM created by the progenitor star. Practically, however, observational detection of such variability with current instruments is not feasible.
Observationally, high-velocity lines have been reported in GRB 021004 by Fiore et al. (2005) after about 16 hr from the trigger. From the analysis presented in this paper, we find that these features, if associated with the free-streaming wind of a progenitor star like the one discussed here, could have survived till these late times only if the burst had a very low luminosity. Since this is not supported by observations (the luminosity of GRB 021004 was rather high), the only way to associate these lines to a wind is by requiring a very special event, in which the progenitor star would possess an unusually strong wind, and it were to explode in a very low density medium. Alternatively, the observed late-time, high-velocity lines could be simply due to intervening absorbers (Chen et al. 2007).
In summary, during the initial moments of the GRB explosion, the optical absorption spectra present a very rich phenomenology due to the different speeds at which the wind components move away from the progenitor side (van Marle et al., 2008). If we were able to observe these early phases, we could derive a wealth of information on the properties of the progenitor stars of GRBs. More generally, this would be of great importance to the study of the final stages of stellar evolution. Observationally, however, it is extremely challenging to catch variability on such small timescales, shorter even than the time it usually takes to localize the burst. Therefore we conclude that, if the massive stars progenitors of GRBs are indeed of the kind studied here (as suggested by theoretical investigations), then the high-velocity lines produced in their winds are practically invisible, even for very low-luminosity bursts (such as the case that we considered). The only observational signatures of the GRB progenitor stars are imprinted in non-variable absorption lines produced in the termination shock of the wind. Previous detections of high-velocity lines must therefore be due to intervening absorbers, unless the GRB progenitor star had extreme properties well outside of the range considered here.
5 acknowledgments
We thank Sung-Chul Yoon and Norbert Langer for the use of their stellar evolution model, and Matt van Adelsberg for his calculations of the fraction of excited levels for the most important ions that we considered. We also thank a very careful and thoughtful referee, whose comments greatly helped the presentation of our manuscript.


References
- Allen et al. (1972) Allen, D.A., Harvey, P.M. and Swings, J.P., 1972, A&A, 20, 333.
- Anders & Grevesse (1989) Anders E., Grevesse N., 1989, Geochim. Cosmochim. Acta, 53, 197
- Band et al. (1993) Band D. et al. 1993, ApJ, 413, 281
- Campana et al. (2008) Campana et al., 2008, ApJ, 683, L9
- Cantiello et al. (2007) Cantiello M., Yoon S.-C., Langer N., Livio M., 2007, A&A, 465, L29
- Chen et al. (2008) Chen et al., 2008, ArXiv e-prints
- Chen et al. (2007) Chen et al. ,2007, ApJ, 663, 420
- Crowther (2003) Crowther P. A., 2003, Ap&SS, 285, 677
- D’Elia et al. (2007) D’Elia V. et. al., 2007, A&A, 467, 629
- D’Elia et al. (2008) D’Elia V. et. al., 2009a, ApJ, 694, 332
- D’Elia et al. (2009) D’Elia V. et. al., 2009b, A&A, in press, arXiv:0906.3187
- Dwarkadas (2005) Dwarkadas V. V., 2005, ApJ, 630, 892
- Eldridge et al. (2006) Eldridge J. J., Genet F., Daigne F., Mochkovitch R., 2006, MNRAS, 367, 186
- Fiore et al. (2005) Fiore F. et al., 2005, ApJ, 624, 853
- Fox et al. (2008) Fox A. J. et al., 2008, A&A , 491,189
- Hardee et al. (2007) Hardee P., Mizuno Y., Nishikawa K.-I., 2007, Ap&SS, 311, 281
- Hjorth et. al (2003) Hjorth J. e. a., 2003, Nature, 423, 847
- Kouveliotou et al. (1993) Kouveliotou C., Meegan C. A., Fishman G. J., Bhat N. P., Briggs M. S., Koshut T. M., Paciesas W. S., Pendleton G. N., 1993, ApJ, 413, L101
- Lazzati (2008) Lazzati D., 2008, MNRAS, 384, 165
- Lazzati & Perna (2003) Lazzati D., Perna R., 2003, MNRAS, 340, 694
- Lazzati et al. (2006) Lazzati D., Perna R., Flasher J., Dwarkadas V. V., Fiore F., 2006, MNRAS, 372, 1791
- Liang et al. (2008) Liang E.-W., Racusin J. L., Zhang B., Zhang B.-B., Burrows D. N., 2008, ApJ, 675, 528
- MacFadyen & Woosley (1999) MacFadyen A. I., Woosley S. E., 1999, ApJ, 524,262
- Matheson et al. (2003) Matheson T. et al., ApJ, 582, L5
- McKinney (2006) McKinney J. C., 2006, MNRAS, 368, 1561
- Meliani et al. (2006) Meliani Z., Sauty C., Vlahakis N., Tsinganos K., Trussoni E., 2006, A&A, 447, 797
- Mirabal et al. (2003) Mirabal N. et al., 2003, ApJ, 595, 935
- Möller et al. (2002) Möller P. et al., 2002, A&A, 396, L21
- Panaitescu (2007) Panaitescu A., 2007, MNRAS, 379, 331
- Peng et al. (2005) Peng F., Königl A., Granot J., 2005, ApJ, 626, 966
- Perna & Lazzati (2002) Perna R., Lazzati D., 2002, ApJ, 580, 261
- Perna et al. (2003) Perna R., Lazzati D., Fiore F., 2003, ApJ, 585, 775
- Prochaska et al. (2006) Prochaska J. X., Chen H-W., Boolm J. S., 2006, ApJ, 648, 95
- Prochaska et al. (2008a) Prochaska J. X., Chen H.-W., Dessauges-Zavadsky M., Bloom J. S., 2008a, in Galassi M., Palmer D., Fenimore E., eds, American Institute of Physics Conference Series Vol. 1000 of American Institute of Physics Conference Series, Resolving The ISM Surrounding GRBs with Afterglow Spectroscopy. pp 479–485
- Prochaska et al. (2008b) Prochaska J. X. et al., 2008b, ApJ, 685, 344
- Ralchenko et al. (2008) Ralchenko, Yu., Kramida, A.E., Reader, J., and NIST ASD Team (2008). NIST Atomic Spectra Database (version 3.1.5), [Online]. Available: http://physics.nist.gov/asd3 [2009, February 3]. National Institute of Standards and Technology, Gaithersburg, MD.
- Rossi et al. (2002) Rossi E., Lazzati D., Rees M. J., 2002, MNRAS, 332, 945
- Rybicki & Lightman (1979) Rybicki G. B., Lightman A. P., 1979, Radiative processes in astrophysics. New York, Wiley-Interscience, 1979. 393 p.
- Schaefer et al. (2003) Schaefer B. E. et al., 2003, ApJ, 588, 387
- Stanek et al. (2003) Stanek K. Z. et. al., 2003, ApJ, 591, L17
- Starling et al. (2005) Starling R. L. C., Wijers R. A. M. J., Hughes M. A., Tanvir N. R., Vreeswijk P. M., Rol E., Salamanca I., 2005, MNRAS, 360, 305
- Thöne et al. (2008) Thöne C. C. et al., 2008, A&A, 489,37
- van Marle et al. (2006) van Marle A. J., Langer N., Achterberg A., García-Segura G., 2006, A&A, 460, 105
- van Marle et al. (2008) van Marle A. J., Langer N., Yoon S.-C., García-Segura G., 2008, A&A, 478, 769
- van Paradijs et al. (2000) van Paradijs J., Kouveliotou C., Wijers R. A. M. J., 2000, ARA&A, 38, 379
- (46) Vreeswijk P. M., Moller P., Fynbo J. P. U. 2003, A&A, 409L, 5
- Vreeswijk et al. (2007) Vreeswijk et al., 2007, A&A,468, 83
- Whalen et al. (2008) Whalen D. et al., 2008, ApJ, 682,1114
- Williams et al. (1990) Williams P. M., van der Hucht K. A., Pollock A. M. T., Florkowski D. R., van der Woerd H., Wamsteker W. M., 1990, MNRAS, 243, 662
- Woosley & Heger (2006) Woosley S. E., Heger A., 2006, ApJ, 637, 914
- Yoon & Langer (2005) Yoon S.-C., Langer N., 2005, A&A, 435, 967
- Yoon et al. (2006) Yoon S.-C., Langer N., Norman C., 2006, A&A, 460, 199
- Zhang & Mészáros (2002) Zhang B., Mészáros P., 2002, ApJ, 581, 1236