Magnetic Drag on Hot Jupiter Atmospheric Winds
Abstract
Hot Jupiters, with atmospheric temperatures K, have residual thermal ionization levels sufficient for the interaction of the ions with the planetary magnetic field to result in a sizable magnetic drag on the (neutral) atmospheric winds. We evaluate the magnitude of magnetic drag in a representative three-dimensional atmospheric model of the hot Jupiter HD 209458b and find that it is a plausible mechanism to limit wind speeds in this class of atmospheres. Magnetic drag has a strong geometrical dependence, both meridionally and from the day to the night side (in the upper atmosphere), which could have interesting consequences for the atmospheric flow pattern. By extension, close-in eccentric planets with transiently heated atmospheres will experience time-variable levels of magnetic drag. A robust treatment of magnetic drag in circulation models for hot atmospheres may require iterated solutions to the magnetic induction and Saha equations as the hydrodynamical flow is evolved.
1. Introduction
Hot Jupiters are close-in, presumably tidally-locked gaseous giant planets orbiting only a few stellar radii away from their Sun-like host star. By virtue of their slow rotation (synchronous with their orbital periods, a few days), high atmospheric temperatures ( K) and permanent day-side hemispheric forcing, hot Jupiters are laboratories for the study of atmospheric dynamics in a regime that is absent from the Solar System (see Showman et al. 2008 and Showman et al. 2010 for reviews). In recent years, considerable progress has been made in observationally characterizing the atmospheres of hot Jupiters via a combination of secondary eclipse, transmission spectrum and phase curve measurements (see Deming 2008 and Charbonneau 2009 for reviews). In parallel with this observational progress, theoretical modeling of hot Jupiter atmospheres has expanded greatly, in an attempt to provide robust interpretations of the growing data set (see, e.g., Burrows & Orton 2010, Showman et al. 2010 and Baraffe et al. 2010 for reviews).
One of the main interests in studying hot Jupiter atmospheres lies in understanding their thermal and dynamical responses to the unusual forcing conditions they are experiencing, with an atmospheric circulation pattern that is likely different from anything known in the Solar System. However, with this new regime also comes the possibility that new physics is at play in these extreme atmospheres (e.g., Menou & Rauscher 2010). In this work, we investigate the possibility that magnetic drag on atmospheric motions provides an effective frictional mechanism limiting the asymptotic speeds of winds in hot Jupiter atmospheres. This is particularly important as the fast (transonic) speeds reached by winds in a variety of drag-free atmospheric models for this class of planets (Dobbs-Dixon & Lin 2008, Dobbs-Dixon et al. 2010; Showman et al. 2009; Rauscher & Menou 2010) raise issues about compressibility, shocks and associated energy conservation for the models (Goodman 2009; Rauscher & Menou 2010).
Atmospheric motions are driven by pressure-gradient forces arising from differential heating of the atmosphere. A small fraction of the atmospheric ”available” enthalpy is continuously converted into kinetic energy of the atmospheric motions, which is itself continuously dissipated by friction111In this context, friction typically refers to a dissipative process that is much more efficient than the microscopic viscosity of the atmospheric gas. (Lorenz 1955, Pearce 1978, Marquet 1991, Goodman 2009). In steady-state, asymptotic wind speeds are thus reached through a detailed balance between continuous thermal forcing and sustained friction. While the source of wind friction on the Earth, and other Solar System terrestrial planets by extension, is understood to be largely associated with surface drag, the origin of friction in the atmospheres of gaseous giant planets remains a major open question in atmospheric science, even in the Solar System (e.g., Schneider & Liu 2009; Liu et al. 2008; Showman et al. 2010). Identifying dominant sources of internal friction in gaseous giant planet atmospheres can thus be as important as adequately modeling their sources of thermal forcing.
We show here that magnetic drag on weakly-ionized winds in the predominantly neutral atmospheres of hot Jupiters, which arises from wind interaction with the magnetic field generated in the planet’s bulk interior, is a plausible source of sizable friction, that may need to be accounted for in atmospheric circulation models of hot Jupiters. We note that, while this manuscript was being prepared, Batygin & Stevenson (2010) completed a study of the closely related ohmic dissipation process associated with the currents induced by magnetic drag. Here, we focus on the role of magnetic drag on atmospheric winds and defer a study of ohmic dissipation to future work.
2. Atmospheric Currents and Ion drag
2.1. Model Atmosphere
Our study is based on the three dimensional hot Jupiter atmospheric circulation model of HD 209458b presented by Rauscher & Menou (2010). The model provides, at each point in the 3D atmosphere, values for the pressure, temperature, zonal (east-west) and meridional (north-south) wind velocity. Throughout this analysis, we use the model atmosphere obtained after 1450 planetary days of integration. The corresponding atmospheric structure and wind pattern are described in detail in Rauscher & Menou (2010).
The model extends vertically from 1 mbar at the top to 220 bar at the bottom. Temperatures are typically around 1800 K in much of the deep atmosphere, while they vary noticeably between day and night near the model top, with lows of about 500 K and highs of about 1500 K. From the pressure and temperature, we infer local gas densities using the ideal gas law, , with mean molecular weight . Densities in the atmosphere range from about g cm-3 at the model bottom to g cm-3 at the top.
2.2. Ionization
High in the atmosphere (say, at nanobar levels), UV photo-ionization is important in determining the atmospheric ionization level (e.g., Murray-Clay et al. 2009), but in the relatively dense levels modeled here, thermal ionization is expected to dominate the ionization balance.222X-rays could provide a source of additional non-thermal electrons at and above mbar pressure levels, which is ignored from our calculation (J. Goodman, priv. communication).
At the temperatures of interest in our model atmosphere, the main source of free electrons is provided by thermal ionization of alkali metals with low first-ionization potentials: Na, Al, and K. Under these conditions, the mean ion mass is on the order of (see e.g. Draine et al. 1983). For simplicity, we choose to approximate Saha’s equation for ionization balance with a formulation that only accounts for the ionization of potassium (Balbus & Hawley 2000),
| (1) | |||||
where and are the number densities of electrons and of neutrals, respectively (in cm-3), is the potassium abundance, and is the temperature in K. Equation (1) is a valid approximation only as long the resulting ionization fraction, , remains much smaller than the abundance of potassium, . We have verified that this condition is reasonably well satisfied for the atmospheric conditions of interest here, with reaching at most in a few localized regions and taking much smaller values (-) in the rest of the atmosphere. Throughout our analysis, we assume a near solar abundance of potassium, . This is not a critical model assumption given the much more important, exponential dependence of with temperature. We also estimate that, even at K, the free electron contribution from sodium, which is times more abundant than potassium at solar composition, approaches only marginally that of potassium. While a more complete Saha equation solution would be a clear improvement upon the very simple approach adopted here, it would not qualitatively alter our main conclusions about the role of magnetic drag.
We assume conditions of gas neutrality, i.e. , where is the ionic number density. The coupling between charged and neutral particles depends on their rate of collisions, , for which we adopt the expressions from Draine et al. (1983)
| (2) |
The electrical conductivity, , and the corresponding resistivity, , are respectively given by
| (3) |
2.3. Non-ideal MHD regime
Before proceeding with a calculation of induced currents, we need to evaluate the relative importance of various non-ideal MHD effects. We begin by considering the full induction equation
| (4) |
where the last three terms are the ohmic, Hall and ambipolar diffusion terms, respectively. In the above equation, the current density
| (5) |
is the velocity of the neutrals, is the ion mass density and is the drag coefficient, which is given by
| (6) |
We estimate the relative importance of the three non-ideal MHD terms by selecting relevant velocity and length scales for the atmospheric flow. For a representative induction velocity, we take the sound speed , since it is representative of the wind speeds achieved in the modeled transonic flow. Following Rauscher & Menou (2009), we use the adiabatic value , with an adiabatic index . For now, we adopt a pressure scale height, , as a representative length scale for our comparison of the non-ideal MHD terms, even though we argue below that using the resistive scale height may be a more appropriate choice. With these choices, the magnetic Reynolds number can be evaluated as
| (7) |
where erg/g/K is the effective gas constant and m/s2 is the gravitational acceleration of the planet.
We evaluate the relative magnitude of the Ohmic (Ohm), Hall (Hall) and Ambipolar diffusion (Amb) terms with respect to the Induction term (Ind), using the same notation as Balbus & Terquem (2001; see also Sano & Stone 2002) for convenience,
| (8) |
with a velocity scale, v , and length scale, .
We computed these ratios throughout the modeled atmosphere, assuming a nominal field strength G, and found that the Ohmic term is typically larger than the Hall term, by about 12 orders of magnitude in the deepest levels, down to about 3 orders of magnitude in the highest level modeled. The Ohmic term is also found to dominate over the Ambipolar diffusion term, although to a lesser extent. It is about 5 orders of magnitude larger in the deepest levels, down to a factor of only a few in the uppermost modeled level. We conclude that the Hall term can be safely neglected throughout the modeled atmosphere, while the Ambipolar diffusion term could in principle become important in the more tenuous high atmosphere, at and above mbar pressure levels, especially if magnetic field strengths G are considered. Based on these results and in the interest of simplicity, we focus the rest of our analysis on the purely resistive MHD regime.
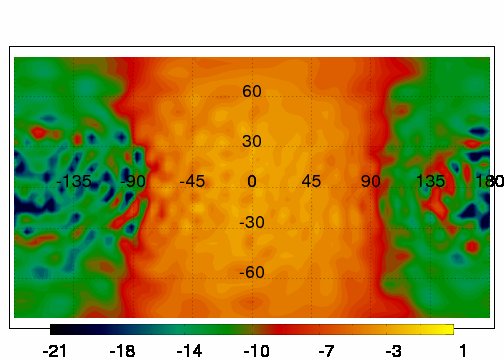
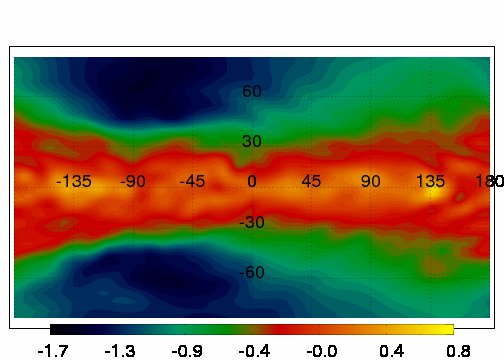
Figure 1 shows cylindrical maps of the magnetic Reynolds number on two different pressure levels in our model atmosphere: the highest level, at mbar (left panel), and a deeper level with bar (right). These magnetic Reynolds number maps largely trace the variations in conductivity at a given pressure level. High in the atmosphere, despite strong winds, the large temperature difference between the day and the night side leads to many orders of magnitude variations in values. By contrast, deeper in, temperature variations on a given pressure level are modest and so are the variations in .
For the treatment of magnetic drag presented in §2.4 to be valid, it is important that in the model atmosphere. Indeed, an atmospheric flow with is coupled to the magnetic field well enough that, in principle, it could generate its own magnetic field via dynamo action, leading to a situation that could significantly complicate any discussion of magnetic drag. Examining values of throughout our model atmosphere, we find that they can exceed unity in particular regions of the atmosphere (as shown, e.g., in Figure 1), but only marginally so.
However, it is also likely that the simple definition of adopted in Eq. (7) effectively overestimates the ability of the model atmosphere to generate its own dynamo. Indeed, the length scale for dimensional analysis in a geometrically anisotropic system like an atmosphere must be chosen carefully. Examination of the specific toroidal component of the induction equation used below (see Eq. [9]) shows that vertical gradients generally dominate over latitudinal ones. The choice of the vertical gradient scale itself is subtle since it is different for pressure () and resistivity (), with a generally shorter resistivity scale from its exponential dependence on temperature. Based on the leading order vertical gradient terms entering Eq. (9), this suggests that may be the relevant scale to define in our problem, rather than . Indeed, is generally smaller than in our model atmosphere, by a factor of a few typically on the dayside and a factor to 100 on the nightside in the upper levels, and by a factor of a few deeper in. Based on these arguments, we assume for the remainder of this analysis that there is no self-induced atmospheric dynamo, so that the planetary magnetic field, originating from deep currents in the bulk interior, is the only relevant one.
2.4. Induced currents and magnetic drag
Since our goal in this work is to establish whether or not the typical magnitude of magnetic drag in hot Jupiter atmospheres is sufficient to appreciably affect their circulation patterns, we adopt the simplest approach possible and make a number of simplifying assumptions. We assume the planetary magnetic field to have a dipolar geometry, with a dipole axis coincident with the rotation axis. The surface magnetic field strengths expected for hot Jupiters are rather uncertain. Jupiter has a field strength varying from about 4 G at the equator to about 15 G at the poles. In our calculations, we assume a fiducial surface field strength G (at the magnetic pole) and discuss the effects of larger field values whenever appropriate.
We adopt a formalism that is closely related to that described by Liu et al. (2008). In particular, we strictly focus our analysis on the zonal (= east-west) component of the atmospheric flow and the drag experienced by this flow as it generates a toroidal field component, and associated currents, from the purely poloidal planetary magnetic field. The generation of the toroidal component of the magnetic field is governed by the resistive induction equation
| (9) | |||||
where in spherical coordinates (, , ). We seek a steady-state solution to this induction equation on the assumption that it represents a reasonable value for the level of drag expected in our model atmosphere with prescribed wind speeds. For simplicity, we entirely neglect the poloidal component of the induction equation, which would lead to magnetic drag on the meridional (=north-south) component of the circulation. While this assumption may be justifiable in much of the model atmosphere, where the dominant circulation is zonal, it is likely a poor approximation high up in the atmosphere, where the circulation pattern is away from the substellar point and thus equally meridional as zonal.
In our three-dimensional model atmosphere, resistivity varies strongly in the vertical but it also does so horizontally, in the upper atmosphere (see, e.g., the left panel of Fig. 1). It is thus not a priori clear whether the second-to-last term dominates over the last term in Eq. (9). The relative magnitude of these two terms depends on the relative magnitude of the vertical gradient scale and the horizontal gradient scale for resistivity. We computed the ratio in our model atmosphere and found it to be over the vast majority of the atmospheric domain. As a result, the last term in Eq. (9) is small and can be dropped from the analysis. The domain in which horizontal resistivity gradients can approach vertical gradient values is about 1% of the total, and about 2/3 of this domain resides in the model uppermost layers, at mbar. For these upper levels, our estimates for the magnetic drag may thus be inaccurate in some regions because the strong horizontal resistivity gradients can no longer be ignored.
Under the various assumptions made so far, the meridional component of the current induced by the zonal flow is dominant and can be evaluated as (Liu et al. 2008):
| (10) | |||||
| (11) |
where the last term is associated with a boundary current in the uppermost modeled level, . Eq. (11) expresses that the local current scales as an integral of the zonal flow above the level of interest. Lacking information about the nature of currents possibly flowing from regions above the modeled atmospheric layers, we set this boundary current to zero for simplicity. This represents an important source of uncertainty in our modeling approach, but we note that, unless near cancellations occur, additional boundary currents could in principle contribute to even stronger magnetic drag than estimated here.
We evaluate the magnitude of the magnetic drag on the (mostly neutral) flow by using a standard formulation for “ion drag” based on the bulk Lorentz force experienced by the ionic component (see, e.g., Zhu et al. 2005),
| (12) |
where is the current induced in the atmosphere by the zonal flow. From this, we deduce the typical zonal drag time over which the zonal flow would be brought to a halt,
| (13) |
in the absence of any other forces.
An order of magnitude estimate for the drag can be simply derived by making the approximation , which yields
| (14) |
where , , are typical values, and is the angle between and .
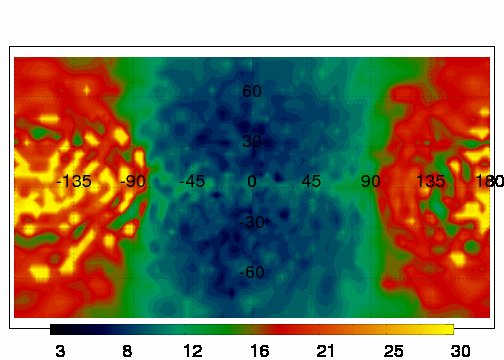
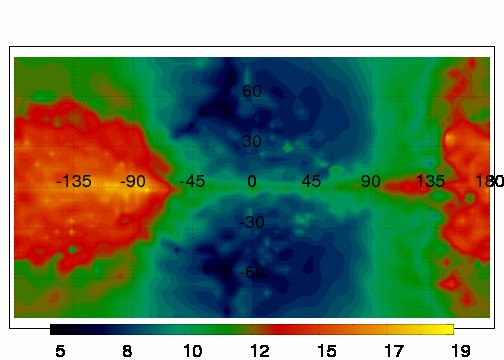
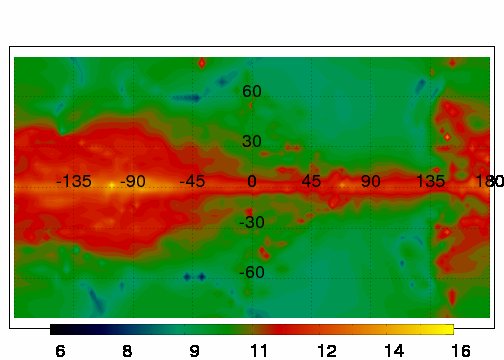
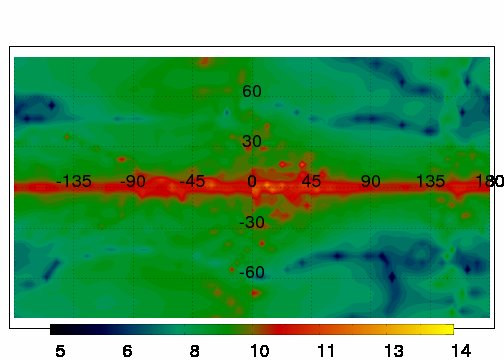
Fig. 2 displays maps of the magnetic drag time from the detailed modeling of Eq. (13), at four depths within the atmosphere. At deeper levels, the drag time is relatively long, sec, with only a few localized pockets with shorter drag times, corresponding to regions of the flow with low velocities. Higher in the atmosphere, the magnetic drag time spans a very large range of values, with very long drag times on the nightside and considerably shorter drag times on the dayside. While magnetic drag is probably negligible on the night side, the short drag times sec on the day side suggest that magnetic drag could be dynamically important in these regions. In addition to the day-night asymmetry in drag times high up in the atmosphere, Fig. 2 shows that zonal drag times are consistently long along the equator. This geometrical effect, which results from the aligned dipolar field geometry assumed in our analysis (leading to at the equator), could have interesting consequences for the atmospheric flow, such as promoting barotropic shear instabilities in the equatorial regions (see, e.g., Menou & Rauscher 2009). This geometrical effect may persist for dipolar field geometries with a small amount of misalignment.
2.5. Preliminary models with Rayleigh drag
Since the shortest drag times shown in Fig. 2 are comparable to a representative zonal advection time in our model atmosphere, s, one may expect such levels of magnetic drag to affect the atmospheric flow non-trivially, even in the presence of continuous thermal forcing of the circulation.
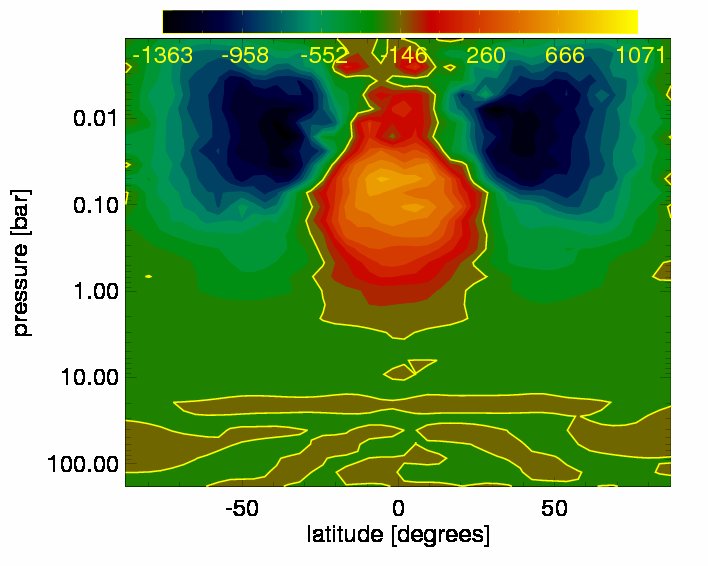
To test this hypothesis, we have run modified versions of the drag-free model described in Rauscher & Menou (2010) in which a vertically-varying but horizontally-uniform level of Rayleigh drag (; see Menou & Rauscher 2009) is applied throughout the modeled flow. For simplicity, an equal amount of drag is applied to the zonal and the meridional velocity fields and only average, representative values of for each pressure level are employed. Assuming a field strength G, we evaluated representative horizontally-averaged values of s at 1 mbar (model top), s at 40 mbar, s at 2 bar and s at 220 bar (model bottom), with a logarithmic dependence of on pressure in between.
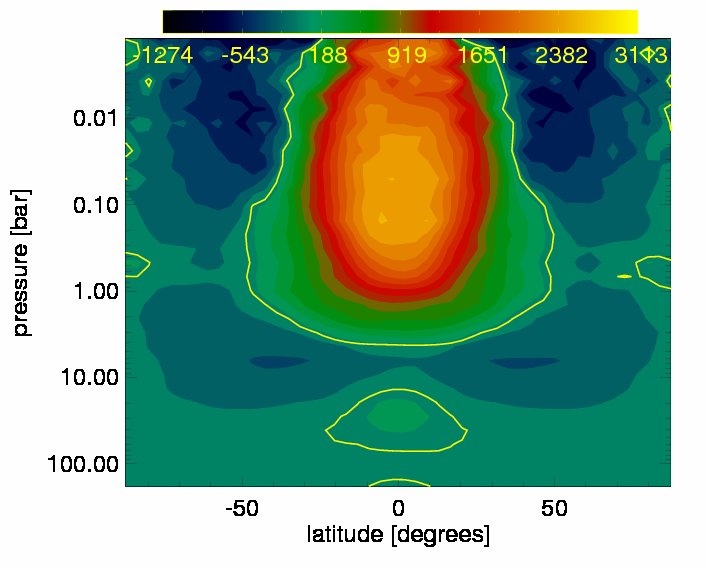
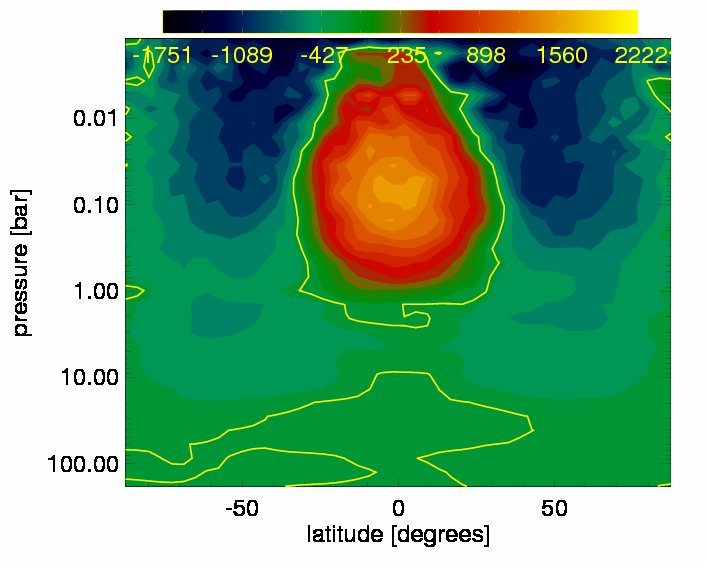
We have run models for the nominal field strength G as well as models with drag times uniformly reduced by a factor 10 and 100 (corresponding to field strengths and ). Each model was run for 500 planet days (=rotation periods). In the model with , a very similar atmospheric flow structure to that described in Rauscher & Menou (2010) is obtained, with zonal wind speeds slightly reduced at the – level (Fig. 3, top panel). In the model with , the atmospheric flow is again qualitatively similar but the superrotating equatorial jet is shallower and confined to levels above bar, while zonal wind speeds are typically reduced by a factor (Fig. 3, middle panel). Finally, in the model with , we witness significant changes in the structure of the atmospheric flow. Zonally-averaged zonal wind speeds in the equatorial jet are reduced by a factor while stronger counter jets dominate at mid-latitudes (Fig. 3, bottom panel). Nevertheless, peak velocities in the upper atmosphere remain supersonic. While these three simple runs are only illustrative, since they do not differentiate zonal and meridional drag or include the strong horizontal dependence of the drag (Fig. 2), they clearly suggest that magnetic drag of the typical magnitude evaluated in this work can have a noticeable, and possibly important, impact on the atmospheric flow of hot Jupiters.
3. Summary and Discussion
Circulation models for hot Jupiter atmospheres have gained substantial interest in recent years thanks to the direct detections of such atmospheres, which indicate a possible role for winds in shaping the emergent properties of these planets. All existing calculations have been purely hydrodynamical in nature, neglecting the possibility that interactions between the flow and the planetary magnetic field could influence the circulation. However, given the high atmospheric temperatures of these planets, the small fraction of the fluid that is ionized may be sufficiently large to effectively couple the mostly neutral flow to the planetary magnetic field.
In this work, we have evaluated the typical magnitude of the magnetic drag exerted on hot Jupiter atmospheric winds, using the flow pattern obtained in the 3D circulation model of Rauscher & Menou (2010). Our results indicate that typical magnetic drag stopping times are a strong function of depth, longitude and latitude. In the upper model atmosphere, temperature differences between the day and night side cause extreme variations of the magnitude of the drag, which could be dynamically important only on the day side. At all levels, zonal drag also varies strongly with latitude in the vicinity of the equator, by virtue of the aligned dipole field geometry adopted.
By adopting a simplified treatment of ionization balance, focusing on the zonal component of drag only, ignoring upper boundary currents or the role of ambipolar diffusion, and neglecting horizontal variations in resistivity, the calculations presented in this work are clearly of limited scope. Nevertheless, they appear sufficient to make the case that dynamically interesting levels of magnetic drag may have to be accounted for in circulation models for hot Jupiter atmospheres. This conclusion is supported by a simple comparison between a drag-free circulation model and a few additional models with Rayleigh drag applied at levels commensurate with that expected from magnetic drag, which show dynamically interesting consequences for the flow, especially for large magnetic field values.
A better assessment of the role of magnetic drag in hot Jupiter atmospheres may require iterated solutions to the multi-dimensional induction equation, together with Saha’s equation, as the time-dependent hydrodynamical flow is evolved. Such work will be important to re-evaluate the role of deep ohmic dissipation in possibly inflating hot Jupiters (Batygin & Stevenson 2010) and to elucidate the plausible diversity of atmospheric behaviors expected from a variety of field strengths and geometries. The strong dependence of resistivity on atmospheric temperature could, in principle, lead to different classes of atmospheric behaviors as a function of mean orbital separation, and it will likely lead to an interesting phenomenology for eccentric close-in planets, as they experience time-variable levels of magnetic drag (and ohmic dissipation).
References
- (1)
- (2) Balbus, S. A., Hawley, J. F. Space Science Rev., 92, 39
- (3)
- (4) Balbus, S., A., Terquem, C. 2001, ApJ, 552, 235
- (5)
- (6) Baraffe, I., Chabrier, G., Barman, T. 2010, Reports on Progress in Physics, Vol. 73, Issue 1, pp. 016901
- (7)
- (8) Batygin, K., Stevenson, D. J. 2010, submitted to ApJL, eprint arXiv:1002.3650
- (9)
- (10) Burrows, A., Orton, G. to appear in “Exoplanets”, Spring 2010 Space Science Series of the University of Arizona Press (Tucson, AZ); Ed. S. Seager; eprint arXiv: 0910.0248
- (11)
- (12) Charbonneau, D., in “Transiting Planets”, Proceedings of the International Astronomical Union, IAU Symposium, Volume 253, p. 1-8
- (13)
- (14) Deming, D. 2008, to appear in Proceedings of IAU Symposium 253; eprint arXiv:0808.1289
- (15)
- (16)
- (17) Dobbs-Dixon, I., Lin, D. N. C. 2008, ApJ, 673, 513
- (18)
- (19) Dobbs-Dixon, I., Cumming, A., Lin, D. N. C. 2010, ApJ, 710, 1395
- (20)
- (21) Draine, B. T., Roberge, W. G., Dalgarno, A. 1983, ApJ, 264, 485
- (22)
- (23) Goodman, J. 2009, ApJ, 693, 1645
- (24)
- (25) Liu, J., Goldreich, P. M., Stevenson, D. J. 2008, Icar., 653, 664
- (26)
- (27) Lorenz, E. N. 1955, Tell, 7, 157
- (28)
- (29) Marquet, P. 1991, Quart. J. Roy. Meteo. Soc. 117, 449
- (30)
- (31) Menou, K., Rauscher, E., 2010, ApJ in press, eprint ArXiv:0910.1346
- (32)
- (33) Menou, K., Rauscher, E., 2009, ApJ 700, 887
- (34)
- (35) Murray-Clay, R. A., Chiang, E. I., Murray, N. 2009, ApJ, 693, 23
- (36)
- (37) Pearce, R. P. 1978, Quart. J. Roy. Meteo. Soc. 104, 737
- (38)
- (39) Rauscher, E. Menou, K. 2010, submitted to ApJ, eprint arXiv:0907.2692
- (40)
- (41) Sano, T., Stone, J., M. 2002, ApJ, 577, 534
- (42)
- (43) Schneider, T., Liu, J. 2009, JAtS, 66, 579
- (44)
- (45) Showman, A. P., Y-K. Cho, J., Menou, K. 2010, to appear in “Exoplanets”, Spring 2010 Space Science Series of the University of Arizona Press (Tucson, AZ); Ed. S. Seager; eprint arXiv: 0911.3170.
- (46)
- (47) Showman, A. P. et al. 2009, ApJ 699, 564
- (48)
- (49) Showman, A. P., Menou, K., Cho, J. Y.-K. 2008, in “Extreme Solar Systems”, ASP Conference Series, Vol. 398, proceedings of the conference held 25-29 June, 2007, at Santorini Island, Greece. Edited by D. Fischer, F. A. Rasio, S. E. Thorsett, and A. Wolszczan, p.419
- (50)
- (51) Zhu, X., Talaat, E. R., Baker, J. B. H. & Yee, H.-H. 2005, Ann. Geo. 2005, 23, 3313
- (52)