Effect of pressure on the Electron Spin Resonance of a Heavy-Fermion metal
Abstract
We investigate the electron-spin resonance (ESR) phenomenon in the heavy-fermion metal YbRh2Si2 by applying hydrostatic pressure up to 3 GPa and by inducing the internal pressure on the Yb site chemically in Yb(Rh1-xCox)2Si2 samples. We found that the increase in pressure, reducing the hybridization between and conduction electrons, leads to a remarkable change in the temperature dependence of the factor and broadens the ESR line. We relate the differences between the effect of internal and external pressure on the low temperature ESR parameters to the disorder induced by Co doping. The pressure effects on the Yb3+ related resonance in YbRh2Si2 again manifest its local character when compared with the resonance of diluted Gd in heavy-fermion metals.
pacs:
76.30.-v, 71.27.+aI Introduction
The Kondo effect is now recognized to be of fundamental importance in a wide class of correlated electron systems. Experiments have demonstrated its significance not only in metals but also in nanoscale magnets, semiconductor quantum dots, carbon nanotubes and individual molecules.Jarillo-Herrero
et al. (2005) The discovery of a well defined electron-spin resonance (ESR) signal in a series of Kondo-lattice systems below the Kondo temperature where heavy-fermion behavior begins to develop gives a unique opportunity to study the evolution of the Kondo state and heavy-fermion formation directly from the ESR measurables.Sichelschmidt et al. (2003); Krellner et al. (2008); Schaufuss et al. (2009) This is a strong advantage in contrast to earlier ESR experiments in Kondo-lattices, which needed Gd doping as an ESR probe.Krug von Nidda et al. (1998) The origin and the unexpectedly small width of the absorption line are currently under intense theoretical investigationsAbrahams and Wölfle (2008); Zvyagin et al. (2009); Schlottmann (2009); Huber (2009); Kochelaev et al. (2009); Wölfle and Abrahams (2009) which take into account that the ESR in Kondo-lattice systems is associated with the presence of ferromagnetic correlationsKrellner et al. (2008). These theories follow approaches within a Fermi liquid Abrahams and Wölfle (2008) and non-Fermi liquidZvyagin et al. (2009); Wölfle and Abrahams (2009) description of itinerant heavy electrons, utilize a Kondo-lattice model Schlottmann (2009), focus on the ESR signatures of the strongly anisotropic Kondo-ion interactions within a molecular field descriptionHuber (2009) or give a microscopic analysis of the spin dynamics of the Kondo-ions.Kochelaev et al. (2009)
A particular interest was drawn to the ESR signal of the Kondo-lattice compound YbRh2Si2 Sichelschmidt et al. (2003) which is located very close to a quantum critical point corresponding to the disappearance of weak antiferromagnetic (AFM) order. Gegenwart et al. (2008) The signal shows pronounced properties of a localized Yb3+ spin state but at the same time heavy-electron properties of the signal could be demonstrated by the signal dependence on the magnetic field.Schaufuss et al. (2009) Conduction electron (CE) spins and Yb3+ spins are strongly coupled and, hence, the ESR parameters were found to reflect changes in the hybridization between - and CE states when changing the unit-cell volume by substituting the Yb or Si sites with La or Ge, respectively.Sichelschmidt et al. (2005); Wykhoff
et al. (2007a) However, these data could not provide conclusive results about the relation of the resonance linewidth to the hybridization strength, the Kondo interaction, and disorder scattering, because in case of Ge doping only one concentration was available and La doping reduces the concentration of Yb3+ spins. Interestingly, the latter influenced the linewidth in a way very reminiscent to a so-called ”bottleneck-relaxation” mechanism Wykhoff
et al. (2007a) which was indicated also by the ESR of Lu doped YbRh2Si2 Duque et al. (2009) and which was discussed extensively for the spin dynamics of diluted magnetic moments in metallic hosts.Barnes (1981) A recent microscopic description of the spin dynamics in YbRh2Si2 reflects a bottleneck relaxation in a dense Kondo system with strong anisotropic exchange interactions: a collective spin motion of the Kondo ions with conduction electrons was shown to explain the narrow linewidth by virtue of the Kondo effect.Kochelaev et al. (2009)
Here we report a systematic investigation of the ESR in YbRh2Si2 by a consecutive change in the hybridization strength by decreasing the unit-cell volume either by applying external hydrostatic pressure or by introducing chemical pressure by doping the Rh site with the isoelectronic but smaller Co ions. The latter allows to discriminate pure pressure effects from the effects of chemical modifications and disorder. As expected, pressure as well as Co doping stabilizes the antiferromagnetism in YbRh2Si2.Friedemann et al. (2009)
Reports of ESR under pressure in metallic compounds are rare owing to the difficulty to achieve a high enough sensitivity. Up to now, there are only two studies available: the first one – of the metal-insulator transition in Yb:Eu by Continentino et al. Continentino et al. (1995), the second one – of the spin relaxation times in CeAl3:Gd by Schlott et al. Schlott and Elschner (1990). It was shown that the external pressure strongly affects the hybridization strength, what leads to the opening of a conduction-band gap in ytterbium at 1.3 GPa and to an increase in the characteristic spin-fluctuation temperature in CeAl3. In contrast to Ce systems, where the application of pressure strengthens the 4-conduction electron hybridization and eventually generates valence fluctuations, the 4 states in an Yb-based heavy-fermion system become more localized under pressure.Goltsev and Abd-Elmeguid (2005) Such a picture successfully describes a decrease in from 25 K to 8 K in YbRh2Si2 with pressures up to 1.7 GPa.Mederle et al. (2002); Tokiwa et al. (2005)
II Experimental Setup
We measured the absorbed power of a transversal magnetic microwave field (X-band, GHz) as a function of an external, static magnetic field . To improve the signal-to-noise ratio, a lock-in technique was used by modulating the static field, which yielded the derivative of the resonance signal . All ESR spectra were obtained from platelet-shaped single crystals with -axis of the tetragonal crystal structure. The samples were prepared and thoroughly characterized as described elsewhere.Trovarelli et al. (2000); Krellner (2009); Klingner (2009)
High-pressure X-band ESR measurements were performed by means of a home-built hydraulic setup, which allows investigations in the pressure range up to 3 GPa.Preusse (1987) The sample was placed in a Cu-Be gasket filled with a methanol-ethanol mixture. The gasket was compressed by two opposed Al2O3 anvils, one of which served simultaneously as a dielectric cylindrical cavity, operated at a TE111 mode. The use of a continuous-flow 4He cryostat allowed to perform measurements in the temperature range 2.5–300 K. The pressure was determined from the jump in the -resistivity at the superconducting transition of small pieces of lead which were put into the gasket together with the sample. The temperature was controlled with a calibrated carbon resistor.
The X-band measurements of the Co doped single crystals were performed at ambient pressure with a standard Bruker Elexsys Spectrometer equipped with a 4He continuous gas-flow cryostat (Oxford instruments).
III Results
In accordance with previous experiments Sichelschmidt et al. (2003) all recorded ESR spectra consist of a single resonance line (see Fig.1, symbols). We can satisfactorily describe the line by a Lorentzian line shape (Refs. Wykhoff et al., 2007b and Zakharov et al., 2003) (frequently called “Dysonian”, solid lines in Fig. 1) which appears asymmetric due to the high sample
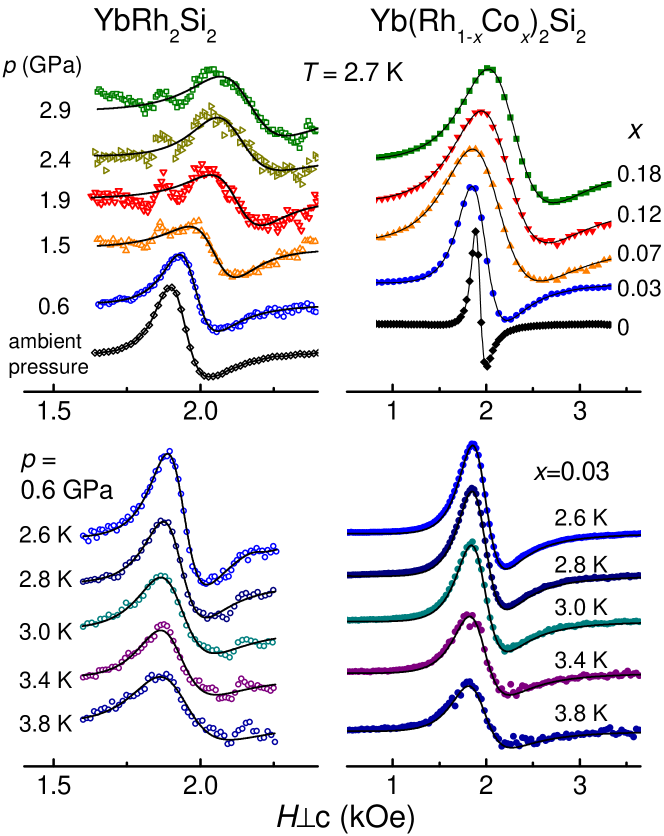
conductivity giving rise to the skin effect which admixes dispersion to the absorption spectra. The skin depth was larger than but, for all samples, much smaller than the sample thickness. We kept the ratio of dispersion to absorption constant, which is reasonable regarding the fact that the skin depth remains by far smaller than the sample dimensions in the temperature range under consideration. The line fits provided the parameters resonance field and half-linewidth at half maximum, . As displayed in Fig. 1 for K, both increasing pressure and Co concentration lead to a line broadening and a shift of towards higher fields. External hydrostatic pressure qualitatively affects the ESR parameters in the same way as chemically induced pressure. For a pressure up to at least 0.6 GPa and a chemical pressure with a Co doping up to the corresponding ESR spectra are equivalent and can be described by the same factors, see Fig. 2. In our pressure setup the ESR factor, as calculated from the resonance condition (: Bohr magneton), amounts to at ambient pressure and K. This agrees well with the previously published value Sichelschmidt et al. (2003) in view of the different, higher quality batch of the crystal used here.
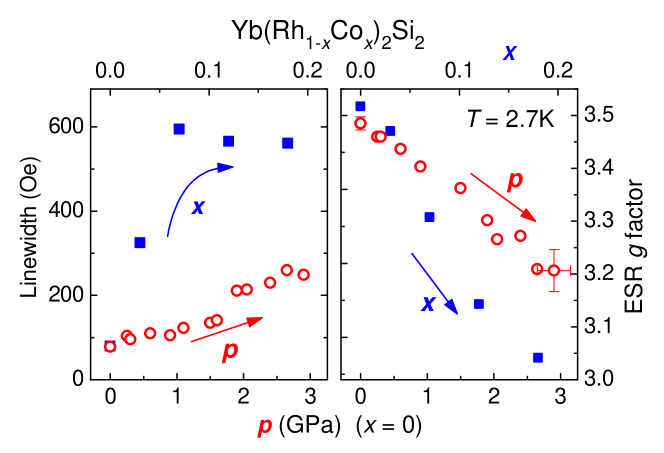
The dependence of the ESR parameters on hydrostatic pressure and chemical pressure by Co doping is displayed in Fig. 2 for K. The - and -values are related according the measured lattice parameters and the bulk modulus of YbRh2Si2.Plessel et al. (2003) The relation could be confirmed by a perfect agreement of the transition temperatures of antiferromagnetic order of the Co-doped and pressurized samples.Friedemann et al. (2009) As shown with the open symbols, increasing hydrostatic pressure leads to an increase in the linewidth from 80 Oe at ambient pressure to 250 Oe at GPa. At the same time the factor shows an almost linear shift down to smaller values of 3.21(4) at GPa. The factor in Yb(Rh1-xCox)2Si2 coincides with the one in the parent compound at low Co concentrations , but deviates to lower values for . At it is shifted by from the value at the corresponding pressure GPa, independently on temperature within experimental error (compare Figs. 3b and 4b). This indicates that the ionic value is reduced by Co doping and, concomitantly, the crystalline electric field should depend on Co doping as well. The typical linewidths in the Co-doped compounds are considerably larger than the linewidths at corresponding pressures and saturate to a value of about 600 Oe for . In this respect one should note the linear relationship between the residual linewidth and the electrical resistivity which was found for La-doped YbRh2Si2 Wykhoff et al. (2007a) and which we discuss for the Co-doped YbRh2Si2 in Sec. IV.
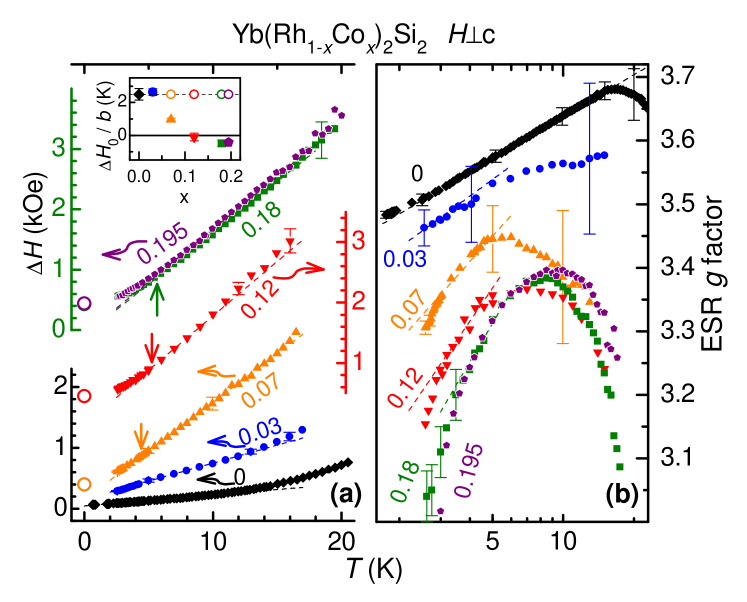
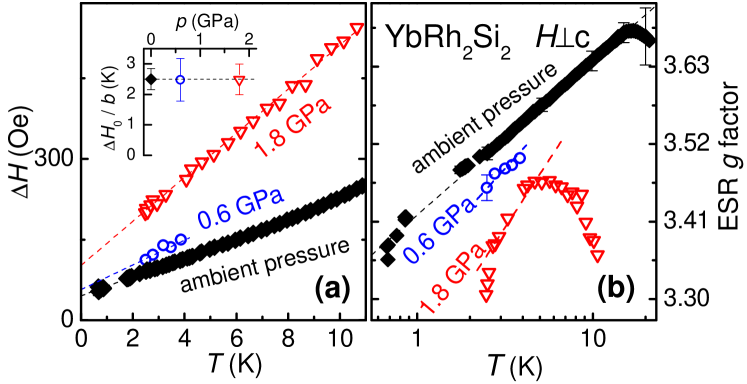
The temperature dependences of the ESR parameters were investigated at hydrostatic pressures of 0.6 GPa and 1.8 GPa and for Co concentrations up to (see illustration in Fig. 5). Figs. 3a and 4a show the results for the ESR linewidth. The dashed lines indicate a linear law in a large -region, reminding to a Korringa law of local moment relaxation towards conduction electrons Barnes (1981) with parameters listed in Tab. 1.
| (GPa) | (kOe) | (Oe/K) | (K) | |
| ambient | 0 | 0.045 | 18 | |
| 0.6 | 0 | 0.057 | 23 | |
| 1.8 | 0 | 0.102 | 41 | |
| ambient | 0.03 | 0.156 | 59 | |
| ambient | 0.07 | 0.150 | 160 | |
| ambient | 0.12 | -0.02 | 180 | |
| ambient | 0.18 | -0.09 | 170 | |
| ambient | 0.195 | -0.075 | 175 |
Notable differences from the Korringa behavior occur above 12 K for , indicating the influence of the first excited crystal-field level.Sichelschmidt et al. (2003) Interestingly, the linewidth data can be characterized by a ratio which indicates an interesting universal feature of the ESR relaxation as depicted in the insets of Figs. 3a and 4a: K remains almost unaffected by pressure and by Co doping up to . Such behavior was previously already identified as a linewidth scaling of various YbRh2Si2 batches (which differ in their residual resistivities) and of La-doped YbRh2Si2 pointing to a common relaxation mechanism to which both and can be ascribed.Wykhoff et al. (2007a) For the ESR linewidth data of Co concentrations two characteristic differences to the corresponding pressure data are observable: Firstly, a deviation from linearity occurs in the low -region which is marked by arrows in Fig. 4. This deviation appears as soon as antiferromagnetic order at much lower temperatures has been established by Co doping, see phase diagram in Fig. 5. Secondly, the ratio strongly deviates from and even negative values of appear for (see Tab. 1). If one assumes the above mentioned universal value K to hold also for Yb(Rh1-xCox)2Si2 with , one obtains values which reasonably agree with the linewidth data at the lowest accessible temperatures (open circles in Fig. 4a).
The temperature dependence of the factor under hydrostatic as well as chemical pressure is illustrated in Figs. 3b and 4b. In the low-temperature region the dashed lines emphasize a logarithmic temperature dependence which could well describe the results for YbRh2Si2 at ambient pressure as was previously reported.Sichelschmidt et al. (2003) In the presence of antiferromagnetic order for pressures larger than 1 GPa (see Fig. 5) deviates from a logarithmic decrease to a much stronger down-turn, see the 1.8 GPa data in Fig. 3b. In this respect two peculiarities are worth to note. For the datasets and the chemical pressure equivalent GPa the deviation appears at the same temperature of about 2.5 K, see Figs. 3b and 4b. Furthermore, in case of the Co doped samples these deviations appear at about the same temperatures where the linewidth departs from the linear temperature dependence, see arrows in Fig. 4a.
IV Discussion
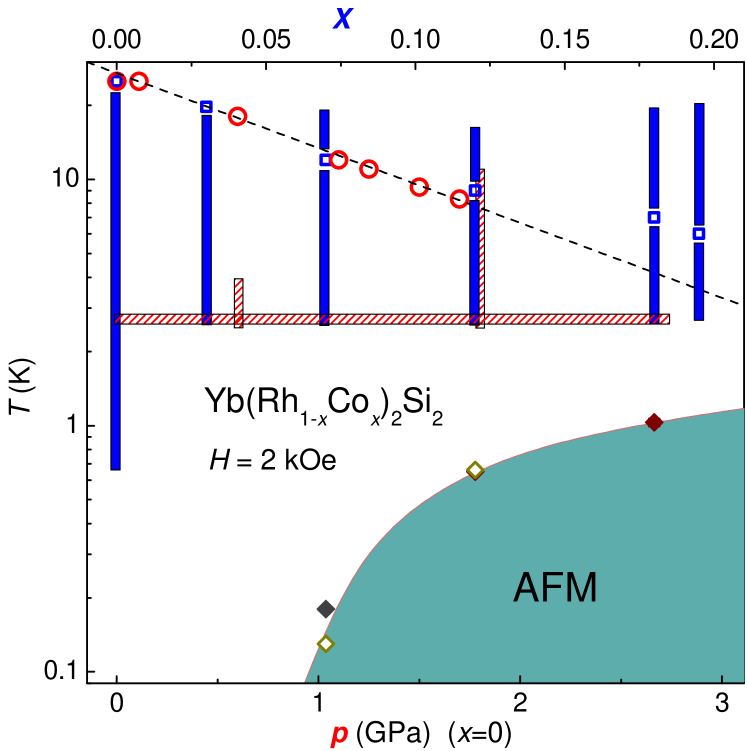
The phase diagram shown in Figure 5 displays the parameter ranges of the ESR experiments under pressure (shaded bars) and Co doping (solid bars) together with magnetic and electronic properties. Applying pressure (either external hydrostatically or chemically by Co doping) suppresses the fluctuations of the Yb-valence and leads to a decrease in the Kondo temperature .Goltsev and Abd-Elmeguid (2005) This effect is shown by the open circles and open squares which correspond to the characteristic spin-fluctuation temperature in the 4-increment of the low-temperature electronic specific heat . At ambient pressure and zero field was shown to match with the single-ion Kondo temperature (obtained by evaluating the 4 entropy)Gegenwart et al. (2006) and, hence, the temperature dependence of is consistent with an exponential law shown by the dashed line: where is the exchange integral between 4 electrons and conduction electrons and is the conduction electron density-of-states at the Fermi surface, and assuming . Figure 1 demonstrates the qualitatively corresponding effect of pressure and Co doping on the ESR results which confirms that pressure effects are amenable with our ESR setup. The pressure effect on the temperature dependence of the linewidth can nicely be compared with the pressure effect on the ESR relaxation of diluted Gd3+ in Ce-Kondo-lattice systems, in CeAl3 for instance.Schlott and Elschner (1990) There, both the magnetic susceptibility and the fluctuation time of the Ce-4 moments decrease by application of pressure. This effect could be detected in the low temperature relaxation of the Gd3+ resonance: with increasing pressure the linewidth shows a decrease in the linear temperature slope and, simultaneously, a decrease in . A corresponding pressure effect, transferred to Yb-systems,Goltsev and Abd-Elmeguid (2005) is reflected by the linewidth behavior of YbRh2Si2. In agreement with the pressure-induced decrease in (dashed line in Fig. 5) the slope of the linewidth is increased by pressure and, also, a simultaneous increase in is observed (see Figs. 3a and 4a). This equivalency points out that the ESR in YbRh2Si2 shows features of a local Yb3+ spin relaxation being influenced by the spin dynamics of the surrounding Yb3+ ions. A theoretical basis for understanding such signatures of locality in the linewidth-pressure dependences may be supplied by a recently developed model of the collective spin motion of 4- and conduction-electron spins in a Kondo lattice with strongly anisotropic Kondo interactions.Kochelaev et al. (2009) It reveals for the bottleneck regime a collective spin mode with a narrow linewidth showing the observed temperature dependence. In this model, besides the strong reduction in the linewidth by virtue of the Kondo effect, the line experiences also a “motional” narrowing process due to the translational diffusion of quasilocalized -electrons in the non-Fermi liquid state. If the RKKY interaction between nearest Yb ions is ferromagnetic, the diffusion process is supported and, hence, the linewidth depends also on the presence of short-range ferromagnetic fluctuations in YbRh2Si2. The application of pressure stabilizes antiferromagnetic correlations, leading to more localized electrons and reduces the efficiency of the motional narrowing process. Within the phenomenology of a heavy-quasiparticle spin resonance the effect of ferromagnetic fluctuations on the quasiparticle scattering and spin-lattice relaxation was also found to significantly narrow the linewidth.Wölfle and Abrahams (2009) Furthermore, this framework stresses the role of the lattice coherence of the quasiparticles for effectively preventing a strong local relaxation of the Kondo spin. Therefore, regarding the different effect of Co doping and pressure for the absolute linewidth values one would expect a line-broadening once the lattice coherence is disturbed by Co doping which, indeed, is observed, see Fig. 2. However, both approaches, describing the spin dynamics with a collective spin mode or within a quasiparticle picture, have not yet explicitly considered the pressure variation in the Kondo temperature in their expressions for the linewidth and factors.
Experimentally, a pressure-dependent Kondo scale is suggested by the observed dome-shape of the factor temperature dependence by application of pressure. With increasing temperature reveals a logarithmic-like increase in a limited region of temperature which is followed by a substantial decrease. This happens at a temperature which is largest at ambient pressure and suggesting a relation of the dome position and the Kondo temperature. The theoretical considerations for a heavy-quasiparticle spin resonance indeed qualitatively predict such a dome in in the non-Fermi liquid regime which is determined by the temperature dependence of the quasiparticle effective mass and a contribution from a small anisotropy in the spin-exchange.Wölfle and Abrahams (2009) From the low temperature behavior of the factor the collective spin-mode approach reveals a characteristic temperature for the ground Kramers doublet which is by two orders of magnitude smaller than the Kondo temperature.Kochelaev et al. (2009)
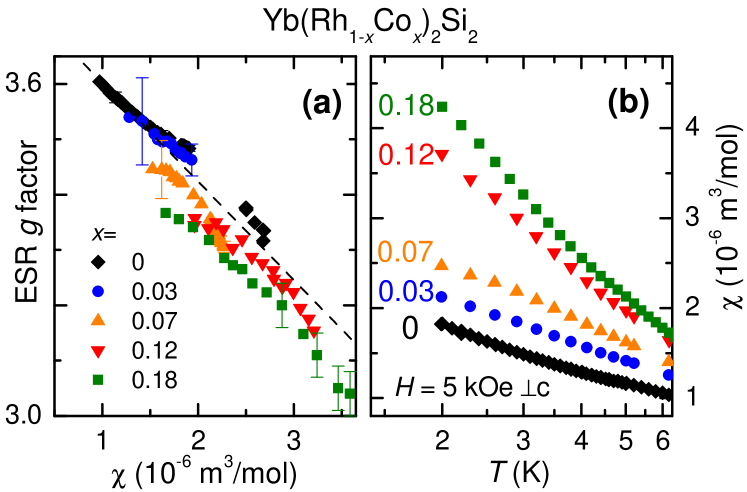
For all pressures the observed ESR factors drop considerably below the insulator value expected for Yb3+ in YbRh2Si2. For the previous results at ambient pressure this negative shift was related to a negative, antiferromagnetic effective exchange coupling and a direct relation between the factor and the static magnetic susceptibility was found.Sichelschmidt et al. (2003) Figure 6 shows that this is also the case for the Co-doped samples (appropriate susceptibility data under pressure were not available): the values for various Co contents are shifted to smaller values proportional to the susceptibility. Such behavior cannot be explained by the effect of demagnetization which leads to a much weaker influence of the -factor (% for K) and which, moreover, would correspond to an opposite temperature dependence of the -factor. Therefore, the temperature-dependent shift of the resonance could mostly be determined by the temperature dependence of internal antiferromagnetic exchange fields. A corresponding molecular-field approximation of the effective factor, , is indicated by the dashed line in Figure 6a with Kutuzov et al. (2008) and the molecular field parameter which is consistent with the -values estimated in Ref. Duque et al., 2009. With increasing Co content from to one observes a parallel-like down-shift of the curves which corresponds to a decrease in of approximately while a change in could not be resolved within the given experimental accuracy. The decrease in could be caused by changing the crystalline electric field with Co doping as was mentioned above, regarding the differences between the pressure- and doping-induced shifts, see Fig. 2. The close relationship between the factor and the magnetic susceptibility points out that the resonance reflects the local Yb3+ magnetic properties directly.
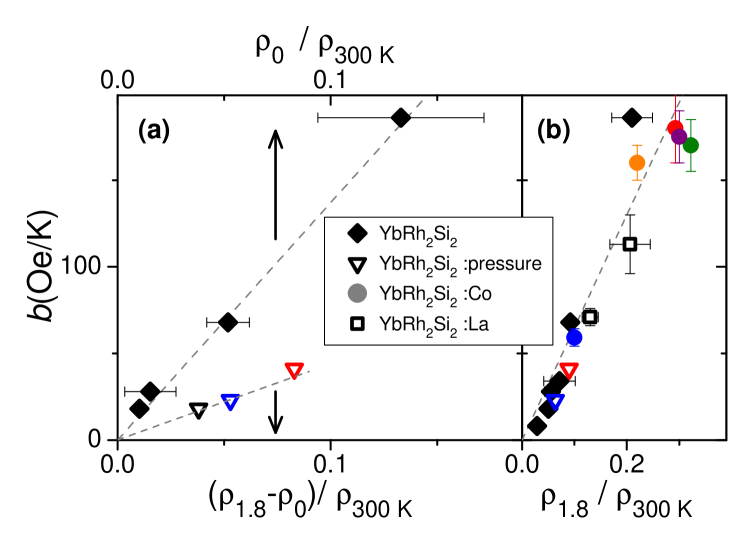
As was shown in Sec. III, the linewidth behavior under pressure is characterized by K which provides evidence for a common relaxation mechanism involved in the residual linewidth and the slope of the linear temperature dependence . In this respect it is interesting to note the relation of both quantities to the residual electrical resistivity indicating the relevance of charge transport scattering processes for the ESR relaxation in YbRh2Si2. This was previously shown for in Ref. Wykhoff et al., 2007a and is illustrated for in Figure 7. In order to discriminate the scattering effects from disorder and Kondo interaction, Figure 7a compares as a function of the disorder-dominated (upper axis) with the Kondo-dominated (lower axis). Whereas the effect of disorder variation should only show up among different YbRh2Si2 samples, the variation in the Kondo interaction should be dominant for the samples at various pressures. Indeed, as shown in Fig. 7a, this situation is evidenced for the -values by their linear relation with the respective resistivity data. For the samples with La- and Co-doping both disorder scattering and Kondo interaction contribute to which then appears linearly related to as shown in Fig. 7b. In particular, with K, this behavior is also observable for the Co-doped samples with and, thus, the extrapolation of the residual linewidth values shown by the open circles in Fig. 4a is also supported by .
Nevertheless, the difference between the application of hydrostatic and chemical pressure for the electrical resistivity does not fully relate to the difference for the ESR parameters. This is most clearly indicated by the behavior of the linewidth towards low temperatures where the continuous linearity of the pressure data is in contrast to the presence of a kink in the Co data for (arrows in Fig. 4a). Interestingly, also marks the lower bound for long-range antiferromagnetic order (in the presence of an X-band resonance field of kOe) as shown in the phase diagram of Fig. 5 by the dark shaded area. Usually, when approaching magnetic ordering by lowering the temperature a slowing down of spin fluctuations results in a reduced narrowing process in the linewidth, i.e., in its increase. This provides a larger contribution from inhomogeneous broadening and is observed, for instance, for the resonance of Gd3+ in Ce(Cu1-xNix)2Ge2 ().Krug von Nidda et al. (1998) However, whether magnetic ordering is the dominant source for the arrow marked deviations of the data, is questionable regarding the lack of deviation from linearity in the pressure linewidth data. Also, the relation K provides evidence that inhomogeneous broadening does not dominate in the regime where AFM order occurs at low temperatures. These considerations point out that investigating the spin dynamics in YbRh2Si2, as characterized by the ratio K, is better achieved by the ESR under pressure than by the ESR with Co-doping where the spin dynamics is obscured by additional disorder-related effects.
V Conclusion
We have studied the effect of hydrostatic pressure GPa and Co doping on the ESR in Yb(Rh1-xCox)2Si2. Both, hydrostatic pressure and chemical pressure by Co doping lead to qualitatively the same effect, namely, an increase of the linewidth and a decrease of the factor under pressure while at the same time the Kondo temperature is decreased. The pressure dependence of the linear temperature slope of the linewidth is equivalent to the linewidth behavior of local Gd3+ spins serving as diluted ESR probes in Ce-based heavy-fermion compounds.Schlott and Elschner (1990) There, the change in the low-temperature slope under pressure is explained by the change in the Kondo temperature. Therefore the equivalency reveals two conclusions: (i) the ESR in YbRh2Si2 looks alike a resonance of local Yb3+ spins in a metallic environment and (ii) the Kondo temperature is a relevant parameter to describe the linewidth. The present theoretical frameworks for the ESR in YbRh2Si2 Kochelaev et al. (2009); Wölfle and Abrahams (2009) provide a reasonable basis to understand the ESR under pressure in terms of the Kondo effect and the presence of ferromagnetic correlations. The different effect of Co doping and pressure on the linewidth suggests that disorder induced by Co doping is more effective in destroying the lattice coherence, the latter being essential for observing narrow ESR lines in dense Kondo-lattice systems.Wölfle and Abrahams (2009) The linewidth data for all investigated pressures and Co contents could be characterized by a universal ratio between the residual linewidth and the slope of the linear temperature dependence of the linewidth. By relating both quantities to the scattering processes of charge transport the evolution of the ESR data with pressure allow a further characterization of the influence of the Kondo interaction to the ESR of YbRh2Si2.
This work was supported by the DFG within TRR 80 (Augsburg, Munich), by the Volkswagen Foundation (Grant No. I/82203 and I/84689), and the DFG Research Unit 960 “Quantum Phase Transitions”. We acknowledge fruitful discussions with M. Brando.
References
- Jarillo-Herrero et al. (2005) P. Jarillo-Herrero, J. Kong, H. S. J. van der Zant, C. Dekker, L. P. Kouwenhoven, and S. De Franceschi, Nature 434, 484 (2005).
- Sichelschmidt et al. (2003) J. Sichelschmidt, V. A. Ivanshin, J. Ferstl, C. Geibel, and F. Steglich, Phys. Rev. Lett. 91, 156401 (2003).
- Krellner et al. (2008) C. Krellner, T. Förster, H. Jeevan, C. Geibel, and J. Sichelschmidt, Phys. Rev. Lett. 100, 066401 (2008).
- Schaufuss et al. (2009) U. Schaufuß, V. Kataev, A. A. Zvyagin, B. Büchner, J. Sichelschmidt, J. Wykhoff, C. Krellner, C. Geibel, and F. Steglich, Phys. Rev. Lett. 102, 076405 (2009).
- Krug von Nidda et al. (1998) H.-A. Krug von Nidda, A. Schütz, M. Heil, B. Elschner, and A. Loidl, Phys. Rev. B 57, 14344 (1998).
- Abrahams and Wölfle (2008) E. Abrahams and P. Wölfle, Phys. Rev. B 78, 104423 (2008).
- Zvyagin et al. (2009) A. A. Zvyagin, V. Kataev, and B. Büchner, Phys. Rev. B 80, 024412 (2009).
- Schlottmann (2009) P. Schlottmann, Phys. Rev. B 79, 045104 (2009).
- Huber (2009) D. L. Huber, J. Phys.: Cond. Matter 21, 322203 (2009).
- Kochelaev et al. (2009) B. I. Kochelaev, S. I. Belov, A. M. Skvortsova, A. S. Kutuzov, J. Sichelschmidt, J. Wykhoff, C. Geibel, and F. Steglich, Eur. Phys. J. B 72, 485 (2009).
- Wölfle and Abrahams (2009) P. Wölfle and E. Abrahams, Phys. Rev. B 80, 235112 (2009).
- Gegenwart et al. (2008) P. Gegenwart, Q. Si, and F. Steglich, Nature Phys. 4, 186 (2008).
- Sichelschmidt et al. (2005) J. Sichelschmidt, J. Ferstl, C. Geibel, and F. Steglich, Physica B 359-361, 17 (2005).
- Wykhoff et al. (2007a) J. Wykhoff, J. Sichelschmidt, J. Ferstl, C. Krellner, C. Geibel, F. Steglich, I. Fazlishanov, and H.-A. Krug von Nidda, Physica C 460-462, 686 (2007a).
- Duque et al. (2009) J. G. S. Duque, E. M. Bittar, C. Adriano, C. Giles, L. M. Holanda, R. Lora-Serrano, P. G. Pagliuso, C. Rettori, C. A. Perez, R. Hu, et al., Phys. Rev. B 79, 035122 (2009).
- Barnes (1981) S. E. Barnes, Adv. Phys. 30, 801 (1981).
- Friedemann et al. (2009) S. Friedemann, T. Westerkamp, M. Brando, N. Oeschler, S. Wirth, P. Gegenwart, C. Krellner, C. Geibel, and F. Steglich, Nature Phys. 5, 465 (2009).
- Continentino et al. (1995) M. A. Continentino, B. Elschner, and G. Jakob, Europhys. Lett. 31, 485 (1995).
- Schlott and Elschner (1990) M. Schlott and B. Elschner, Z. Phys. B 78, 451 (1990).
- Goltsev and Abd-Elmeguid (2005) A. Goltsev and M. Abd-Elmeguid, J. Phys.: Cond. Matter 17, S813 (2005).
- Mederle et al. (2002) S. Mederle, R. Borth, C. Geibel, F. Grosche, G. Sparn, O. Trovarelli, and F. Steglich, J. Phys.: Cond. Matter 14, 10731 (2002).
- Tokiwa et al. (2005) Y. Tokiwa, P. Gegenwart, T. Radu, J. Ferstl, G. Sparn, C. Geibel, and F. Steglich, Phys. Rev. Lett. 94, 226402 (2005).
- Trovarelli et al. (2000) O. Trovarelli, C. Geibel, S. Mederle, C. Langhammer, F. M. Grosche, P. Gegenwart, M. Lang, G. Sparn, and F. Steglich, Phys. Rev. Lett. 85, 626 (2000).
- Krellner (2009) C. Krellner, Ph.D., Technische Universität Dresden, Dresden (2009), URL http://nbn-resolving.de/urn:nbn:de:bsz:14-qucosa-24993.
- Klingner (2009) C. Klingner, Diploma thesis, Technische Universität Dresden, Dresden (2009).
- Preusse (1987) N. Preusse, Ph.D., Technische Hochschule Darmstadt, Darmstadt (1987).
- Wykhoff et al. (2007b) J. Wykhoff, J. Sichelschmidt, G. Lapertot, G. Knebel, J. Flouquet, I. I. Fazlishanov, H.-A. Krug von Nidda, C. Krellner, C. Geibel, and F. Steglich, Science Techn. Adv. Mat. 8, 389 (2007b).
- Zakharov et al. (2003) D. Zakharov, D. G. Zverev, and V. V. Izotov, JETP Lett. 78, 402 (2003).
- Plessel et al. (2003) J. Plessel, M. M. Abd-Elmeguid, J. P. Sanchez, G. Knebel, C. Geibel, O. Trovarelli, and F. Steglich, Phys. Rev. B 67, 180403(R) (2003).
- Gegenwart et al. (2006) P. Gegenwart, Y. Tokiwa, T. Westerkamp, F. Weickert, J. Custers, J. Ferstl, C. Krellner, C. Geibel, P. Kerschl, K.-H. Müller, et al., New J. Phys. 8, 171 (2006).
- Klingner et al. (2009) C. Klingner, C. Krellner, and C. Geibel, J. Phys.: Conf. Ser. 200, 012089 (2010).
- Kutuzov et al. (2008) A. Kutuzov, A. Skvortsova, S. Belov, J. Sichelschmidt, J. Wykhoff, I. Eremin, C. Krellner, C. Geibel, and B. Kochelaev, J. Phys.: Cond. Matter 20, 455208 (2008).