Ab-initio description of heterostructural alloys: Thermodynamic and structural properties of MgxZn1-xO and CdxZn1-xO
Abstract
Pseudobinary heterostructural alloys of ZnO with MgO or CdO are studied by composing the system locally of clusters with varying ratio of cations. We investigate fourfold (wurtzite structure) and sixfold (rocksalt structure) coordination of the atoms. By means of density functional theory we study a total number of 256 16-atom clusters divided into 22 classes for the wurtzite structure and 16 classes for the rocksalt structure for each of the alloy systems. The fraction with which each cluster contributes to the alloy is determined for a given temperature and composition within (i) the generalized quasi-chemical approximation, (ii) the model of a strict-regular solution, and (iii) the model of microscopic decomposition. From the cluster fractions we derive conclusions about the miscibility and the critical compositions at which the average crystal structure changes. Thermodynamic properties such as the mixing free energy and the mixing entropy are investigated for the three different statistics. We discuss the consequences of the two different local lattice structures for characteristic atomic distances, cohesive energies, and the alloys’ elasticities. The differences in the properties of MgxZn1-xO and CdxZn1-xO are explained and discussed.
pacs:
61.66.Dk, 64.75.+g, 71.15.NCI Introduction
Recently, ZnO has attracted renewed attention as a closely lattice-matched substrate for GaN and also as a potentially useful active optoelectronic material in its own right Reynolds:1996 ; Reynolds:1997 ; Joseph:1999 ; Ozgur:2004 . When doped with Al it plays a role as a transparent conducting oxide in solar cells Special:2000 , but also microelectronic and sensory devices may be fabricated involving oxides like ZnO Tsukazaki:2007 ; Ramirez:2007 . Further, it is environmentally friendly, biocompatible, and tends to form nanostructures SchmidtMende:2007 .
The tailoring of material properties is an important reason for combining ZnO with other group-II oxides in alloys and heterostructures. Mixed MgxZn1-xO crystals allow to tune the energy gap from about 3.4 eV of wurtzite () ZnO towards the ultraviolet spectral region with at least 4.4 eV in MgxZn1-xO Ohtomo:2005 ; SchmidtR:2003 ; Sadofev:2005 . Conversely, pseudobinary CdxZn1-xO alloys tend to close the gap and are, therefore, suitable candidates for optoelectronic devices in the visible spectral range Sadofev:2006 . Moreover, quantum-well and other heterostructures based on the combinations MgxZn1-xO/ZnO and ZnO/CdxZn1-xO allow an additional tailoring of electronic and optical properties by means of quantum-confinement effects Tsukazaki:2007 ; Sadofev:2006 ; Shigemori:2004 .
The combination of these group-II oxides in alloys and heterostructures raises several fundamental questions, since there is a crystal structure mismatch: While some binary II-VI compounds occur in the fourfold-coordinated structure (e.g. ZnO), others show the sixfold-coordinated rocksalt () structure (e.g. MgO, CdO) under ambient conditions Martienssen:2005 ; Schleife:2006 . Isovalent and isostructural alloys of II-VI constituents are generally thermodynamically unstable, because their mixing enthalpy in either the structure or the structure is positive Sanati:2003 . A thermodynamical miscibility only exists at very high temperatures, i.e., where the mixing entropy is sufficiently large; at lower temperatures there is a tendency for a phase separation of the alloys Segnit:1965 . However, isovalent but heterostructural II-VI alloys seem to be stable under certain conditions: XxZn1-xO alloy films occur in structure for (X = Mg) Bundesmann:2006 ; Liu:2009 ; Du:2009 or (X = Cd, grown under non-equilibrium conditions) Sadofev:2006 ; Shigemori:2004 . Depending on the composition the film preparation may give rise to a non-uniformity of pseudobinary thin films as observed experimentally for MgxZn1-xO Chen:2003 . With increasing molar fractions (Mg or Cd content) a change of the coordination (fourfold to sixfold) of the atoms is expected. Both hexagonal and cubic MgxZn1-xO thin films are reported Chen:2004 . The situation in pseudobinary CdxZn1-xO is less clear. The structure of CdO seems to limit the equilibrium solubility in -ZnO to molar fractions below makino:2001 ; bertram:2006 . On the other hand, metal-organic chemical vapor deposition (MOCVD) techniques produced alloys up to Shigemori:2004 . Molecular beam epitaxy (MBE) leads to epilayers with a structure close to the one without an indication for a phase separation up to a Cd concentration of Sadofev:2006 .
Summarizing, there is no microscopic picture of how the heterostructural aspect influences the properties of isovalent pseudobinary alloys with oxygen as anion. Stability, solubility, and tendency of decomposition of systems such as MgxZn1-xO or CdxZn1-xO are barely understood, so is their different behavior. One reason is that most of the existing theoretical studies are limited to ordered structures such as MgZnO2 Lambrecht:1999 ; Thangavel:1999 or somewhat more complex geometries Sanati:2003 .
On the other hand, the theoretical methods for the description of the thermodynamic and structural properties of pseudobinary alloys of the type AxB1-xC have been developed over the last 20 years. A basic approach is to simulate the configurational average by representing all possible occurring local bonding configurations using certain crystal geometries. There is one study Kim:2001 in which the chemically disordered MgxZn1-xO alloys have been simulated using special quasi-random structures Wei:1990 . In another approach Chen:1995 ; Teles:2000 the mixing free energy of a random alloy is described combining a cluster-expansion method Sanchez:1984 ; Zunger:1994:SDA ; Liu:2008 with the generalized quasi-chemical approximation (GQCA) Sher:1987 . In several publications about pseudobinary alloys with the first-row elements N or O as anions Kim:2001 ; Teles:2000 ; Caetano:2006 , this method has been applied together with an ab-initio description of total energies and atomic geometries. However, in all these studies the (local) crystal structure has been fixed being , , or . Only recently the isovalent but heterostructural MgO-ZnO system has been studied by combining the with the crystal structure within a cluster expansion Sanati:2003 ; Fan:2008 . Energetic stability has been found in the sixfold-coordinated structure for Zn concentrations below 67%, giving rise to spontaneously ordered alloys Sanati:2003 . Without a configurational average and studying only certain clusters with fixed molar fractions Fan:2008 no conclusions are possible for different growth situations. Coherent potential approximation calculations Maznichenko:2009 for various crystal phases allowed for the construction of a phase diagram with a phase transition from to close to . However, the coherent potential approximation, as a single-site theory, is expected to be more reliable close to the binary end components, whereas for intermediate compositions the single-site approximation is questionable.
In this paper we extend the generalized quasi-chemical approach for one local crystal structure to alloys that consist of two binary compounds with two different equilibrium crystal structures, i.e., and . The results of the GQCA are compared to two other cluster statistics, that may be considered as limiting cases of the GQCA with respect to the number of possible atom arrangements. The theory is applied to heterostructural MgxZn1-xO and CdxZn1-xO alloys. In Section II we present a cluster expansion for the crystal structure along with the combined statistics that deals with and clusters simultaneously. The computational approaches that are used for carrying out the actual calculations are explained in Section III. Results for the thermodynamic properties are given in Section IV and for the structural and elastic properties in Section V. Finally, Section VI concludes the paper.
II Alloy Statistics and Thermodynamics
II.1 Cluster expansion for wurtzite and rocksalt structures
We study pseudobinary alloys AxB1-xC with atoms of type C on the anion sublattice and atoms of type A or B on the cation sublattice. Within a cluster expansion method Chen:1995 ; Teles:2000 ; Sanchez:1984 ; Zunger:1994:SDA ; Sher:1987 the macroscopic alloy is divided into an ensemble of clusters consisting of atoms ( anions and cations) each. The total number of cations or anions is then given by .
From combinatorics it follows that, for a given crystal structure, there are different possibilities of arranging A- or B-type atoms on the cation sites of one cluster (the occupation of the anion sublattice is fixed). Due to the symmetry of the crystal lattice, the clusters can be grouped in different classes, with depending on the actual crystal structure. Each class contains clusters of the same total energy , with the degeneracy factors fulfilling the relation .
To each macroscopic alloy one can assign a cluster set which describes how many clusters of each class occur in the alloy. A single class contributes to the macroscopic alloy with its cluster fraction that is defined by . The fulfill the constraint
| (1) |
which stems directly from the relation for the cluster set. The cation sites of each cluster are occupied with atoms of species A and atoms of species B. Since the molar fraction of A atoms for the entire alloy AxB1-xC is fixed by , the cluster fractions have to obey the second constraint
| (2) |
Using such a cluster expansion any macroscopic alloy can be built from the microscopic clusters, each of which contributes with its cluster fraction. Consequently, within this framework each property of the macroscopic system can be traced back to the respective properties of the clusters. Given the weights for an alloy of a certain composition at a temperature and the values of the property for each cluster, one can calculate the property for the alloy using the Connolly-Williams method Connolly:1983 ; Teles:2000 ,
| (3) |
With this approach structural, elastic, and thermodynamic properties, including lattice parameters and bulk moduli can be accessed.
Both the MgxZn1-xO alloy and the CdxZn1-xO alloy consist of two monoxides, which show different equilibrium lattice structures: MgO and CdO crystallize in the cubic phase, while the equilibrium structure of ZnO is the hexagonal phase under ambient conditions. In this work we follow previous argumentations Caetano:2006 ; Zunger:1990 that it is sufficient to include next-nearest-neighbor correlations to capture large parts of the physics involved in the problem. Consequently, we use 16-atom cluster cells (i.e., ) and assume that possible correlations between the different clusters are small.
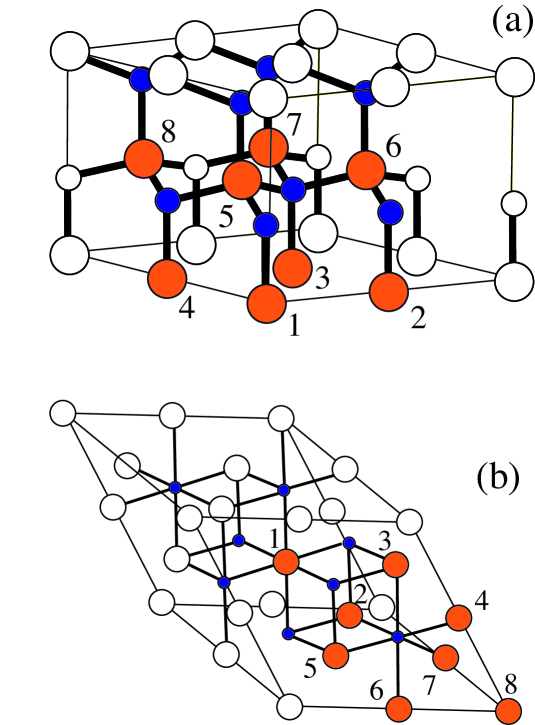
While we rely on the cluster expansion for the structure which is described in Ref. Caetano:2006, , we present a new one for alloys with crystal structure in this work. The corresponding unit cells and the labeling of the cation positions for both types, and clusters, are illustrated in Fig. 1. In Table 1 we give the number of A cations, the degeneracy factors , and one representative of the symmetry-equivalent clusters for each class (characterized by the cation sites that are occupied with A atoms). The degeneracy for each class as well as the total number of classes do not only depend on the number of atoms in the clusters, but also on the actual point group of the crystal. For we obtain 22 classes in the case and 16 classes for the structure (see Table 1). Taking into account the degeneracies a total of 256 clusters per crystal structure are studied for each pseudobinary material system.
| A atoms | A atoms | ||||||
|---|---|---|---|---|---|---|---|
| – | – | ||||||
II.2 Generalized quasi-chemical approximation
In the framework of the generalized quasi-chemical approximation (GQCA), Chen:1995 ; Teles:2000 ; Sanchez:1984 ; Zunger:1994:SDA ; Sher:1987 the cluster fractions are determined by a minimization of the Helmholtz free energy . We restrict the discussion to the mixing contribution to the free energy
| (4) |
The mixing contribution to the internal energy is calculated as the sum over the contributions from the clusters and is referenced to the value of of an alloy consisting only of the two binary end components AC and BC,
| (5) |
Here we introduce the definition of the excess energy for the class ,
| (6) |
For the calculation of the free energy, Eq. (4), or thermodynamic properties derived thereof, an expression for the configurational (or mixing) entropy has to be found. Teles:2000 To evaluate the Boltzmann definition of the entropy, , one has to give an expression for the number of possible configurations . Given a cluster expansion and, therefore, a set of cluster fractions that fulfills the constraints (1) and (2), describes the number of possible atomic configurations in the entire alloy, i.e., counts all possible ways of arranging the A atoms and B atoms for one given set on the cation sites. To determine , the number of ways of arranging the clusters to form the alloy, , has to be multiplied by the number of possibilities to arrange the cations in each cluster. Since one cluster of class can be occupied by cations in ways, all clusters lead to possibilities. Taking into account all classes one ultimately obtains
| (7) |
Using this expression for and the definition one finds for the mixing entropy in the Stirling limit
| (8) |
Introducing the ideal cluster fractions of a strict-regular solution Sher:1987 (see Section II.3),
| (9) |
the mixing entropy can be rewritten into Sher:1987 ; Teles:2000
| (10) |
Although the expressions for according to Eq. (7) and the one derived in Ref. Teles:2000, differ, Eq. (10) shows that they both lead to the same entropy in the Stirling limit.
Equations (5) and (8) fully determine the Helmholtz mixing free energy as a function of and , given that the cluster fractions are known for and . In the GQCA the are determined by the requirement that assumes a minimum with respect to the cluster distribution, i.e., . Hence, the Lagrange formalism with the constraints (1) and (2) yields
| (11) |
whereas . The parameter has to be determined from the condition that the obey the constraint (2). The cluster fractions according to Eq. (11) describe the probability for the occurrence of each cluster class in an alloy which has been prepared under thermodynamic equilibrium conditions that minimize the free energy.
Since we study two cases, isostructural ( or only) as well as heterostructural (combined and ) alloys, we distinguish three situations: (i) clusters only, (ii) clusters only, or (iii) simultaneous occurrence of and clusters. Depending on the clusters included in the calculation, the value for has to be set to , , or (see Table 1) and the minimization of has to be performed for given and accordingly, which leads, via Eq. (11), to the corresponding for each case.
II.3 Strict-regular solution and microscopic decomposition limit
In the literature several techniques for the deposition of MgxZn1-xO films are reported, e.g. pulsed laser deposition (PLD) with growth temperatures of K SchmidtR:2003 , radio frequency magnetron sputtering at K Jeong:2003 , and reactive electron beam evaporation (REBE) at a substrate temperature of K Chen:2003 . Similar techniques have been applied for CdxZn1-xO layers, however, at much lower substrate temperatures, e.g. MBE with a growth temperature as low as K Sadofev:2006 , (plasma-enhanced) MOCVD at a growth temperature of K Shigemori:2004 ; bertram:2006 , or PLD at K makino:2001 . Subsequent repeated temper steps are reported in some cases. The films are typically deposited on -plane (0001) sapphire, but also -plane sapphire or more exotic substrates have been used. Therefore, the respective experimental situation suggests the studying of certain non-equilibrium preparation conditions, for which the actual cluster statistics may be modified by kinetic barriers, frozen high-temperature states, as well as interface or surface influences. In order to simulate a dependence of the cluster distribution on the preparation conditions we study two limiting cases:
(i) The strict-regular solution (SRS) model Sher:1987 . In this case, the ideal cluster fractions according to Eq. (9) are used which arise from a purely stochastic distribution of the clusters. These do neither depend on the temperature nor the clusters’ excess energies but are only determined by and . The number is then simply given by all possible arrangements of A atoms and B atoms on the cation sites of the alloy, i.e.,
| (12) |
In the Stirling limit the mixing entropy in this case reduces to
| (13) |
The ideal according to Eq. (9) and can be interpreted as the high-temperature limit of the GQCA, since for increasing temperatures the approach the and, consequently, [cf. Eq. (8)] approaches .
(ii) The microscopic decomposition model (MDM). In this limiting case the cations of type A (B) are more likely to occur close to cations of type A (B). Consequently, only the clusters representing the two binary components AC and BC are allowed, with being the number of AC clusters and the number of BC clusters. This is equivalent to merely a linear interpolation between the binary end components and, therefore, the results are equal to predictions from Vegard’s rule Vegard:1921 ; Teles:2000 . Furthermore, for positive excess energies [cf. Eq. (6)] the represent the low-temperature limit of the GQCA. The cluster fractions for the MDM are given by
| (14) |
The number of atomic configurations follows immediately from Eq. (7) by taking into account only the two clusters with and , i.e.,
| (15) |
Using the we obtain for the mixing entropy
| (16) |
i.e., a reduced configurational entropy. In the MDM the resulting length scale of decomposition of the alloy into the binary compounds is not well defined as usual in a thermodynamic approach. The minimum length scale is given by the assumed cluster size itself. Whether clusters of the same type (AC or BC) build larger regions of pure AC and BC material on a mesoscopic or macroscopic length scale depends on the cluster interaction (which is not taken into account). In general, the MDM describes alloys that have been prepared under conditions where mixing does not lead to a gain of internal energy. Indeed, in the MDM description one finds from Eq. (5) for the mixing contribution to the internal energy.
III Quantum Mechanical Calculations of Clusters
III.1 Computational methods
The statistical methods introduced in Section II trace the properties of an alloy of composition at temperature back to the corresponding properties of individual clusters using Eq. (3). Therefore, the respective calculations have to be performed for each of the 22 () and 16 () clusters of MgxZn1-xO and CdxZn1-xO.
Ground-state properties, such as the total energy of a cluster or its structural properties, are well described within density functional theory (DFT) Hohenberg:1964:IEG ; Kohn:1965:SCE applying the supercell method, where a cluster is identified with the unit cell of an artificial crystal. Explicit calculations are performed using the Vienna Ab-initio Simulation Package (VASP) Kresse:1996:PRB . For the semi-local generalized-gradient approximation (GGA) to the exchange and correlation (XC) potential in the Kohn-Sham equation Kohn:1965:SCE we rely on the PW91 parametrization as suggested by Perdew and Wang Perdew:1991:ESS ; Perdew:wang:1992 . Although such a semi-local treatment of XC cannot correctly describe excitation properties (such as QP energies or excitonic effects Schleife:2009pss ; Schleife:2009:PRB ), it allows for a very good description of lattice constants and cohesive energies. For the oxides studied in this work, the GGA tends to slightly underestimate binding energies and slightly overestimate lattice constants Schleife:2006 . However, these ground-state properties are not systematically improved by a different treatment of XC, for instance by adding an additional on-site Hubbard interaction Janotti:2006 or a certain amount of Fock exchange Oba:2008 .
The electron-ion interaction is modeled within the projector-augmented wave (PAW) method Blochl:1994:PAW ; Kresse:1999 . We treat the Mg and Mg as well as the O and O electrons as valence electrons. For Zn and Cd, the Zn and Cd states have to be included as valence states, respectively, together with the Zn and Cd electrons. The electronic wave functions are expanded into plane waves up to a cutoff energy of eV and the Brillouin zone (BZ) is sampled by 222 () or 444 () Monkhorst-Pack (MP) pointsMonkhorst:1976 . We checked that these parameters give results for the total energies of the clusters that are converged within 0.08 %. This corresponds to a very small level of inaccuracy, especially since the total energies of the different binary end components differ by at least 10 % of their total energy.
In order to obtain the equilibrium values for the cell volumes, total energies, and bulk moduli we minimize the total energy for several cell volumes and fit the resulting volume dependence of the total energy to the Murnaghan equation of stateMurnaghan:1944 . For each cluster geometry, we compute fully relaxed atomic positions, i.e., optimized lattice constants and internal cell parameters, ensuring that the forces acting on the ions are well below 5 meV/Å.
III.2 Results
To describe the geometry of the two different crystal structures on the same footing we discuss the average cation-cation (second-nearest neighbor) distance . The results for the cluster energies , the cation-cation distances (averaged over all cation-cation distances of one cluster), the lattice parameters of the cluster cell and (averaged over all ’s of one cluster), the cell volumes , and the bulk moduli are listed in Table 2 for all cluster cells and Table 3 for all cluster classes of the crystal structure.
The energies of the clusters in Tables 2 and 3 show an almost linear variation with the number of Mg (Cd) atoms, decreasing (increasing) from pure ZnO to pure MgO (CdO). Small negative (positive) non-linear deviations appear for MgZnO8 (CdZnO8) with absolute values of a few meV (tenths of an eV).
The cation-cation distances show a weak decrease (strong increase) with the number of Mg (Cd) atoms as expected from the corresponding values for the binary end components. While the nearest-neighbor distances or bond lengths (not listed in Tables 2 and 3) of the ZnO-MgO system decrease only very slightly from Å to Å for /, we find a completely different situation for the ZnO-CdO system, where the bond lengths Å are rather different from . For the bulk moduli we observe a decrease with increasing number of Mg or Cd atoms, independent of the crystal structure. This trend follows the behavior of the covalent radii of the cations that also show an anomalous trend of 1.36 Å, 1.25 Å, and 1.48 Å along the row Mg, Zn, and Cd sargent . For our calculated lattice parameters, equilibrium volumes, and bond lengths we find very good agreement with a similar study Fan:2008 . However, the deviations are remarkable for the total energies and, consequently, lead to different results for, e.g., the mixing free energy. We attribute these differences to the use of the local-density approximation (LDA) to XC, and to the neglect of the Zn and Cd electrons as valence electrons in Ref. Fan:2008, .
| class | ||||||
| (eV/pair) | (Å) | (Å) | (Å3) | (GPa) | ||
| class | ||||
| (eV/pair) | (Å) | (Å3) | (GPa) | |
IV Thermodynamic properties
By including the temperature-dependent mixing entropy we also obtain a temperature dependence of the cluster fractions and, therefore, of the derived properties. In this work we discuss the alloy properties at two selected temperatures, (i) room temperature ( K) where many measurements are performed, and (ii) an exemplary growth temperature of K.
IV.1 Excess energies
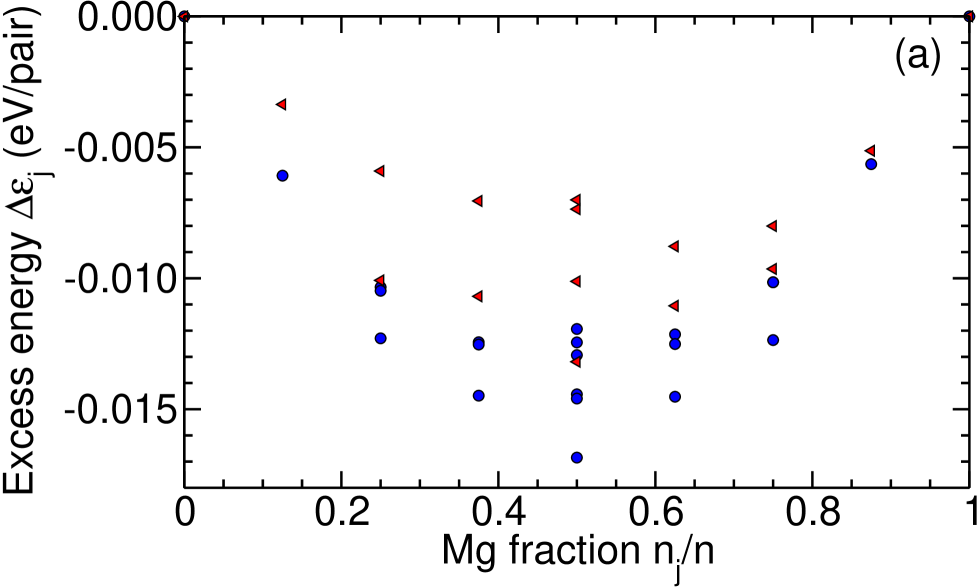
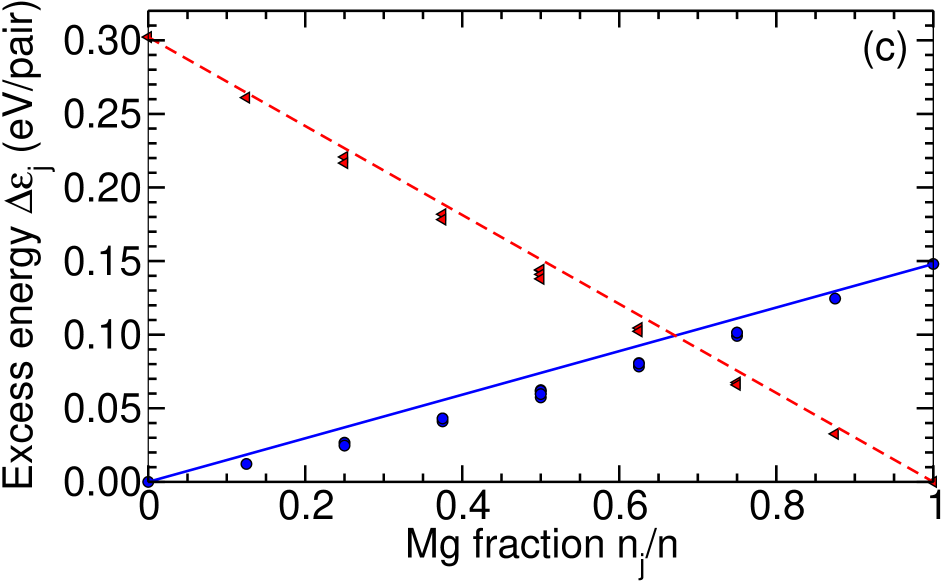
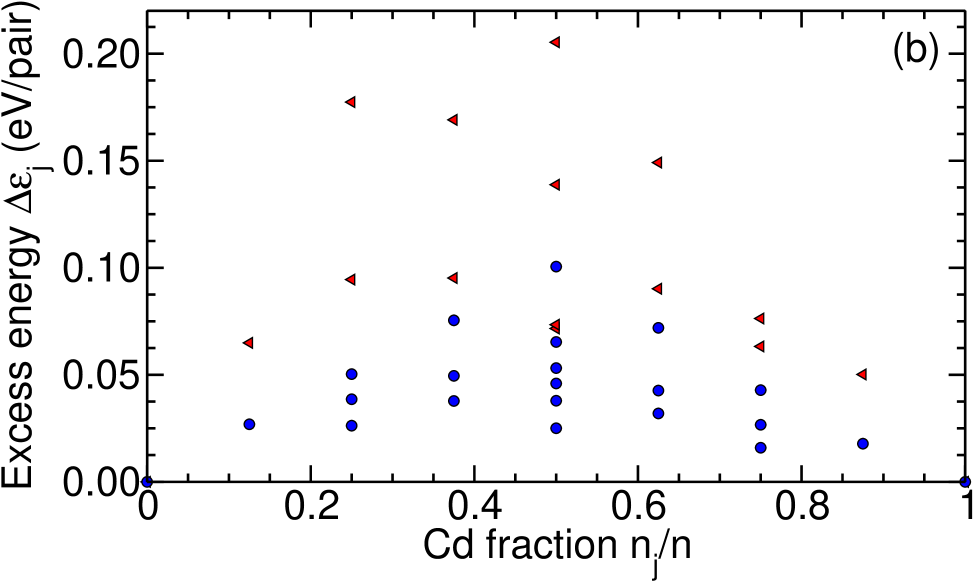
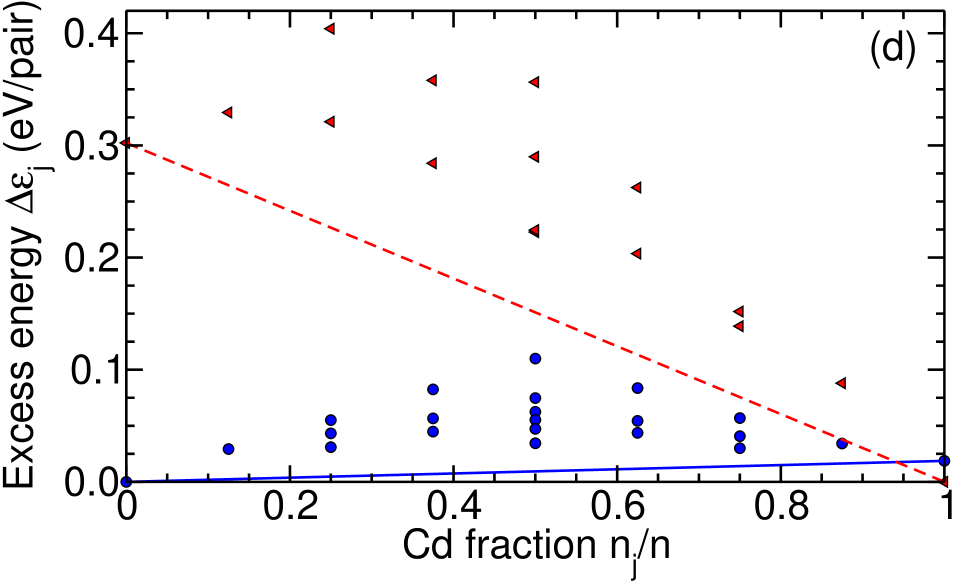
The excess energy [cf. Eq. (6)] represents the energy of formation of a certain XZnOn cluster in the or structure with respect to ZnO and XO (X = Mg, Cd) in the respective crystal structure. They are fundamental quantities for the GQCA, since they ultimately determine the cluster fractions [see Eq. (11)] and, therefore, the alloy statistics. In Fig. 2 the excess energies are plotted for both material combinations, i.e. ZnO-MgO and ZnO-CdO. Whereas in Figs. 2(a) and (b) the for and structure are shown, we visualize the energetic difference of these two lattice structures by plotting the using the value of for -ZnO and for -XO in Figs. 2(c) and (d).
For MgZnO clusters [cf. Fig. 2(a)] we find negative excess energies (per anion-cation pair) with absolute values of less than 20 meV for both crystal structures. Contrary, for CdZnO clusters [cf. Fig. 2(b)] the excess energies are positive for both polymorphs and by one order of magnitude larger than the ones for MgZnO. As a consequence, in the isostructural limit with only a fourfold () or a sixfold () coordinated bonding configuration, we predict that mixing is possible for the ZnO-MgO system independent of the composition , temperature , and the boundary condition that fixes the cluster fractions. In the case of the ZnO-CdO system with its large difference of the bond lengths / and, hence, a remarkable strain of a bond in the environment of the other cation species, the situation is different and will be discussed in detail in Section IV.3.
Due to the changed reference energy of the excess energies in Fig. 2(c) and their small absolute values in the case of ZnO-MgO, we find an almost linear variation between the end points. The crossing point near indicates that for small Mg fractions the fourfold coordination is more stable while for larger Mg fractions the sixfold one seems to be energetically favored. This is in agreement with the occurrence of the cubic crystal structure above a composition of in PLD samples Bundesmann:2006 . However, there are also experimental Chen:2003 or other theoretical results Maznichenko:2009 ; Sanati:2003 ; Fan:2008 contradicting our findings. More precisely, Refs. Sanati:2003, ; Fan:2008, find for -ZnO and -ZnO almost the same energy difference as we do for -MgO and -MgO and vice versa. There are strong indications that the use of the LDA instead of the GGA can cause such deviations of the total energy differences. Our presumption is supported by a comparison to other GGA calculations that confirm our result of 0.3 eV as the energy difference between -ZnO and -ZnO as well as the 0.15 eV between -MgO and -MgO Zhang:2007:APL ; Carrasco:2007 . LDA values that have been reported seem to lead to opposite differences for MgO and ZnO Fan:2008 ; Sanati:2003 ; Seko:2005 ; Limpijumnong:2004 ; Maznichenko:2009 . In addition, Fan et al.Fan:2008 do not include the electrons of Zn or Cd in their calculations which may further influence the - splittings.
We observe a different situation for the ZnO-CdO system [cf. Fig. 2(d)], since the absolute values of the excess energies are comparable to the energy differences of the and polymorphs. Consequently, the deviations from the linear interpolation between the end components are much larger. Furthermore, the and polymorphs of CdO are energetically much closer to each other than the corresponding ZnO polymorphs. Merely plotting the excess energies [see Fig. 2(d)] suggests a wide range up to for the stability of which contradicts the majority of experiments makino:2001 ; bertram:2006 ; Sadofev:2006 ; Shigemori:2004 ; Ishihara:2006 . Taking the cluster statistics into account we discuss this issue in more detail later [cf. Sections IV.3 and IV.4].
IV.2 Internal energy and entropy
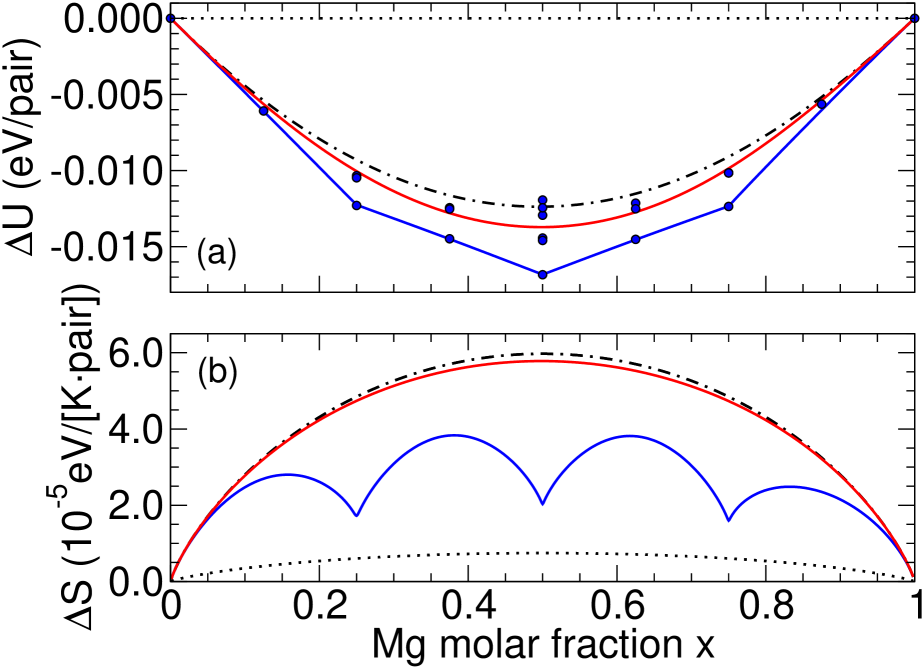
For a general discussion of the thermodynamic trends resulting from the three different statistics we compare the contributions [Eq. (5)] and [Eq. (10)] to the mixing free energy as calculated from the GQCA with results obtained using the ideal weights, and the weights from the MDM for -MgxZn1-xO.
From the mixing contribution to the internal energy of -MgxZn1-xO it can be seen [cf. Fig. 3(a)] that for low temperatures ( K) only the clusters with the lowest energies contribute in the GQCA. For higher temperatures ( K) the weights of clusters with higher excess energies are larger. The SRS model finally represents the high-temperature limit of the GQCA in which all clusters contribute. The MDM does not lower the internal energy of the system.
In Fig. 3(b) the corresponding results for the mixing entropy are shown. Again, the MDM is the most trivial case with the smallest entropy term, since only two clusters contribute. The SRS model is obviously maximizing the entropy which is consistent with what we expect from a high-temperature limit, i.e., the high-temperature curve of the GQCA approaches the SRS limit. The low-temperature curve of the GQCA shows an interesting behavior, since the entropy in this case clearly features pronounced minima for compositions where only single clusters substantially contribute.
IV.3 Mixing free energy
The Gibbs free energy is the thermodynamic potential which describes the equilibrium of a system for fixed temperature and pressure. At low pressures of about 1 atmosphere the difference between the Gibbs free energy and the Helmholtz free energy vanishes. Therefore, the Helmholtz mixing free energy is used as the central thermodynamic quantity that governs, at least for solids and low pressures, the equilibrium alloy state and, therefore, the cluster fractions .
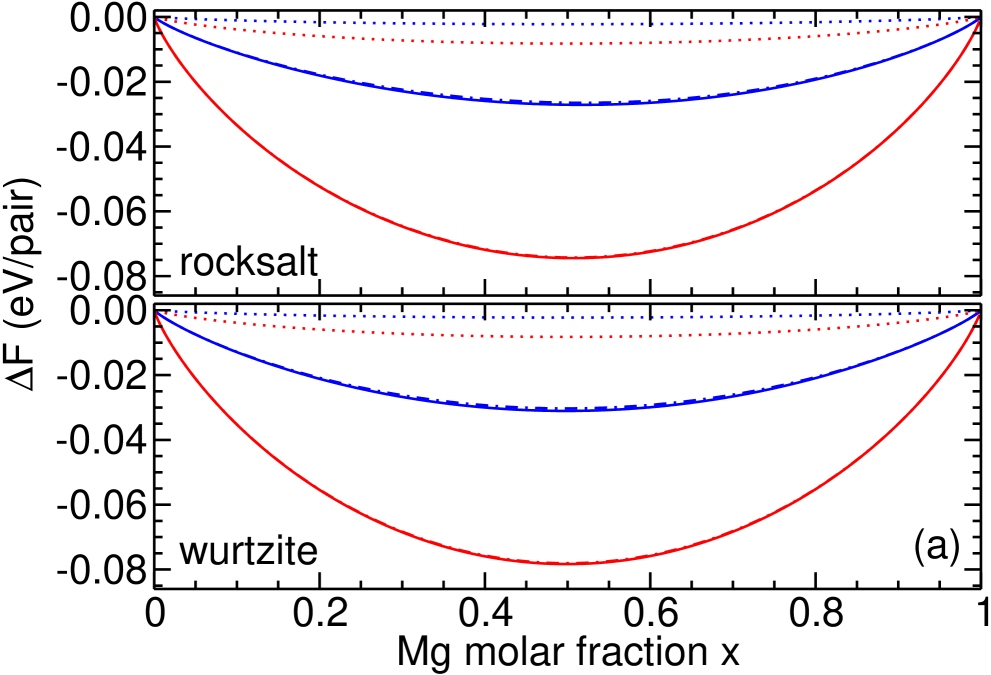
In Fig. 4 the mixing free energy for MgxZn1-xO and CdxZn1-xO alloys in the and the crystal structures is plotted versus composition . For MgxZn1-xO it is obvious that for all and , which is, according to Eqs. (4) and (5), a direct consequence of the negative excess energies for MgZnOn clusters [cf. Fig. 2(a)]. For that reason all three statistics agree in predicting - and -MgxZn1-xO to be a random alloy without a miscibility gap Sher:1987 , independent of and . There is no tendency for binodal or spinodal decomposition of the alloy. The results using the GQCA cluster weights and the ones from the SRS model are almost identical, while the energy gain is smaller within the MDM.
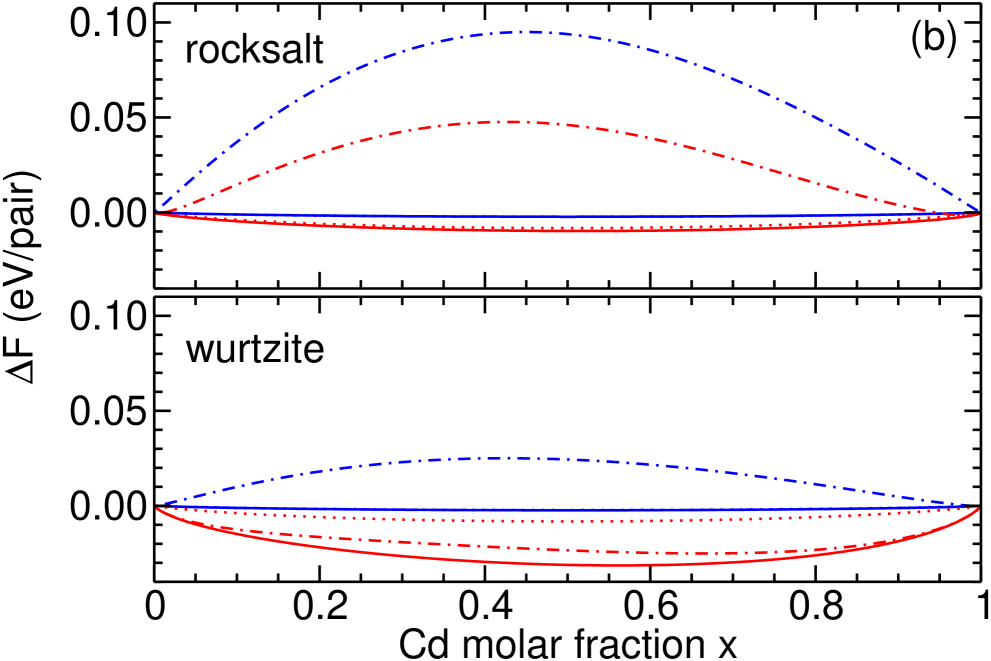
For CdxZn1-xO the behavior of is qualitatively different as can be seen from Fig. 4(b). It shows that for K and both crystal structures the GQCA results agree very well with the MDM, i.e., we find the alloy being almost entirely decomposed into the binary clusters. For the higher temperature of K the GQCA result approaches the SRS curve for the wurtzitic alloy, especially for and . However, for -CdxZn1-xO at K the GQCA curve still agrees with the MDM. In this case the system has a strong tendency for decomposition into the binary materials and the SRS limit can only be reached at very high temperatures. Besides, for CdxZn1-xO the curves versus are rather asymmetric for the SRS and show minima and inflection points with positions that strongly depend on the temperature and the local crystal structure. This is an indication of a phase transition between random and phase-separated alloys and will be discussed as such later.
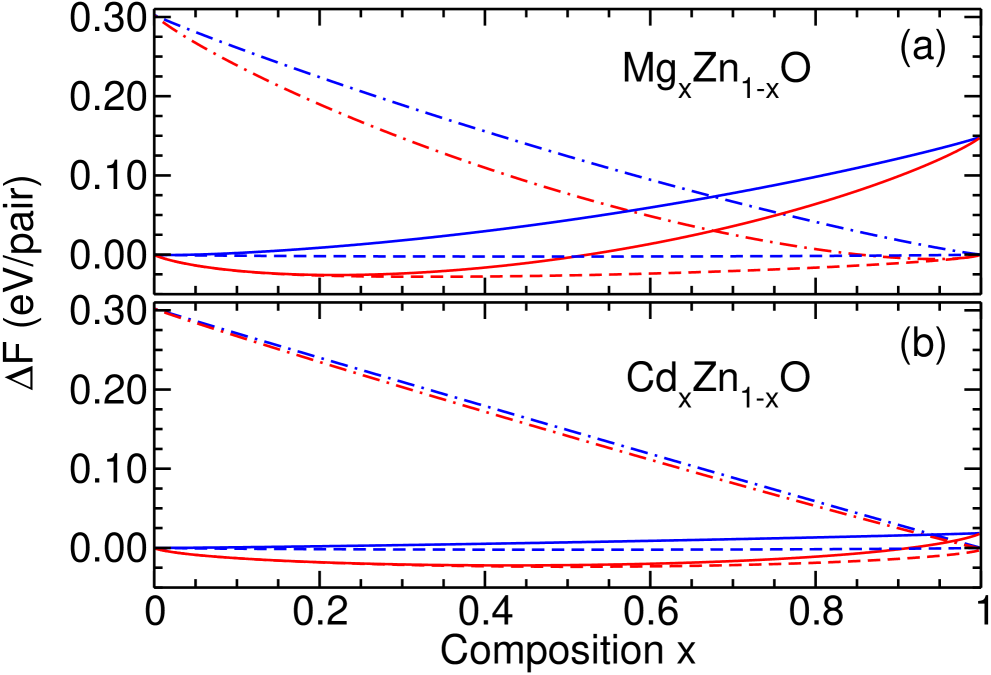
In the following, we compare to free energy curves that are computed using the energies of the respective equilibrium crystal structures (-MgO, -ZnO, -CdO) as level of reference, in contrast to the results in Fig. 4 where the energies of the binary components in the same crystal structure have been used. For MgxZn1-xO the mixing free energy curves for the alloys and the alloys in Fig. 5(a) intersect at , independent of the temperature. We interpret this as a tendency for a transition from preferred fourfold coordination () to preferred sixfold coordination () at that composition under equilibrium conditions. In addition, the difference of the mixing free energy per cluster of the heterostructural alloys and that of the respective isostructural cases exceeds meV, i.e. at room temperature, for approximately () at K ( K). The additional degree of freedom of varying also the atomic coordination leads to the lowest mixing free energy [see Fig. 5(a)]. Hence, for these values of both, as well as clusters, significantly contribute to the alloy material.
The same tendencies have been observed in experimental studies. Minemoto et al. Minemoto:2000 (Vashaei et al. Vashaei:2005 ) found predominantly structure below () and mainly structure for (). Ohtomo et al. Ohtomo:1998 report on the occurrence of an impurity phase above Mg concentrations of which roughly coincides with the point in Fig. 5(a) where the high-temperature curve for structure starts to deviate from the curve for the mixed statistics. Also the X-ray diffraction measurements of thin-film samples by Bundesmann et al. Bundesmann:2006 reveal hexagonal structure for and cubic structure for . Films grown by reactive electron beam evaporationChen:2003 lead to hexagonal MgxZn1-xO up to and to cubic MgxZn1-xO above . In general, the amount of fourfold- or sixfold-coordinated atoms cannot be directly derived from the mixing free energy and will be discussed in more detail in Section IV.4.
In the case of the CdxZn1-xO alloys, we study the mixing free energy in Fig. 5(b) where we observe a crossing of the curves for the isostructural alloys roughly at a Cd content of . Moreover, we find that the result from the mixed statistics differs less than meV (per cluster) from the curve for the pure structure up to compositions of about () for K ( K). The reason for that behavior is the small energy difference between the -CdO and the -CdO phase Schleife:2006 (see Tables 2 and 3).
Experimental studies of CdxZn1-xO show an ambivalent picture: While two groups report very low thermodynamic solubility limits makino:2001 of only or phase separation at even lower Cd concentrations bertram:2006 , another group observed Cd concentrations up to in samples produced by means of highly non-equilibrium MBE Sadofev:2006 . Unfortunately, they have not tried for higher concentrations. More importantly, the crystal structure has also been found for plasma-enhanced MOCVD layers Shigemori:2004 up to . Their result is confirmed by Ishihara et al. Ishihara:2006 who report a transition from to structure at for films deposited by MOCVD. Apparently, the change of the crystal structure occurs at lower Cd concentrations than we predicted from the intersection of the curves for and in Fig. 5(b). On the other hand, the high-temperature curve from the mixed statistics shows significant deviations from the pure statistics above Cd contents of about 0.7 which may explain the experimental findings Ishihara:2006 .
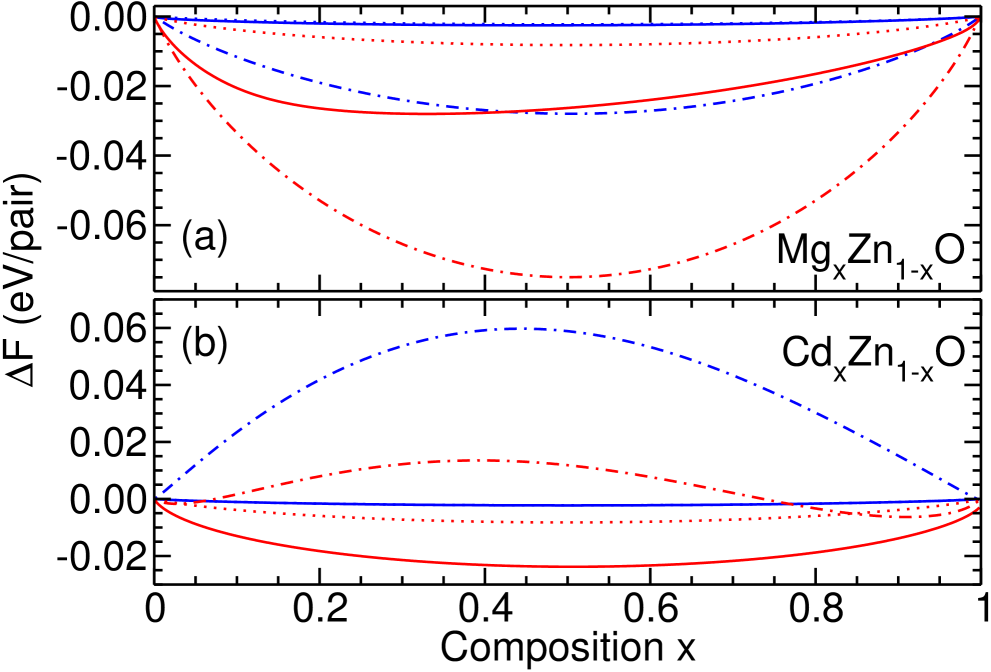
For a detailed discussion of the mixed statistics we present in Fig. 6 the results for the mixing free energy obtained from the statistics with and clusters. In this plot we use again the equilibrium crystal structures for each material as level of reference for the mixing free energies at and . Since the ideal cluster fractions according to Eq. (9) do not depend on the cluster energies, both the sum of the for all clusters and also of all clusters give the same total weight of 0.5. Consequently, at and clusters of both crystal structures contribute equally, albeit, we want to take this situation into account due to possible non-equilibrium growth conditions. Therefore, we set the mixing free energies at and to zero for each curve resulting from the SRS model in Fig. 6 since otherwise, and hold for temperatures K due to the weights of the SRS model.
First of all, Fig. 6 points out that the GQCA and the MDM coincide for both materials at low temperatures. Contrary, the SRS model and the GQCA result in a remarkable difference independent of the temperature. This is not surprising, since the SRS model neglects the large energetic differences between the two crystal structures by merely assigning the ideal weights to the clusters. While we find for MgxZn1-xO, which shows negative excess energies, that the ideal cluster fractions are energetically favored over the ones resulting from GQCA or the MDM [cf. Fig. 6(a)], the opposite is true for CdxZn1-xO [cf. Fig. 6(b)], where the excess energies are positive.
IV.4 Phase transitions and phase diagram
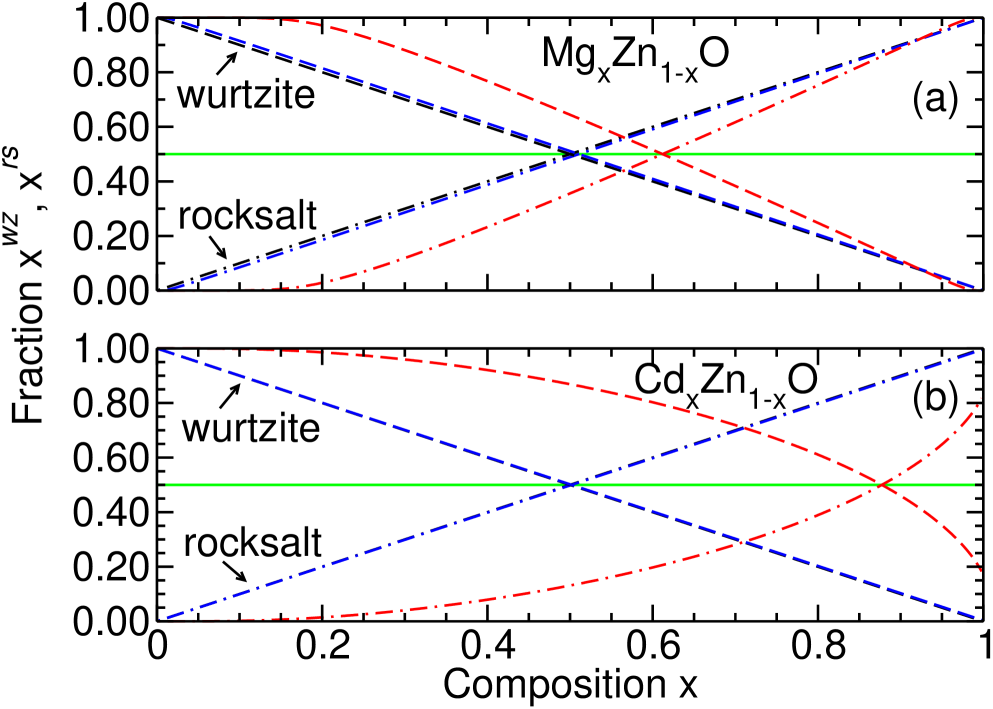
For a better understanding of the structural composition of the alloys as a function of and we calculate the contributions of and clusters to the mixed statistics results. For that purpose we define the character and the character of the alloy as the sum over the corresponding weights, i.e.,
| (17) |
with . For given composition , temperature , and statistical model () measures the relative contribution of clusters with fourfold (sixfold) atomic coordination to the studied (non-decomposed) XxZn1-xO sample (X = Mg,Cd). The results for and as a function of and are shown for both pseudobinary materials in Fig. 7. This figure clarifies how the dominating crystal structure in the alloy depends on the thermodynamic conditions as well as the respective cluster statistics (GQCA, SRS, MDM). As discussed before, the SRS model for the cluster fractions gives rise to equal contributions of and clusters (see Fig. 7). We confirm our discussion of the results for the mixing free energy by finding the GQCA curves close to the MDM results for both materials at room temperature. As expected, higher preparation temperatures tend to move the intersection to larger Mg or Cd molar fractions . More specifically, we find that point at about ( K) and ( K) for MgxZn1-xO, while the temperature dependence is more pronounced for CdxZn1-xO where the intersection for K occurs at about . Consequently, the local crystal structure and bonding configuration of the CdxZn1-xO alloy depends much more on the actual growing conditions which explains the ambivalent experimental findings for that material system.makino:2001 ; bertram:2006 ; Sadofev:2006 ; Shigemori:2004 ; Ishihara:2006
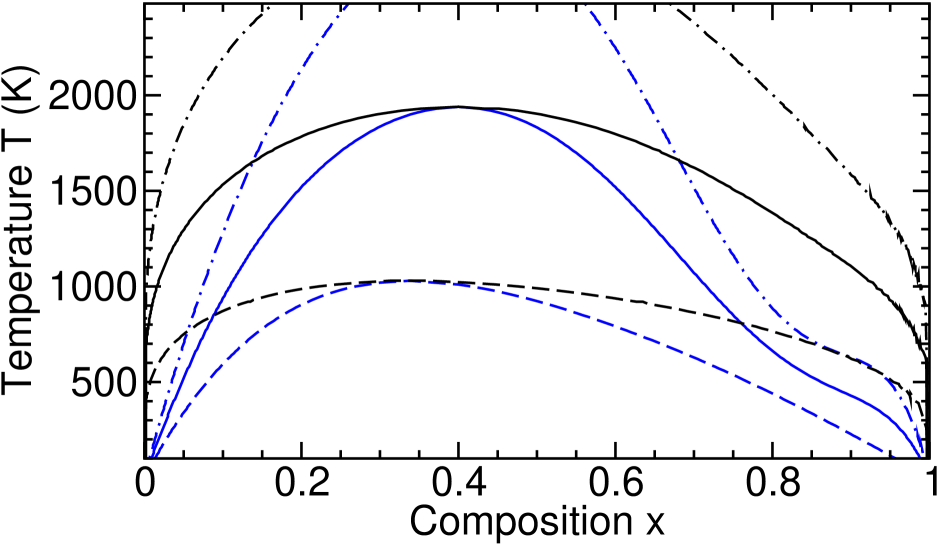
As discussed before, the occurrence of two pronounced minima as well as inflection points in the curve for the mixing free energy of CdxZn1-xO obtained from the SRS model (cf. Fig. 6) is an indication for a possible phase separation.Chen:1995 Due to its negative excess energies [cf. Fig. 2(a)] the MgxZn1-xO alloy does not show such a behavior. To study the consequences we construct the common tangent line to the free energy curves obtained from the SRS model for CdxZn1-xO alloys at several . The resulting tangent points and describe the boundaries of the miscibility gap and their variation with the temperature defines the binodal line in the - phase diagram shown in Fig. 8. From the maximum of the resulting - curves we find the critical parameters K and for the statistics as well as K and for the mixed statistics. For the pure statistics the critical temperature is larger than 2500 K. Inside the miscibility gap the alloy consists of a mixture of CdZnO and CdZnO with the mixing free energy
| (18) |
which is lower than .
Furthermore, the two inflection points and
of the curve from the SRS
model for CdxZn1-xO [cf. Fig. 6(b)] define
the spinodal curve in the phase diagram in
Fig. 8. Inside the intervals and
the alloy is metastable against local decomposition due
to an energy barrier. Contrary, spontaneous decomposition into two
alloys with compositions and happens within the interval
.Chen:1995
The actual
distribution of the clusters depends via and
on the composition and temperature
(cf. Fig. 8).
The phase diagram in Fig. 8 suggests the
speculation that the low solubilities of -CdO in
-ZnO makino:2001 ; bertram:2006 can be explained within the
SRS model. For alloy preparation conditions that lead to a
stochastic occupation of the cation lattice sites,
Fig. 8 confirms a large miscibility gap starting
at at K ( clusters only), K ( and clusters), or K ( clusters
only).
IV.5 Cohesive energies
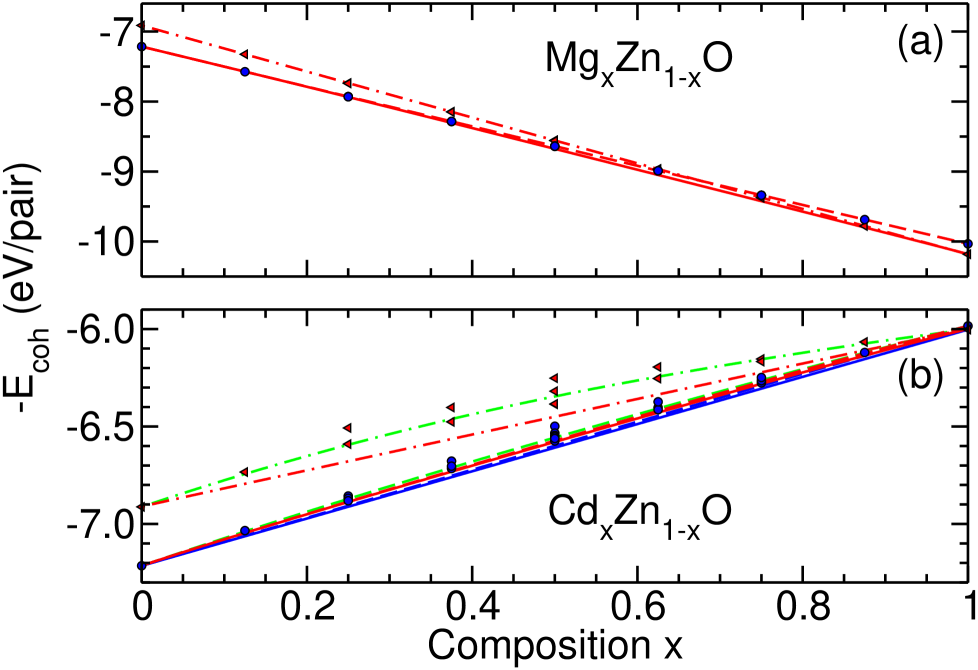
From the cluster energies as given in Tables 2 and 3 we compute the cohesive energies (per cation-anion pair) by subtracting the total energies of the spin-polarized atoms, , , , and , from the ground state energy of the th cluster, i.e.,
| (19) |
with X = Mg, Cd. For the binary end components this leads to cohesive energies of eV (-MgO), 7.21 eV (-ZnO), and 6.00 eV (-CdO) which are close to experimental values of 10.26 eV, 7.52 eV, and 6.40 eV (see compilation in Ref. Schleife:2006, ). In Fig. 9 the averaged cohesive energies [cf. Eq. (3)] per cation-anion pair, as computed using the cluster weights from the different statistics, are plotted for MgxZn1-xO and CdxZn1-xO alloys versus composition . From Fig. 9(a) it immediately becomes clear that for MgxZn1-xO the variation of the cohesive energy with the alloy composition is almost linear. This is due to the fact that the variation between the different crystal structures as well as the variation of the excess energies with for fixed crystal structure (cf. Fig. 2) both are small compared to the large difference of between ZnO and MgO. For that reason also the temperature variation of the GQCA results is not visible. Overall, neither for the nor the crystal structure there is a visible dependence on the actual statistics that has been used.
For CdxZn1-xO we find from Fig. 9(b) that the results within the GQCA and the SRS model differ. The curves from the MDM cannot be distinguished from the low-temperature GQCA results. For the crystal structure deviations resulting from the different statistics are small but visible. As discussed before, the mixed statistics gives rise to results that are close to those obtained when taking only clusters into account.
V Structural and elastic properties
V.1 Fourfold bonding coordination
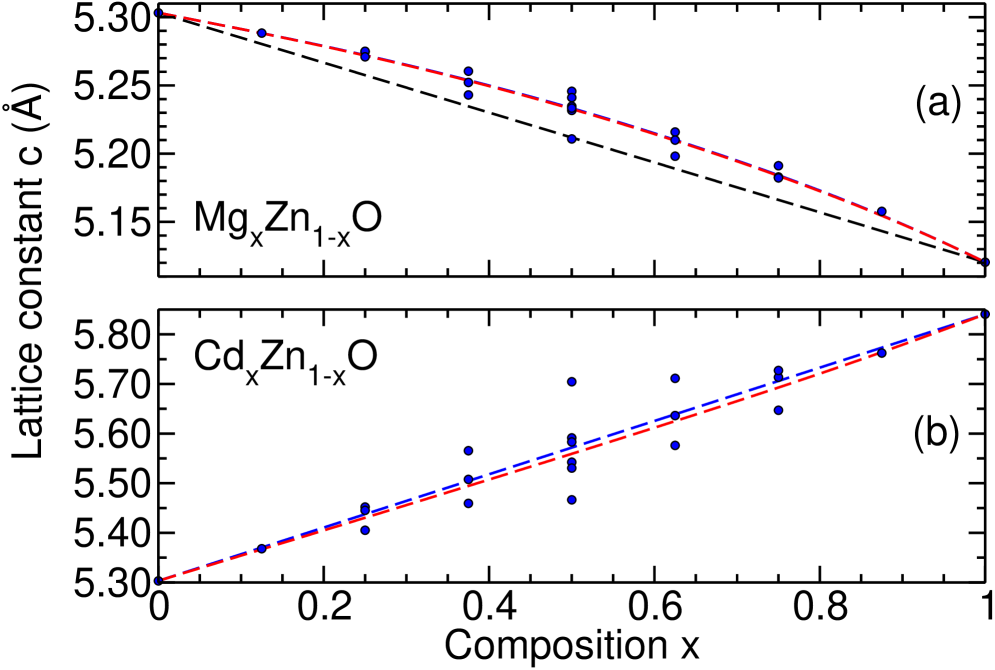
In Section IV we found that especially for the CdxZn1-xO system a significant fraction of the alloy locally shows the crystal structure over a large composition range. For that reason we investigate the behavior of the lattice constant and the parameter as characteristic parameters of the structure.
Figure 10(a) shows that in the case of MgxZn1-xO the results from the GQCA for both temperatures and the curve obtained using the ideal cluster fractions almost coincide. The two statistics give rise to slightly larger values for than the MDM and, therefore, also Vegard’s law, which we find to be violated. Around the deviation may reach values of about 0.5 %. As can be seen in Fig. 10(a) this leads to large errors when the composition of an alloy is determined by measuring the -lattice constant and applying Vegard’s rule.
Contrary, for CdxZn1-xO [cf. Fig. 10(b)] the curves computed with the GQCA cluster fractions for high and low temperatures represent the two limiting cases. While the low-temperature curve coincides with the MDM, the high-temperature curve is close to the results from the SRS model and the deviations between the two cases are small.
A comparison of the values for the individual clusters of both material systems shows that the variation is much larger for CdZnOn than for MgZnOn. Overall, the deviations from the MDM (which is equivalent to Vegard’s law) are larger for MgxZn1-xO and we find a remarkable bowing of the curves which renders a purely linear interpolation questionable. Contrary, the bowing is smaller for CdxZn1-xO despite the stronger deviations for individual clusters, e.g., with , , or Cd atoms.
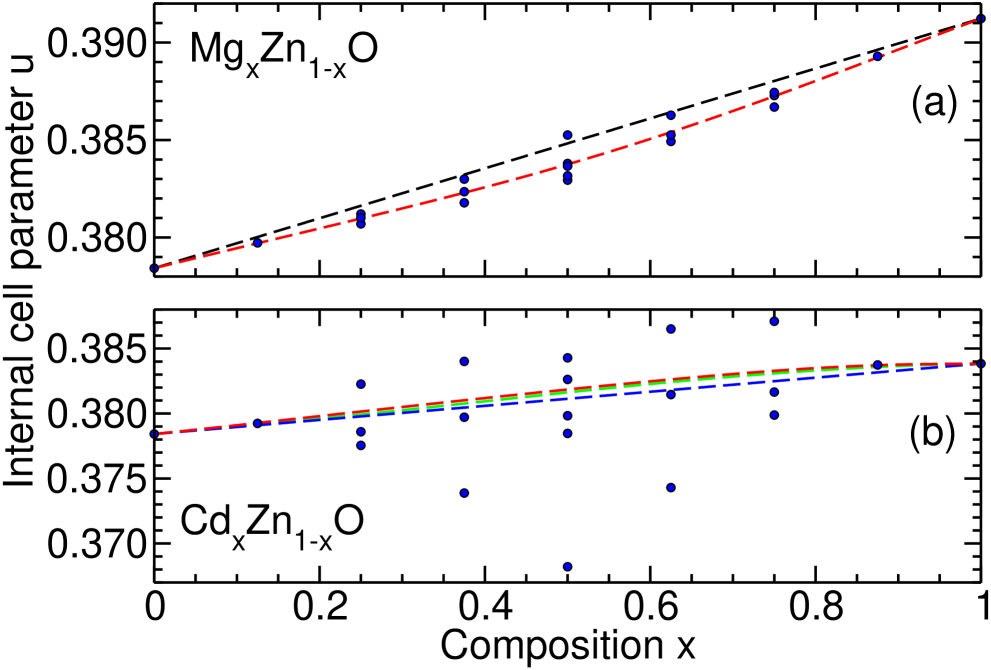
In Fig. 11 we also study the influence of the cluster statistics on the internal cell parameter of the hexagonal lattice, which describes the translation of the cation sublattice with respect to the anion sublattice along the direction. Again, for MgxZn1-xO there is a noticeable deviation of all statistics (that are almost equal) from the MDM result, with a remarkable bowing of the curves. The values of the individual clusters show a larger scattering for CdZnOn than for MgZnOn. In the case of CdxZn1-xO again the low-temperature GQCA curve coincides with the MDM result, while the high-temperature GQCA curve is close to the one obtained using ideal cluster fractions.
V.2 Cation-cation distance
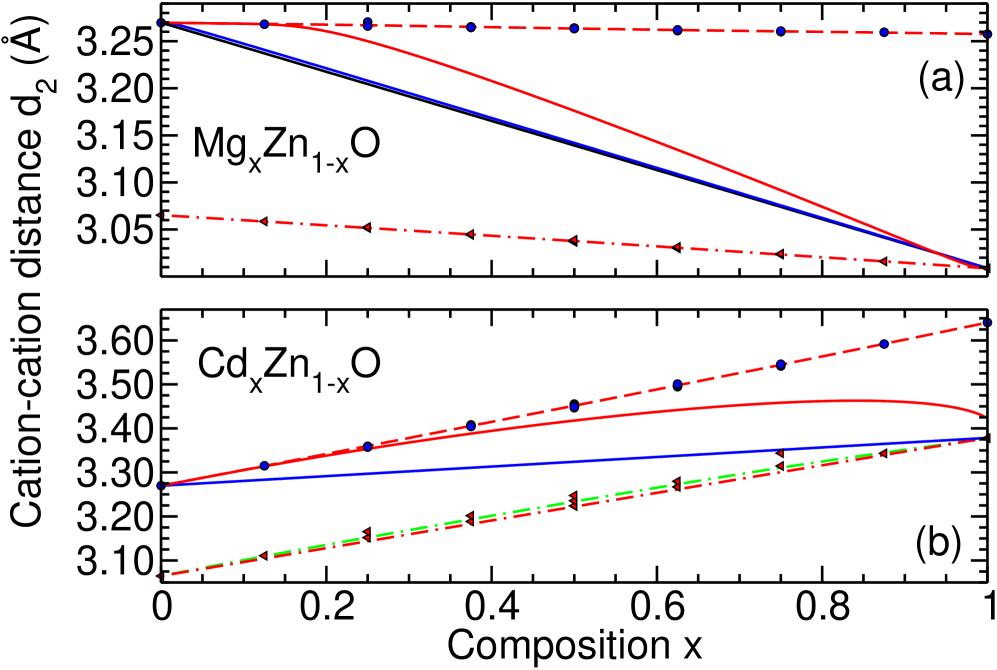
Both crystal structures that are taken into account to describe the pseudobinary alloy system, and , are characterized by different lattice parameters. While the cubic structure is described by only one lattice constant , there are three independent parameters , , and for the hexagonal structure which renders a universal description of the lattice structure of the alloys more difficult. As mentioned before, we solve this problem by restricting our discussion to the average cation-cation distance . This quantity can be defined in a unique manner even for different crystal structures and is experimentally accessible at the same time. For the lattice is simply related to the lattice constant by and for the ideal lattice with it holds . We average over all cation-cation distances in one cluster to obtain the (cf. Tables 2 and 3). Using the respective weights from the GQCA, the SRS model, and the MDM, the configurational average is calculated from Eq. (3) and the results are plotted in Fig. 12 for MgxZn1-xO and CdxZn1-xO.
For MgxZn1-xO [cf. Fig. 12(a)] we find for the pure and pure cluster geometries that the three alloy statistics give almost the same results and, therefore, also agree well with Vegard’s rule. For each fixed crystal structure the variation of versus is small, whereas differs up to 8 % between the and the structure of a material. While the GQCA results from the mixed statistics agrees well with the MDM for K, we find significant deviations for K. In the high-temperature case the cation-cation distance in the pseudobinary alloy remains very close to the value of the pure structure up to compositions of about [cf. Fig. 12(a)]. For higher Mg contents approaches the value of -MgO.
For CdxZn1-xO [cf. Fig. 12(b)] the variation of is much larger than for MgxZn1-xO since the cation-cation distance varies much more between ZnO and CdO. The results from all three statistics for the pure clusters and the pure clusters agree well with Vegard’s rule except of a small deviation for the SRS model for -CdO. Again the most remarkable change is observed for the mixed cluster expansion. At room temperature the curve connects the and end components almost linearly. For the higher temperature of K the cation-cation distance closely follows the trend up to Cd concentrations of more than . Overall, the different structural configurations can be clearly distinguished at fixed via the average cation-cation distance. When both lattice structures can occur in the alloy we even find a more pronounced temperature dependence.
V.3 Bulk modulus
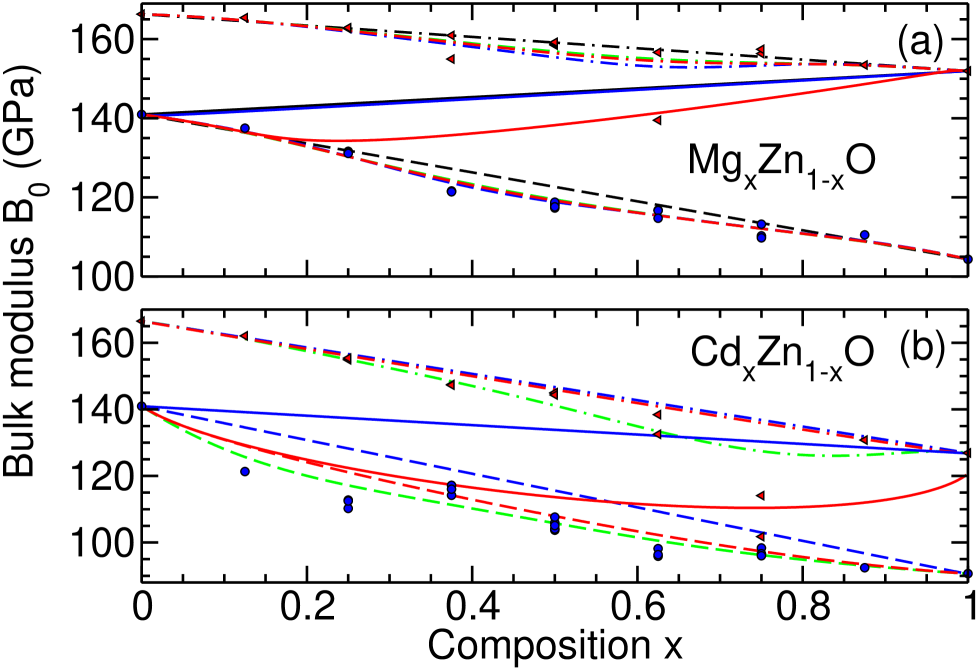
Besides the cation-cation distance we also study the bulk modulus for MgxZn1-xO and CdxZn1-xO using the three statistics evolving from the cluster weights of the GQCA, the SRS model, and the MDM. The results are plotted together with the values for the individual clusters in Fig. 13.
For MgxZn1-xO [cf. Fig. 13(a)] in the pure or structure the GQCA results show a temperature dependence and also differ from the linear interpolation of the MDM, whereas the SRS curve is very close to the high-temperature result of the GQCA. The reason for this behavior is the stronger deviation of the bulk moduli for the individual clusters from the linear interpolation. As can be seen in Fig. 13(a) for the structure we find a certain cluster with an especially low bulk modulus at which, therefore, coincides with the minimum of the GQCA curves. For the GQCA results using the mixed statistics we find a strong temperature dependence, since the room-temperature curve closely follows the MDM curve, while the high-temperature result matches the pure curve up to and then approaches the pure curve at .
In the case of CdxZn1-xO [see Fig. 13(b)] we find both GQCA curves for the pure lattice structure close to the MDM result. This is only true for the low-temperature result of the pure structure, whereas the high-temperature curve differs remarkably in this case. For both and structure, the SRS model shows the largest deviation from the linear interpolation. Again this can be attributed to the stronger variation of the values for of the individual clusters with respect to the MDM curve with the strongest deviation occurring for at [cf. Fig. 13(b)]. For the mixed statistics for CdxZn1-xO we find again that the low-temperature curve closely follows the linear interpolation, while the high-temperature curve shows pronounced deviations. At low concentrations it follows the high-temperature GQCA curve of the pure structure and does not even fully approach the limit due to the very small energetical difference of these two polymorphs for CdO (cf. Fig. 7).
VI Summary and conclusions
In summary, we studied pseudobinary AxB1-xC alloys whose binary end components crystallize in different crystal structures under ambient conditions. To study MgxZn1-xO and CdxZn1-xO with (MgO, CdO) and (ZnO) equilibrium lattice structures we adopted the cluster expansion for and presented a corresponding expansion for 16-atom clusters. To include simultaneously locally different bonding configurations with either fourfold () or sixfold () coordination the GQCA has been extended correspondingly. Besides the GQCA which minimizes the mixing free energy with respect to the cluster fractions we took two other distributions into account to simulate also certain non-equilibrium growth procedures. We have combined these methods with ab initio density functional calculations using the semi-local GGA to treat exchange and correlation. This provides knowledge of structural and energetic properties for each of the clusters which we use together with the cluster fractions to perform the configurational averages and, hence, to derive an averaged alloy property for given composition and temperature.
Correspondingly, we find that the alloys’ thermodynamics is determined by the local chemical bonding and the cluster statistics and, therefore, the conditions under which the alloy is prepared. The mixing free energies indicate a change from preferred crystal structure to preferred crystal structure at about for MgxZn1-xO and about for CdxZn1-xO. We find that for MgxZn1-xO as well as CdxZn1-xO the random alloy is always the most favorable. Only for CdxZn1-xO in the SRS limit we observe the occurrence of a miscibility gap and binodal as well as spinodal decomposition ranges with the critical parameters K and for pure structure, K and for the mixed statistics, and a critical temperature above 2500 K for pure crystal structure. In any case we were able to calculate even the temperature- and composition-dependent amount of and clusters in the system. The resulting ambivalent picture which is strongly dependent on the actual conditions, is verified by a variety of experimental results. For both material systems there are experiments that agree with our predictions but also other experiments with deviating findings, showing that also measured properties of alloy films have to be related to growth conditions, deposition method, possible subsequent temper steps, etc.
For structural properties such as cation-cation distances and bulk moduli we also find a significant dependence on the statistics that has been employed for the alloy modeling. In addition, the pronounced temperature dependence of the structural parameters and also the boundary conditions due to the growth mechanism should lead to distinct experimental observations of the alloy composition.
Acknowledgments
We thank Lara K. Teles and R. Goldhahn for valuable discussions. The research leading to these results has received funding from the European Community’s Seventh Framework Programme (FP7/2007-2013) under grant agreement No. 211956 and by the Deutsche Forschungsgemeinschaft (Project No. Be 1346/20-1). We acknowledge grants of computer time from the Supercomputerzentrum Stuttgart and the HPC-EUROPA2 project (project number: 228398) with the support of the European Commission – Capacities Area – Research Infrastructures. A. Schleife thanks the Carl-Zeiss-Stiftung for support.
References
- (1) D. C. Reynolds, D. C. Look, and B. Jogai, Solid State Commun. 99, 873 (1996)
- (2) D. C. Reynolds, D. C. Look, B. Jogai, and T. C. Collins, Phys. Rev. B 56, 13753 (1997)
- (3) M. Joseph, H. Tabata, and T. Kawai, Jpn. J. Appl. Phys. Part 2 38, L1205 (1999)
- (4) Ü. Özgür, Y. I. Alivov, C. Liu, A. Teke, M. A. Reshchikov, S. Doan, V. Avrutin, S.-J. Cho, and H. Morkŏc, J. Appl. Phys. 98, 041301 (2004)
- (5) D. S. Ginley and C. Bright, MRS Bull. 25, 58 (2000)
- (6) S. Tsukazaki, A. Ohtomo, T. Kita, Y. Ohno, H. Ohno, and M. Kawasaki, Science 315, 1388 (2007)
- (7) A. P. Ramirez, Science 315, 1377 (2007)
- (8) L. Schmidt-Mende and J. L. MacManus-Driscol, Materials Today 10, 40 (2007)
- (9) A. Ohtomo and A. Tsukazaki, Semicond. Sci. Technol. 20, S1 (2005)
- (10) R. Schmidt, B. Rheinländer, M. Schubert, D. Spemann, T. Butz, J. Lenzner, E. M. Kaidashev, M. Lorenz, A. Rahm, H. C. Semmelhack, and M. Grundmann, Appl. Phys. Lett. 82, 2260 (2003)
- (11) S. Sadofev, S. Blumstengel, J. Cui, J. Puls, S. Rogaschewski, P. Schäfer, Y. G. Sadofyev, and F. Henneberger, Appl. Phys. Lett. 87, 091903 (2005)
- (12) S. Sadofev, S. Blumstengel, J. Cui, J. Puls, S. Rogaschewski, P. Schäfer, and F. Henneberger, Appl. Phys. Lett. 89, 201907 (2006)
- (13) S. Shigemori, A. Nakamura, J. Ishihara, T. Aoli, and J. Temmyo, Jpn. J. Appl. Phys. 43, L1088 (2004)
- (14) W. Martienssen and H. Warlimont, eds., “Springer handbook of condensed matter and materials data,” (Springer-Verlag, Berlin, 2005)
- (15) A. Schleife, F. Fuchs, J. Furthmüller, and F. Bechstedt, Phys. Rev B 73, 245212 (2006)
- (16) M. Sanati, G. L. W. Hart, and A. Zunger, Phys. Rev. B 68, 155210 (2003)
- (17) E. Segnit and A. Holland, J. Am. Ceram. Soc. 48, 409 (1965)
- (18) C. Bundesmann, A. Rahm, M. Lorenz, M. Grundmann, and M. Schubert, J. Appl. Phys. 99, 113504 (2006)
- (19) Z. Liu, Z. Mei, T. Zhang, Y. Liu, Y. Guo, X. Du, A. Hallen, J. Zhu, and A. Kuznetsov, Journal of Crystal Growth 311, 4356 (2009), ISSN 0022-0248
- (20) X. Du, Z. Mei, Z. Liu, Y. Guo, T. Zhang, Y. Hou, Z. Zhang, Q. Xue, and A. Y. Kuznetsov, Advanced Materials 21, 4625 (2009)
- (21) J. Chen, W. Z. Shen, N. B. Chen, D. J. Qiu, and H. Z. Wu, Journal of Physics: Condensed Matter 15, L475 (2003)
- (22) N. B. Chen, H. Z. Wu, D. J. Qiu, T. N. Xu, J. Chen, and W. Z. Shen, J. Phys.: Condens. Matter 16, 2973 (2004)
- (23) T. Makino, Y. Segawa, M. Kawasaki, A. Ohtomo, R. Shiroki, K. Tamura, T. Yasuda, and H. Koinuma, Appl. Phys. Lett. 78, 1237 (2001)
- (24) F. Bertram, S. Giemsch, D. Forster, J. Christen, R. Kling, C. Kirchner, and A. Waag, Appl. Phys. Lett. 88, 061915 (2006)
- (25) W. R. Lambrecht, S. Limpigumnong, and B. Segall, MRS Internet J. Nitride Semicond. Res. 451, G6.8 (1999)
- (26) R. Thangavel, M. Rajagopalan, and J. Kumar, Solid State Commun. 137, 507 (2006)
- (27) Y.-G. Kim, E.-C. Lee, and K. J. Chang, J. Korean Phys. Soc. 39, S92 (2001)
- (28) S.-H. Wei, L. G. Ferreira, J. E. Bernard, and A. Zunger, Phys. Rev. B 42, 9622 (1990)
- (29) A.-B. Chen and A. Sher, Semiconductor Alloys (Plenum, New York, 1995)
- (30) L. K. Teles, J. Furthmüller, L. M. R. Scolfaro, J. R. Leite, and F. Bechstedt, Phys. Rev. B 62, 2475 (2000)
- (31) J. M. Sanchez, F. Ducastelle, and D. Gratias, Physica A 128, 334 (1984)
- (32) A. Zunger, in Statistics and Dynamics of Alloy Phase Transformations, edited by P. E. A. Turchi and A. Gonis (Plenum Press, New York, 1994) Chap. First-principles statistical mechanics of semiconductor alloys and intermetallic compounds, p. 361
- (33) J. Z. Liu and A. Zunger, Phys. Rev. B 77, 205201 (2008)
- (34) A. Sher, M. van Schilfgaarde, A.-B. Chen, and W. Chen, Phys. Rev. B 36, 4279 (1987)
- (35) C. Caetano, L. K. Teles, M. Marques, A. D. P. Jr., and L. G. Ferreira, Phys. Rev. 74, 045215 (2006)
- (36) X. F. Fan, H. D. Sun, Z. X. Shen, J.-L. Kuo, and Y. M. Lu, Journal of Physics: Condensed Matter 20, 235221 (2008)
- (37) I. V. Maznichenko, A. Ernst, M. Bouhassoune, J. Henk, M. Däne, M. Lüders, P. Bruno, W. Hergert, I. Mertig, Z. Szotek, and W. M. Temmerman, Phys. Rev. B 80, 144101 (2009)
- (38) J. W. D. Connolly and A. R. Williams, Phys. Rev. B 27, 5169 (1983)
- (39) A. Zunger, S.-H. Wei, L. G. Ferreira, and J. E. Bernard, Phys. Rev. Lett. 65, 353 (1990)
- (40) S.-H. Jeong, B.-S. Kim, and B.-T. Lee, Applied Physics Letters 82, 2625 (2003)
- (41) L. Vegard, Zeitschrift für Physik 5, 17 (1921)
- (42) P. Hohenberg and W. Kohn, Phys. Rev. 136, B864 (1964)
- (43) W. Kohn and L. J. Sham, Phys. Rev. 140, A1133 (1965)
- (44) G. Kresse and J. Furthmüller, Phys. Rev. B 54, 11169 (10 1996)
- (45) J. P. Perdew, in Electronic Structure of Solids ’91, edited by P. Ziesche and H. Eschrig (Akademie-Verlag, Berlin, 1991) p. 11
- (46) J. P. Perdew and Y. Wang, Phys. Rev. B 45, 13244 (1992)
- (47) A. Schleife, F. Fuchs, C. Rödl, J. Furthmüller, and F. Bechstedt, physica status solidi (b) 246, 2150 (2009)
- (48) A. Schleife, C. Rödl, F. Fuchs, J. Furthmüller, and F. Bechstedt, Phys. Rev. B 80, 035112 (2009)
- (49) A. Janotti, D. Segev, and C. G. Van de Walle, Phys. Rev. B 74, 045202 (2006)
- (50) F. Oba, A. Togo, I. Tanaka, J. Paier, and G. Kresse, Phys. Rev. B 77, 245202 (2008)
- (51) P. E. Blöchl, Phys. Rev. B 50, 17953 (1994)
- (52) G. Kresse and D. Joubert, Phys. Rev. B 59, 1758 (1999)
- (53) H. J. Monkhorst and J. D. Pack, Phys. Rev. B 13, 5188 (1976)
- (54) F. D. Murnaghan, Proc. Natl. Acad. of Sci. USA 30, 244 (1944)
- (55) Table of Periodic Properties of Elements (Sargent-Welch, Skokie Illinois, 1980)
- (56) L. Zhang and H. Huang, Applied Physics Letters 90, 023115 (2007)
- (57) J. Carrasco, F. Illas, and S. T. Bromley, Phys. Rev. Lett. 99, 235502 (2007)
- (58) A. Seko, F. Oba, A. Kuwabara, and I. Tanaka, Phys. Rev. B 72, 024107 (2005)
- (59) S. Limpijumnong and S. Jungthawan, Phys. Rev. B 70, 054104 (2004)
- (60) J. Ishihara, A. Nakamura, S. Shigemori, T. Aoki, and J. Temmyo, Applied Physics Letters 89, 091914 (2006)
- (61) T. Minemoto, T. Negami, S. Nishiwaki, H. Takakura, and Y. Hamakawa, Thin Solid Films 372, 173 (2000)
- (62) Z. Vashaei, T. Minegishi, H. Suzuki, T. Hanada, M. W. Cho, T. Yao, and A. Setiawan, Journal of Applied Physics 98, 054911 (2005)
- (63) A. Ohtomo, M. Kawasaki, T. Koida, K. Masubuchi, H. Koniuma, Y. Sakurai, Y. Yoshida, T. Yasuda, and Y. Segawa, Appl. Phys. Lett. 72, 2466 (1998)