Evolution of the solar activity over time and effects on planetary atmospheres. II. Ceti, an analog of the Sun when life arose on Earth111Based on spectroscopic observations collected at the Observatório do Pico dos Dias (OPD), operated by the Laboratório Nacional de Astrofísica, CNPq, Brazil, at the European Southern Observatory (ESO), within the ON/ESO and ON/IAG agreements, under FAPESP project n∘ 1998/10138-8, and with the Hubble Space Telescope.
Abstract
The early evolution of Earth’s atmosphere and the origin of life took place at a time when physical conditions at the Earth where radically different from its present state. The radiative input from the Sun was much enhanced in the high-energy spectral domain, and in order to model early planetary atmospheres in detail, a knowledge of the solar radiative input is needed. We present an investigation of the atmospheric parameters, state of evolution and high-energy fluxes of the nearby star Cet, previously thought to have properties resembling those of the early Sun. Atmospheric parameters were derived from the excitation/ionization equilibrium of Fe I and Fe II, profile fitting of H and the spectral energy distribution. The UV irradiance was derived from FUSE and HST data, and the absolute chromospheric flux from the H line core. From careful spectral analysis and the comparison of different methods we propose for Cet the following atmospheric parameters: = 5665 30 K (H profile and energy distribution), dex (evolutionary and spectroscopic) and (Fe II lines). The UV radiative properties of Cet indicate that its flux is some 35% lower than the current Sun’s between 210 and 300 nm, it matches the Sun’s at 170 nm and increases to at least 2–7 times higher than the Sun’s between 110 and 140 nm. The use of several indicators ascribes an age to Cet in the interval 0.4–0.8 Gyr and the analysis of the theoretical HR diagram suggests a mass 1.04 M⊙. This star is thus a very close analog of the Sun when life arose on Earth and Mars is thought to have lost its surface bodies of liquid water. Photochemical models indicate that the enhanced UV emission leads to a significant increase in photodissociation rates compared with those commonly assumed of the early Earth. Our results show that reliable calculations of the chemical composition of early planetary atmospheres need to account for the stronger solar photodissociating UV irradiation.
Subject headings:
stars: chromospheric activity — stars: abundances – stars: late-type – techniques: spectroscopic — planets: atmospheres1. Introduction
The irradiation from the parent star is, by far, the most important source of energy in planetary atmospheres. Most of the physical and chemical properties of the atmosphere of a planet are largely driven by the stellar input, which ultimately determines its structure, composition and, even, its mere existence. Most of the radiation emitted by the Sun comes from the photosphere and, at the solar effective temperature today ( K), it is the dominant source at wavelengths above 170 nm. The solar photospheric flux is quite stable over short timescales (decades) and it only suffers variations driven by sunspots and faculae with an amplitude below 0.2–0.3% peak to peak (Fröhlich & Lean, 2004). Over long timescales, the variations have been larger and are related to the nuclear evolution of the Sun. Model predictions indicate that the young ZAMS Sun could have had a luminosity some 35% lower than today (unless a scenario of heavy mass loss is considered; Sackmann & Boothroyd, 2003).
The energetic end of the solar spectrum (i.e., below 170 nm) is dominated by the emissions from high-temperature plasma in the chromosphere, transition region and corona. Such high-energy fluxes are strongly variable over short- and mid-term timescales because of flare events, rotational modulation, activity cycles, etc. (e.g., Lean et al., 1997). Over longer timescales, several past studies (Zahnle & Walker, 1982; Ayres, 1997) established that the young Sun’s high-energy emissions were possibly up to several orders of magnitude stronger than currently.
The Sun in Time programme (Dorren & Guinan, 1994; Ribas et al., 2005, hereafter Paper I) focused on a small sample of carefully-selected and well-studied stellar proxies that represent key stages in the evolution of the Sun. This approach allowed the study in the X-ray, EUV, and FUV domains, where the variations are of one order of magnitude or more. However, the stellar proxy technique becomes increasingly uncertain in the UV since the stars are not perfect matches to the Sun (their masses are within 10% of 1 M⊙) and the expected flux variations are in the range of tens of a percent. For this reason, most of the Sun in Time stars employed in Paper I cannot be reliably used to infer the solar flux evolution at wavelengths longer than about 130 nm. But at the same time, the wavelength interval between 130 and 200 nm is an essential energy input to planetary atmospheres since it drives most of the photochemical reactions (e.g., Canuto et al., 1982, 1983). In addition, its impact on living organisms must also be considered, although it is unlikely that photons in this range could penetrate a dense atmosphere (Cockell, 2000).
Among the solar proxies studied in the Sun in Time, Cet (HD 20630, HIP 15457, pc, ) stands out as potentially having a mass very close to solar and a young age (see Paper I). This could be a very good analog of the Sun at the critical time when life is thought to have originated on Earth 3.8 Gyr ago, at the start of the Archean epoch (Mojzsis et al., 1996). It is also about the time when Mars lost its liquid water inventory at the end of the Noachian epoch some 3.7 Gyr ago (Jakosky & Phillips, 2001). For these reasons, Cet deserves attention as a possible precise match to the young Sun, thus providing information on the radiation environment that determined the properties and chemical composition of the planetary atmospheres. Cnossen et al. (2007) presented a study based on Cet with a goal set on assessing the biological implications of the high-energy radiations. The authors did not use a real high-energy spectrum but generated synthetic data using plasma models from an inferred emission measure distribution.
In this paper we carry out an in-depth analysis of Cet, including its radiative properties, chemical abundances, atmospheric parameters and state of evolution, with the ultimate goal of understanding the Sun’s UV emissions at a critical time in the past. The paper is organized as follows. In §2 we describe the spectroscopic analysis and derivation of atmospheric parameters, along with its Li abundance. The high-energy radiative processes and magnetic activity of Cet are discussed in the context of active stars in §3. In §4 we determine its mass and state of evolution, and in §5 we employ its properties to discuss the young Sun in the frame of photodissociation calculations. Our conclusions are drawn in §6.
2. Spectroscopic atmospheric parameters
2.1. Visible spectra
Visible spectroscopic observations were performed with two setups. The Coudé spectrograph of the 1.60-m telescope of Observatório do Pico dos Dias (OPD, Brasópolis, Brazil), operated by Laboratório Nacional de Astrofísica (LNA/CNPq), was used to obtain spectra of Cet and the Sun (represented by Moon spectra) in a 150 Å spectral range, centered in the H line, with R = 20 000 and S/N ratios in excess of 300. Cet was observed in 2008, and the Moon spectra were acquired in a series of runs between 1994 and 2004, to ensure the absence of long-term systematics.
Additionally, the FEROS spectrograph (Kaufer et al., 1999) was used in 2000 to obtain spectra of Cet and Ganymede (as a solar template), at a nominal resolution of R = 45 000. The S/N ratio per resolution element was 800 and 1000, respectively, for Cet and the Sun, between 5600–6960, being about half as much for the 4500–5500 range. As Cet is very solar-like in its properties, the Sun is the natural choice as the standard star of a differential analysis. In this approach, systematic errors in line measurement, atmospheric modelling and the possible presence of Non-Local Thermodynamic Equilibrium (NLTE) effects tend to be minimized.
Data reduction was carried out by standard procedures using IRAF222Image Reduction and Analysis Facility (IRAF) is distributed by the National Optical Astronomical Observatories (NOAO), which is operated by the Association of Universities for Research in Astronomy (AURA), Inc., under contract to the National Science Foundation (NSF).. Extreme care was taken in the continuum normalization to guarantee equivalent width (hereafter s ) measurements as free from systematic effects as possible. This meant chosing specific wavelength intervals by comparing, window by window, Cet with the solar template (Ganymede) and the Solar Flux Atlas (Kurucz et al., 1984) using the Utrecht spectral line compilation (Moore et al., 1966). For each window, the line strengths were checked to see if the wings of neighboring lines might be causing different depressions in the spectra. All windows considered suspect were not used. The remaining windows were then adjusted with low order polynomials. The spectral windows were always simultaneously normalized (Sun and Cet) to minimize the possibility of errors. The s of Fe I and Fe II lines were measured by Gaussian fits.
A series of sanity checks were performed on the measured s. Saturated lines were eliminated by a 2 clipping on the relation of reduced width with line depth, and no lines were measured beyond the linearity limit. Also, no trend is expected in the relation of the line full-width-half-maximum and reduced width, since the line widths are essentially set by the instrumental profile. For stronger lines the inability of gaussian fits to correctly reproduce the line wings leads to an artificial increase of the line FWHM with reduced width, and no lines were measured beyond this limit. The final line selection comprised 90 Fe I and 12 Fe II lines. We follow the same procedure discussed in detail by Porto de Mello et al. (2008). The measured s were corrected by +3.6% to bring them onto a system compatible with the Voigt-fitted solar s of Meylan et al. (1993). The reason for the correction is both a low level of scattered light in the spectrograph ( 2%) and also the inability of Gaussian fits to fully represent observed line profiles.
2.2. Spectroscopic analysis
We derived solar gf-values for the Fe I and Fe II spectral lines from a LTE, 1-D, homogeneous and plane-parallel solar model atmosphere from the NMARCS grid (Gustafsson et al., 2008; Edvardsson et al., 1993). The adopted parameters for the Sun were = 5780 K, , and km s-1, and we employed the s measured off the Ganymede spectra, corrected to the Voigt scale of Meylan et al. (1993). The adopted solar absolute abundances are those of Asplund et al. (2009).
The spectroscopic atmospheric parameters of Cet were determined by the simultaneous satisfaction of the excitation and ionization equilibria of Fe I and Fe II. was obtained by forcing the Fe I line abundances to be independent of their excitation potential. Surface gravity was determined by forcing the lines of Fe I and Fe II to agree to the same abundance. The microturbulence velocity was set by forcing the lines of Fe I to be independent of their s. The Fe abundance (we use throughout the notation , where N denotes the number abundance) is automatically obtained at the end of the iteration, and this solution is unique for a given set of gf values, s and model atmospheres. Here we also used the same procedure as Porto de Mello et al. (2008). The Fe I lines span from 0 to 5 eV in excitation potential, and from 10 to 115 mÅ in , allowing for an internally very precise solution of the excitation and ionization equilibrium.
The formal standard error in the spectroscopic was determined from the 1 uncertainty of the slope of the linear regression in the vs. diagram, yielding the variation admissible at the 1 level. For the microturbulence velocity, the same procedure provides the 1 microturbulence uncertainty in the vs. diagram. For the metallicity , we adopt the standard deviation of the distribution of abundances derived from the Fe I lines, which is larger than the errors in due to , and errors. The error of the spectroscopic is estimated by evaluating the variation in this parameter which produces a disagreement of 1 between the abundances of Fe I and Fe II. The spectroscopic results thus determined for Cet are: = 5780 30 K, dex, dex (for the Fe II lines, dex). The excitation & ionization equilibrium solution as a function of excitation potential is shown in Fig. 1 for all Fe I and Fe II lines.
| Authors | MethodaaMethod: “phot.” stands for photometric derivations of , “H” or “H”; for the fitting of theoretical profiles to the Balmer lines, “line depths” for the calibration of and line depth ratios of metal lines, and “exc. & ion.” for the satisfaction of the excitation and ionization equilibrium with Fe I and Fe II lines. | |||
|---|---|---|---|---|
| Cayrel de Strobel | ||||
| & Bentolila (1989) | 5630 | 4.50 | 0.04 | phot., H |
| Pasquini et al. (1994) | 5675 | 4.35 | 0.01 | phot. |
| Ottman et al. (1998) | 5680 | — | — | H, H |
| Gaidos & Gonzalez (2002) | 5747 | 4.53 | 0.11 | exc. & ion. |
| Barklem et al. (2002) | 5710 | — | — | H,H |
| Heiter & Luck (2003) | 5750 | 4.55 | 0.05 | line depths |
| Allende-Prieto et al. (2004) | 5564 | 4.52 | 0.06 | phot. |
| Luck & Heiter (2006) | 5700 | 4.55 | 0.05 | exc. & ion. |
| This work | 5780 | 4.48 | 0.07 | exc. & ion. |
| This work | 5685 | — | — | phot. |
| This work | 5645 | — | — | H |
| ADOPTED | 5665 | 4.49 | 0.10 | see text |

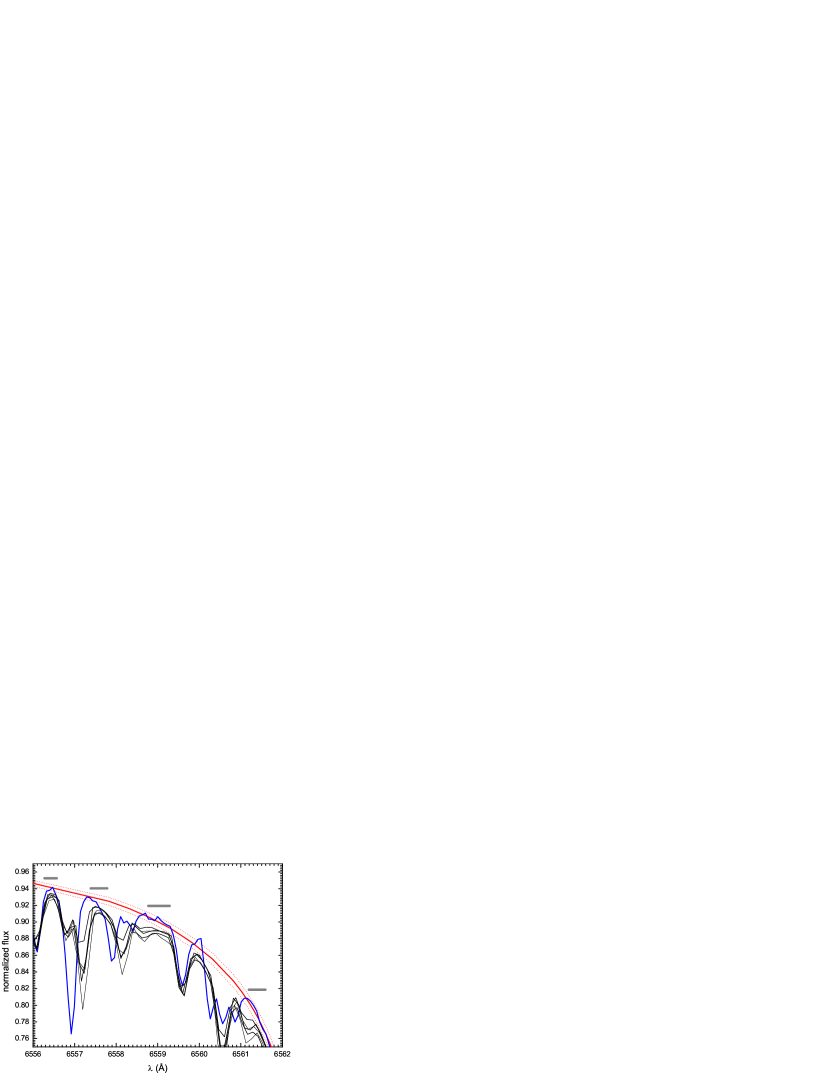
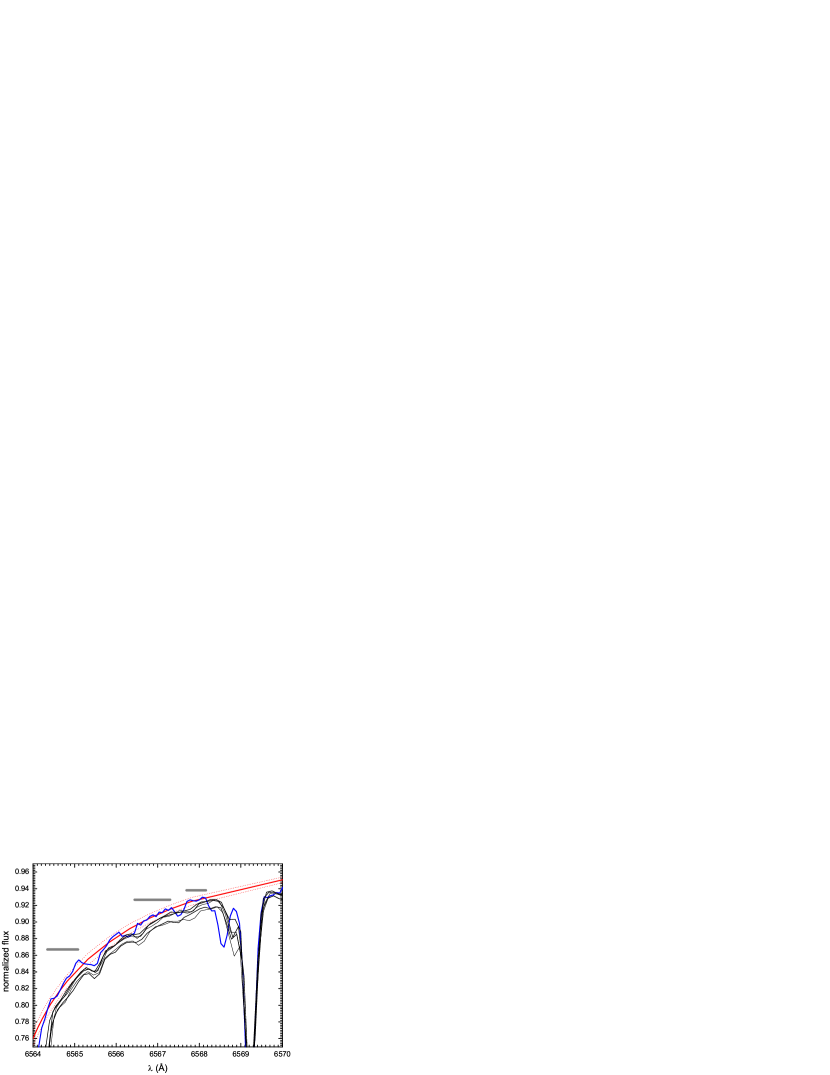
An additional was determined by fitting the observed wings of H, following closely the method of Lyra & Porto de Mello (2005). This procedure is shown in Fig. 2. Here we varied from Lyra & Porto de Mello (2005) routine by selecting manually individual flux points in the blue and red wings of the observed Cet H spectrum, free of telluric lines and photospheric line perturbations, in a total 21 and 43 points, respectively, for the blue and red wings. The values derived from each wing agree within 5 K, and a mean value = 5645 40 K. This error refers exclusively to the dispersion of values attributed to the fitted profile data points. A more formal estimate of the uncertainty of this procedure (Lyra & Porto de Mello, 2005), taking into account errors in the input atmospheric parameters and the continuum normalization, leads to an error of 50 K.
2.3. Effective temperature from the spectral energy distribution
The photometric of Cet was calculated using a variety of methods. Firstly, we employed intermediate-band Strömgren photometry collected from the GCPD database (Mermilliod et al., 1997), which lists mean indices of , , , , and . We used the photometric grids of R. Napiwotzki (priv. comm.), which are based on ATLAS9 model atmospheres. The determination of the was done by considering the 1 uncertainties in the color indices and following a Monte Carlo procedure. From 1000 realizations we obtained a mean value and its corresponding standard deviation of = 5650 125 K. The error bar only reflects the random uncertainty and does not account for systematic contributions. The Strömgren photometry also suggests roughly solar chemical composition.
A more accurate determination was obtained from the IRSED method of Masana et al. (2006). This is based on the use of (2MASS) near-IR photometry and the fit of the spectral energy distribution with stellar atmosphere models. The calibration of Masana et al. (2006) takes into account possible systematic trends and applies corrections based on a sample of solar analogs. The photometry of Cet present in the 2MASS catalog is severely saturated but, fortunately, this star was selected as an ESO standard and numerous measurements are listed in Bouchet et al. (1991). From the ESO IR photometry (, , ), we applied transformations in Carpenter (2001) to obtain photometry in the 2MASS system (, , ). Using this photometry the IRSED method yields an effective temperature of = 5685 45 K when assuming solar values for and . The dependence of the result on these adoptions is very weak, and Cet does have these parameters very similar to the Sun’s, as already shown.
2.4. Systematic offset between photometric, H and spectroscopic values
The three values derived in the present work are not in agreement when the standard errors are considered. The spectroscopic is 110 K higher than the H and photometric ones, which are in close agreement. When one considers the results of recent spectroscopic analyses of Cet, all of them based on high-quality, high-resolution spectra (Table 1), an interesting pattern emerges. Analyses based on photometric and Balmer line methods to derive cluster very systematically in low values around = 5650 K, while those relying on the excitation and ionization equilibria of Fe, or line depth ratios, cluster around = 5750 K. A recent discussion on a possible offset between the spectroscopic scale on one side, and Balmer line and photometric ones on the other, the former being the hotter, has been given by Porto de Mello et al. (2008). Authors do not generally agree whether this offset is due to NLTE effects in cool stars, in the sense that for stars with 5000 K the offsets are large, while for 6000 K good agreement is found (Ramírez et al., 2007): this discrepancy is revealed in this case either by a disagreement between chemical abundances derived from different lines of the same species (atomic or molecular) or by the non-realization of the Fe I/Fe II ionization equilibrium. Another interpretation is the presence of high chromospheric activity, an enhanced non-local UV radiation field and a resulting photospheric overionization (Schuler et al., 2006). In a classical spectroscopic analysis, forcing agreement between Fe I and Fe II abundances under LTE, but in the presence of an overionizing radiation field, leads naturally to a higher . As will be seen below, Cet is a very active star, with a chromospheric flux at the H core only slightly lower than a typical Hyades solar-type star, as well as a heightened UV flux with respect to the Sun below 1600 Å, besides a very high X-ray luminosity. Since Fe II is essentially insensitive to NLTE effects for values similar to that of the Sun (Thévenin & Idiart, 1999), the most reliable determination of the Fe abundance in this instance is that due to the Fe II lines, adopting the photometric and H profile .
Accepting the likely presence of NLTE effects in Cet, we regard the following values as the most likely atmospheric parameters: = 5665 50 K, as a straight average of the values derived from photometry and the H, and dex, the latter due exclusively from the Fe II lines. Note that our metallicity value is in very good ageement with recent determinations (e.g., Valenti & Fischer, 2005).
3. Magnetic activity and age
Cet has always been recognized as a magnetically active star, with levels typical of a young solar analog. A space-based photometric study using the MOST satellite (Walker et al., 2007) provided a precise value for its equatorial rotation period of 8.77 days, which is some 3 times faster than that of today’s Sun. This gives rise to a significantly enhanced magnetic dynamo and consequently stronger magnetically-generated phenomena. The magnetic properties of Cet, together with spectroscopic diagnostics, can be used to place constraints on the age of the star.
3.1. H absolute chromospheric flux

Absolute chromospheric radiative losses at the core of H were derived by Lyra & Porto de Mello (2005) for a large sample of solar-type stars, including stars from Pleiades and Hyades clusters, and the Ursa Major kinematic group. The average fluxes (and dispersions) of three Pleiades stars, seven UMa Group stars and seven Hyades stars are, respectively, 15.0 1.9, 9.5 2.9 and 7.2 1.2 (units are erg cm-2 s-1 Å-1), in a clear age progression. Lyra & Porto de Mello (2005) estimate their H flux uncertainty (probably underestimated because it does not account for errors in the photometric calibration of the fluxes) at 0.5 in the same units. In comparison to more classical spectroscopic indicators of chromospheric losses such as the H & K lines of Ca II (Pasquini, 1992), H fluxes are more subject to observational uncertainty, but are also less sensitive to activity cycle phase and rotational modulations, as well as transient phenomena (Lyra & Porto de Mello, 2005). They should therefore be representative of the average level of stellar activity.
In Fig. 3, mean spectra of the stellar groups, Cet and the Sun are overplotted. It is apparent that the mean chromospheric filling at the H core is much higher for the Pleiades, and similar for the UMa group and the Hyades. The appearance of the core flux spectra does not translate directly to the chromospheric fluxes, since the core flux is integrated in a 1.7 Å-wide window and differences among the group members are not negligible. Considering the dispersions of the mean H core fluxes of the Hyades cluster and the UMa group, nearly the same mean H activity level can be ascribed to them, and Cet is therefore compatible with their age range. Ages for these stellar groups are 0.1 Gyr for the Pleiades (Schilbach et al., 1995), 0.63 Gyr for the Hyades (Perryman et al., 1998) and 0.5 Gyr for the UMa Group (King et al., 2003). Applying the flux calibration of Lyra & Porto de Mello (2005) to our H spectrum leads to erg cm-2 s-1 Å-1, which places Cet at the same flux level than an average Hyad, and below the flux level of an average member of the Ursa Major Group. The age calibration of Lyra & Porto de Mello (2005) yields 0.65 Gyr for Cet, taking its chromospheric H flux at face value.
3.2. Lithium abundance
The lithium abundance of Cet was derived from the Li I resonance transition at 6707. A synthetic spectrum was fitted to the FEROS spectrum, for two sets of atmospheric parameters: the purely spectroscopic solution, = 5780 K, dex, and = 1.21 km s-1, and the photometric/H solution, = 5665 K, dex, and = 1.20 km s-1. Model atmospheres were interpolated in the Kurucz grid (Kurucz et al., 1993) and the synthetic spectra were calculated with the MOOG routine (Sneden, 1973). The FEROS instrumental broadening profile was set at 0.07 Å. The synthesis of Fe I lines in the 6707 vicinity provides a projected rotational velocity km s-1. For the spectroscopic atmospheric parameters, we derived (Fig. 4), in the usual scale where . This value is in very good agreement with the determinations of Luck & Heiter (2006) and Pasquini et al. (1994), respectively, and 2.13.
This Li abundance places Cet, for the corresponding , in very good agreement with the Li sequence for the Praesepe and Hyades clusters as determined by Soderblom et al. (1993). The two clusters are thought to be coeval at 0.6 Gyr. Allowing for the spread in the Li abundances of the clusters’ members, and the intrinsically poor ability of Li abundances to discriminate age, this result does not actually constrain the age of Cet, but suggests that it is very young and not abnormal in its Li depletion history.

3.3. Age
Rotation periods for Cet have been estimated from spot modulations. The determinations range between 8.9 and 9.4 days (Güdel et al., 1997; Baliunas et al., 1995; Messina & Guinan, 2003; Rucinski et al., 2004). The variation is probably caused by the interplay of differential rotation and spots arising at different stellar latitudes of a star rotating with days in the equator (Walker et al., 2007). In any case, the rotation period is within the typical range for solar-type stars in the Hyades cluster (Radick et al., 1995), although close to the high end (Güdel et al., 1997). The X-ray luminosity ( in cgs; Güdel et al., 1997) is also comparable to that of the Hyades solar analogs (Barrado y Navascués et al., 1998). The same compatibility with Hyades members is also encountered in the case of chromospheric H emission and in the abundance of Li in the atmosphere. All these indicators seem to suggest an age in the range 0.6–0.8 Gyr. In contrast, some age determinations based on chromospheric emission indices (like the Ca II H&K index ) seem to suggest a younger age around 0.4 Gyr (Lachaume et al., 1999; Mamajek & Hillenbrand, 2008).
All the age determination methods employed above have significant uncertainties associated. For example, the rotation period vs. age relationship may carry a significant cosmic dispersion since not all stars have the same initial conditions and the same spin-down properties. The Li abundance determination has been observed to have nearly one order of magnitude dispersion even within coeval clusters. And, finally, chronology with activity indicators may suffer also from cosmic dispersion, metallicity effects, etc. In summary, attributing a single age value for Cet is difficult and uncertain, but, putting all indicators together, we conclude that its age is likely to be in the range 0.4–0.8 Gyr (i.e., Gyr), which is the value we adopt here.
4. Evolutionary state
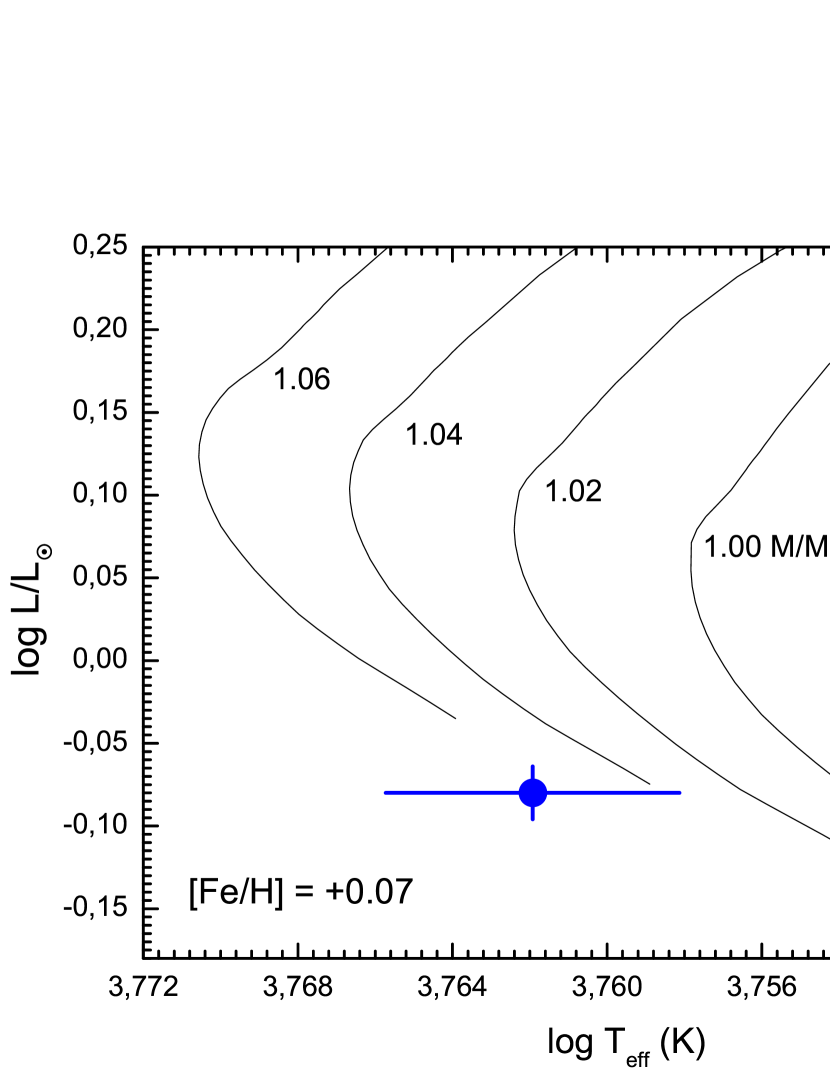
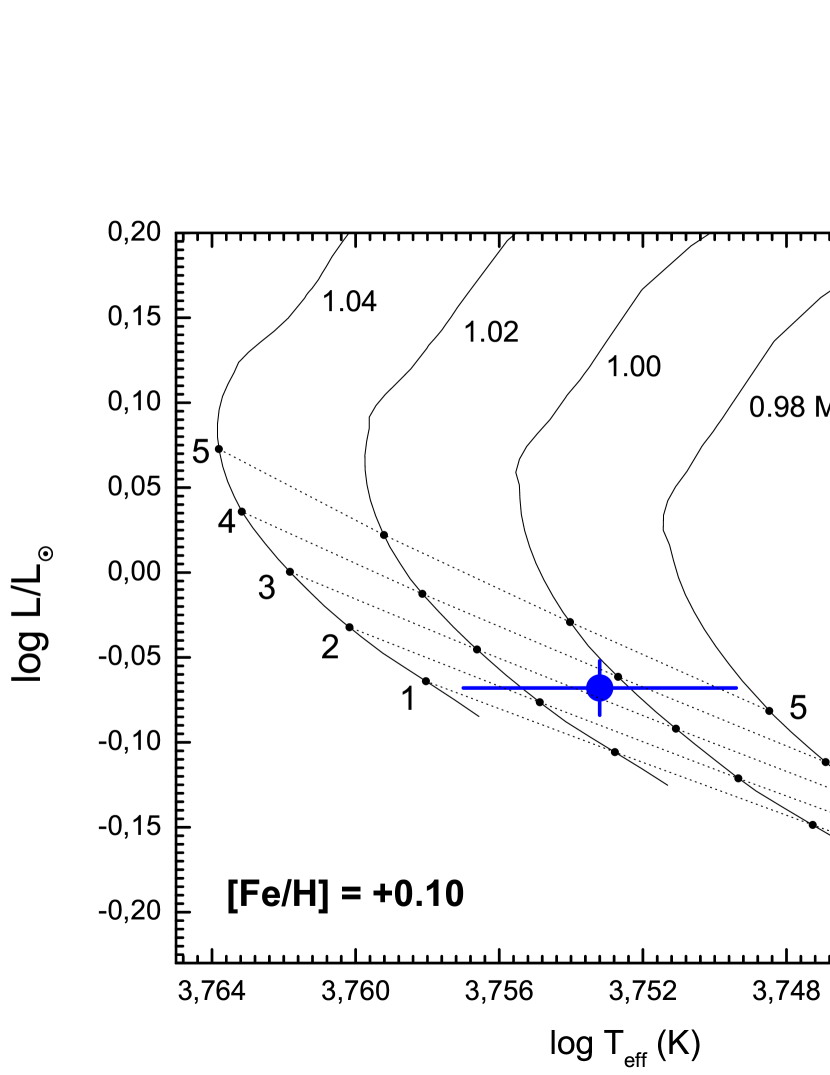
Given the level of magnetic activity of Cet, it is expected that the star still remains very close to, but not exactly on, its zero-age main sequence (ZAMS) position. We plotted Cet in two theoretical HR diagrams of the Yonsei-Yale (Kim et al., 2002; Yi et al., 2003) suite of models (Y2). The first corresponds to the purely spectroscopic solution of the atmospheric parameters (Fig. 5 top), = 5780 K and , and the second to the photometric/H determination (Fig. 5 bottom), = 5665 K, and the Fe abundance from Fe II lines, . The absolute magnitude from the Hipparcos parallax ( mas), coupled to the bolometric correction of Flower (1996), results in , for = 5780 K, and , for = 5665 K (both in a scale in which and ). For the , an uncertainty of 50 K was adopted. The diagrams were slightly displaced in and (by +0.00186 and +0.0106 in log, respectively) so that a solar metallicity and solar mass track reaches the position of the Sun exactly at = 5780 K for 4.53 Gyr (Guenther & Demarque, 1997). This is acceptable for our current differential study.
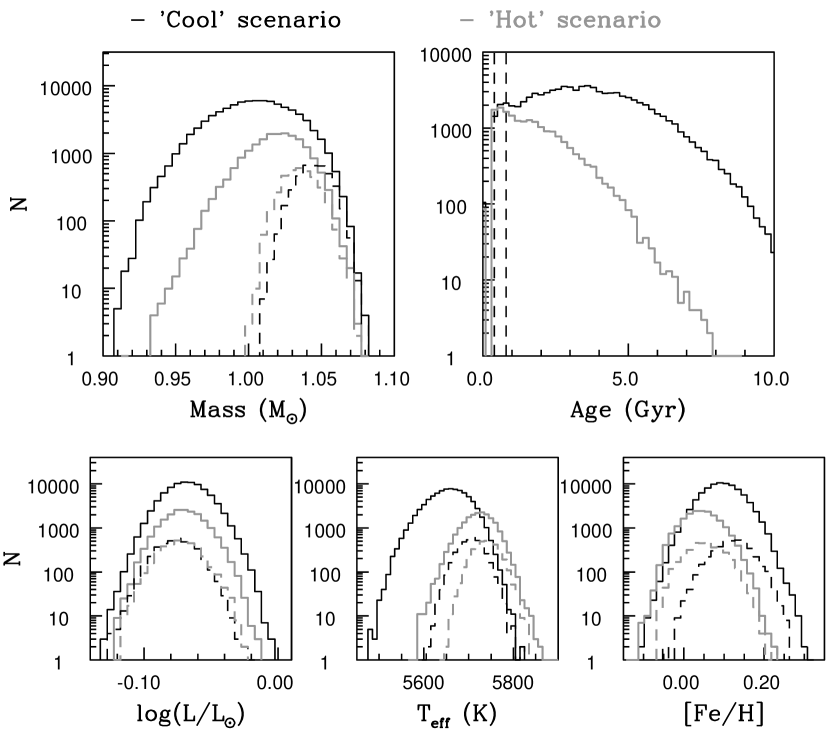
To study the evolutionary state of Cet in a more thorough manner we performed a series of Monte Carlo simulations taking into account both the “hot” and “cool” scenarios, with their corresponding luminosities and metallicities. For this purpose we have generated random values () with a Gaussian distribution for each of the input parameters, considering the errors as the standard deviations of the distributions. For each combination of the values generated (, and ) we carried out an interpolation in the synthetic Y2 tracks to obtain the value of the mass and the age. Those parameter combinations that yielded unphysical situations (i.e., below the ZAMS) were discarded. In the case of the “cool” scenario, 85603 parameter realizations could be used while only 19110 led to physical solutions in the case of the “hot” scenario.
For our statistical study we only took into account those parameter combinations that resulted in an interpolated age in the range 0.4–0.8 Gyr, which were 4047 and 3715 for the “cool” and “hot” scenarios, respectively. According to this result there is no significantly better scenario. In both, we calculated the averages and standard deviations of the mass (the average of the age was obviously close to 0.6 Gyr), which were found to be M⊙ and M⊙ for the “cool” and “hot” scenarios, respectively. In the case of the input parameters, the average of the solutions yielding the correct age are = 5705 30 K, and for the “cool” scenario, and = 5740 30 K, and , for the “hot” scenario. The luminosities are essentially identical, while the temperatures are both pushed into mutual agreement, suggesting that a value close to the average is favored by the theoretical models. Regarding the metallicity, the behavior is clearly different and the model calculations for the “cool” and “hot” scenarios tend to prefer slightly divergent values. This is expected since the metallicity has a strong effect in shifting the theoretical tracks, which, taking into account that the and uncertainties dominate the error budget, naturally constrains the physically acceptable solutions for each scenario within a narrow range of metallicity. Fig. 6 shows the histograms of the input and output parameters for the “cool” and “hot” scenarios. The solid lines depict the distribution from the entire simulation while dashed lines show the distribution of those solutions that yield an age in the interval 0.4–0.8 Gyr.
The simulations favor slightly the “cool” spectroscopic solution and, although the statistical significance of this result is low, when considered with the likely presence of non-local radiative fields distorting the Fe I and Fe II populations, we find the “cool” spectroscopic solution more consistent and adopt it in the subsequent discussion.
The position of Cet in the theoretical HR diagram, along with its magnetic activity context, is thus compatible with a slightly metal-rich star, slightly more massive than the Sun, and 0.4–0.8 Gyr old. These and /L⊙ values, along with M⊙, when put into the well known equation:
lead to , in excellent agreement with the spectroscopic solution, and confirming that Cet is very close to the ZAMS. This surface gravity estimate is very insensitive to uncertainties in the inferred mass.
Considering the Galactic orbit of Cet in the context of nearby solar-type stars as analyzed by Porto de Mello et al. (2006), Cet is seen to have one of the lowest orbital eccentricities in the local population, and a mean galactocentric radius nearly identical to that of the Sun, and therefore a very similar Galactic orbit.
5. UV Irradiance
Because of its apparent brightness, Cet has been subject to intensive scrutiny with a variety of X-ray and UV telescopes (Güdel et al., 1997; Telleschi et al., 2005, Paper I) that have revealed fluxes significantly higher than those of the current Sun. Paper I carried out an analysis of high-energy data with a wide wavelength coverage and found X-ray and EUV fluxes for Cet some 20 and 10 times stronger, respectively, than today’s Sun. In the FUV and UV, beyond the H Lyman line (121.5 nm) only fluxes for some strong features have been presented, mostly from IUE spectra (Ayres, 1997, Paper I), but not the needed overall irradiance (strong lines + pseudo-continuum).
We have compiled flux data of Cet in the UV and FUV. Spectra covering from 93 to 118 nm are available from FUSE and were discussed by Guinan et al. (2003) and in Paper I. Here we have used only night-time data since the relevant H Lyman lines are prone to contamination from geocoronal emission. The interstellar medium-corrected profile of the strong H Ly line was taken from Wood et al. (2005), which agrees well with the values provided in Paper I. The rest of the spectrum (i.e., from H Ly up to nearly 300 nm) was taken from the CoolCAT catalog333http://casa.colorado.edu/ayres/CoolCAT/, which compiles echelle spectroscopy obtained with the HST STIS instrument. The combined spectrum, covering from 93 to 299 nm (with a few small gaps), was smoothed using a convolution with a gaussian of 0.3 nm FWHM and resampled at steps of 0.01 nm. The random uncertainties after such convolution are negligible above 200 nm (well below 1%) and then slowly increase towards shorter wavelengths to reach about 10% at 140 nm and 20% at 93 nm. At long wavelengths the dominant error will be that of the standard flux calibration but, according to STIS specifications and the information in CoolCAT, the systematic uncertainty should not exceed 5%.
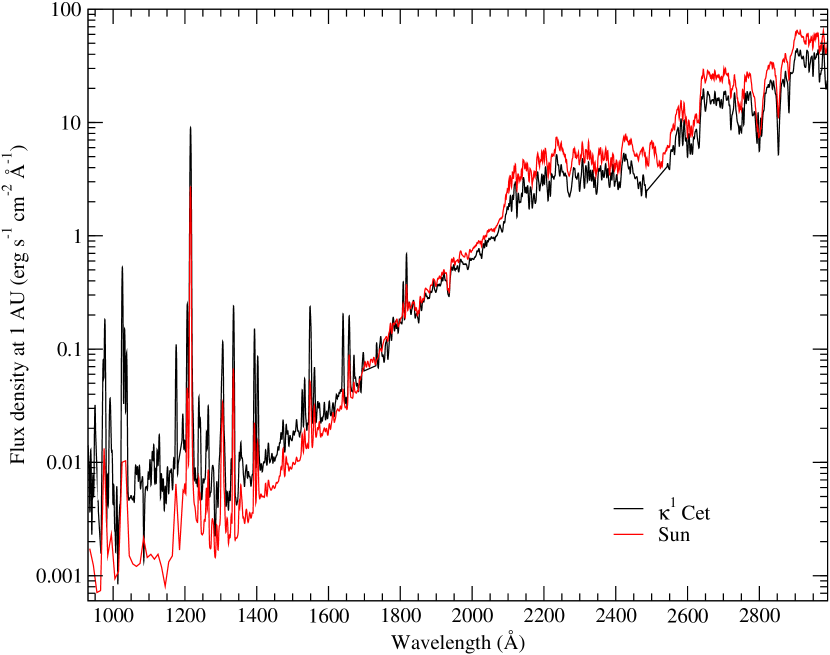

The Cet spectrum was compared with a spectrum of the Sun obtained from Thuillier et al. (2004), corresponding to medium solar activity. Fig. 7 illustrates such comparison. The left panel shows the normalized flux density at a distance of 1 AU from both Cet and the current Sun, while the right panel depicts the normalized flux ratio. The results clearly show that Cet is about 35% fainter than today’s Sun for wavelengths above 210 nm, a range completely dominated by thermal radiation (except for the chromospheric emission of the Mg II h&k lines). Below 210 nm the difference in the ratio decreases to about 17% at 200 nm, 10% at 190 nm and the fluxes equal on average around 170 nm. Some chromospheric lines start to appear below 185 nm and those are much stronger in the case of Cet. Shortward of 170 nm the relative flux of Cet increases up to about a factor of 4 at 120 nm and then even higher below. At those wavelengths most of the flux is dominated by chromospheric lines that are significantly stronger for Cet.
The results in Fig. 7 clearly illustrate how the Sun, because of its higher temperature, possesses stronger photospheric UV radiation, yet, when the chromosphere emission is considered, Cet emissions are stronger because of its higher level of magnetic activity. The transition between photosphere and chromosphere in terms of emission is usually set at about 170 nm. However, note how in the interval between 170 nm and 210 nm, Cet is relatively brighter than expected. The flux ratio difference with the Sun is about 10–15% while about 35% is found at longer wavelengths.
Cnossen et al. (2007) presented estimates of the UV flux for Cet. The authors did not use measured UV data but employed astrophysical plasma models to generate synthetic flux distributions from an emission measure distribution (EMD). Such EMD was obtained from the analysis of X-ray and EUV data, typically arising from coronal emission. The calculated UV fluxes, originating from much cooler plasma in the chromosphere, should thus be a crude approximation of reality. Comparison of the fluxes obtained by Cnossen et al. (2007) is not possible beyond a general apparent agreement, but real data, also with much higher resolution, ought to be preferred.
6. A Young Sun
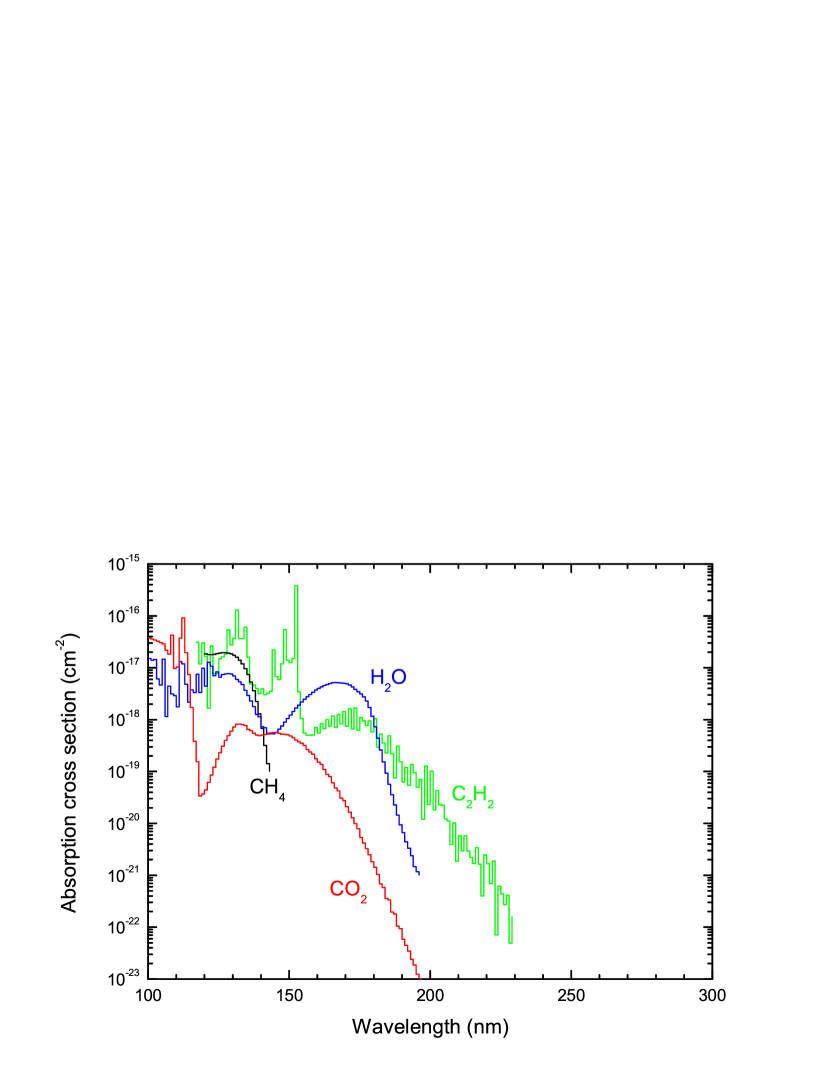
Evidence presented here for the young solar analog Cet suggests that the Sun was significantly more active in its past. This early activity for Sun-like stars is known in the X/EUV range and its evolution with the age of the star was studied in Paper I. Interestingly, Cet also exhibits enhanced fluxes in the 100–200 nm range. These emissions may have had an impact on the early evolution of Earth’s atmosphere and may have played a role in the origin and development of life on Earth: it has been proposed, for instance, that UV radiation may help the synthesis of complex ribonucleotides in plausible early Earth conditions (Powner et al., 2009). In this wavelength range, the solar emission drives the photochemistry and thus the molecular composition of planetary atmospheres. This can be gauged in Fig. 8, where we show UV photoabsorption cross sections of relevant molecules.
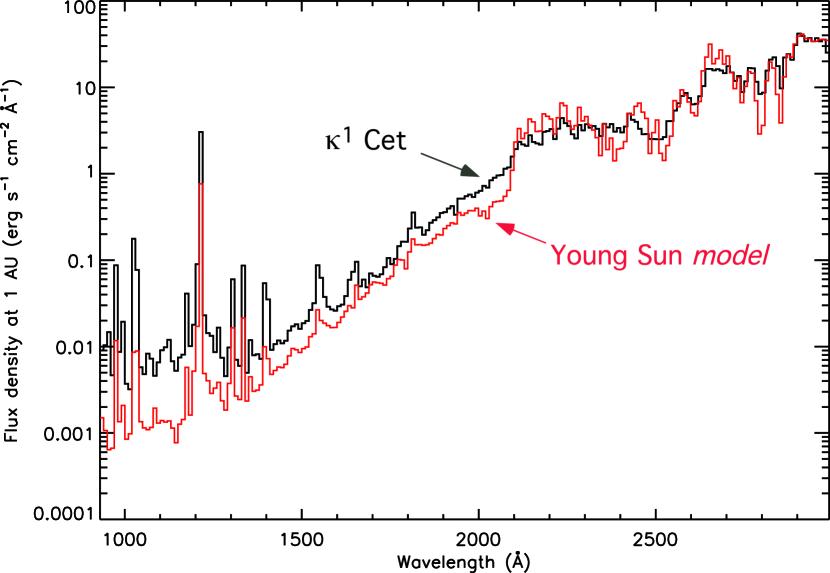
To illustrate how the spectral irradiance in the 100–300 nm domain can influence the photochemistry, we have computed the photolysis rates in an early Earth atmosphere subject to two different irradiance spectra. The first spectrum is that of Cet. The second spectrum (“model”) is an educated guess of the UV spectral irradiance of the Sun at 0.6 Gyr based on our knowledge of stellar evolution and spectral synthesis, prior to the latests results of the Sun in Time program in Paper I, and on the basic assumption that the solar activity has not changed during the last 3.9 Gyr. This model of the young Sun spectrum is obtained by adding a synthetic photospheric irradiance spectrum and an activity component. The synthetic spectrum was computed by F. Castelli with the ATLAS9 model for the characteristics of the Sun at 0.6 Gyr ( L⊙, = 5680 K), as derived from the Y2 stellar evolution models. The short wavelength emission associated with activity is assumed to be that of today’s Sun. Such activity component can be calculated as the difference between the observed spectrum Thuillier et al. (2004) and the photospheric synthetic spectrum444ATLAS9 spectra of the present Sun are available at http://wwwuser.oat.ts.astro.it/castelli/sun.html. The difference, namely the activity component, becomes significant below about 200 nm and dominates below 175 nm. Both spectral irradiances are scaled to 1 AU. The spectra of this simple young Sun model and Cet are compared in Fig. 9.
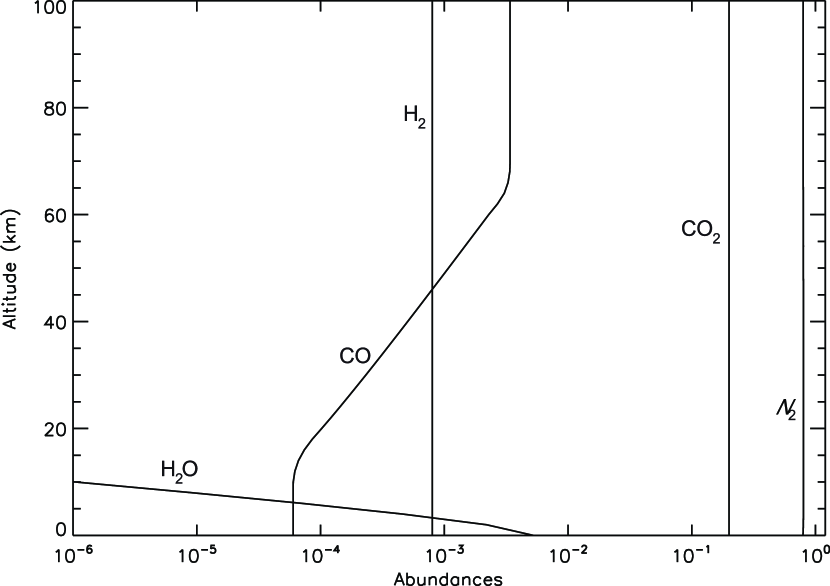
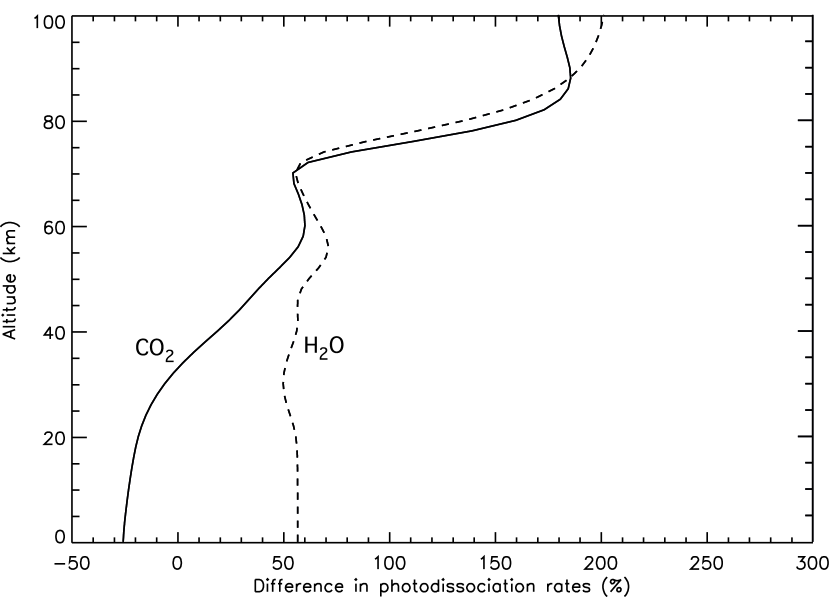
We have considered two different atmospheric compositions (see Fig. 10, top):
-
•
A CO2-rich atmosphere described in Kasting (1993). In this model the enhanced level of CO2 provides enough greenhouse warming to compensate for the faint luminosity of the Sun 3.9 Gyr ago. The abundance of H2 is obtained for the current volcanic emission and assuming a diffusion-limited rate for the escape of hydrogen to space. This atmosphere contains no organic species.
-
•
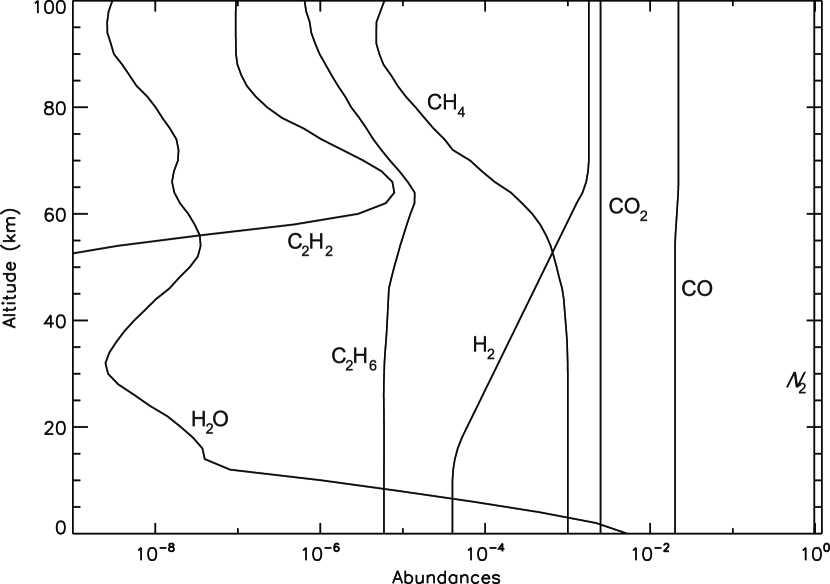
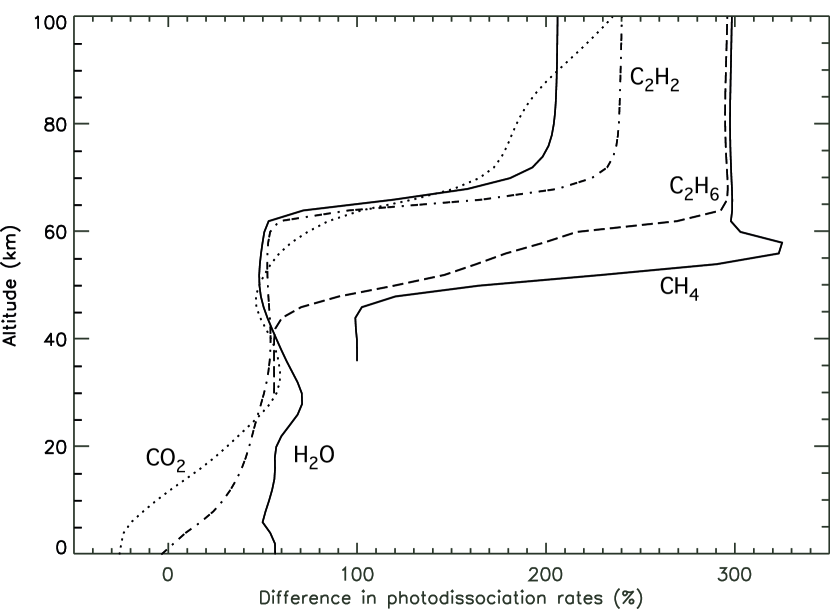
A more reduced atmosphere excerpted from Pavlov et al. (2001), that differs from the previous one by a significant level of CH4 and some photochemically produced hydrocarbons (in particular C2H2 and C2H6). In Pavlov et al. (2001), the source of CH4 is assumed to be biogenic methanogenesis, but abiotic sources associated with hydrothermal activity are also plausible (Sleep et al., 2004; Albarede & Blichert-Toft, 2009).
Both compositions include 1 bar of N2 as the main constituent. For both cases, our atmospheric thermal profile has been deduced from a present day terrestrial profile, assuming a constant stratospheric temperature equal to 200 K between 14 and 60 km. This is of course not consistent with the detailed compositions but has little impact on the photolysis rates. Also, the detailed composition from Kasting (1993) and Pavlov et al. (2001) were computed with a photochemical model that assumed different UV fluxes. The purpose here is not to run a consistent photochemical model, which will be the done in future studies, but to illustrate how the photodissociation rates for these atmospheric compositions are sensitive to an enhanced UV irradiance.
Photodissociation rates (s-1) at the altitude of the different absorbing species included in the model were computed in the range of wavelength as
| (1) |
which requires beforehand the implementation of their absorption cross-sections , of their different photodissociation pathways each characterized by a quantum yield and of the incident stellar UV flux at every level in the atmosphere as well. This incident stellar flux was calculated as a function of the diurnally averaged unattenuated stellar flux at the top of the atmosphere by considering only the integrated molecular absorption and Rayleigh scattering within molecular nitrogen N2.
| (2) |
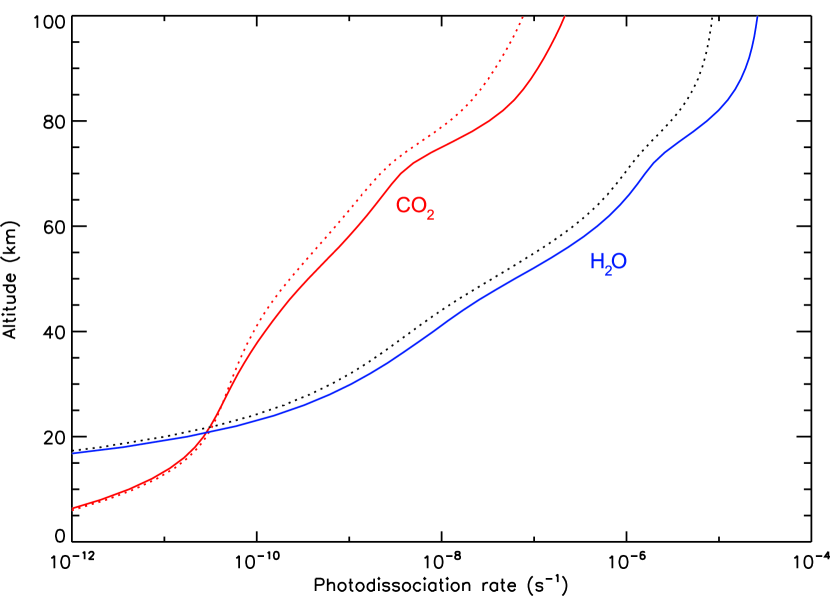
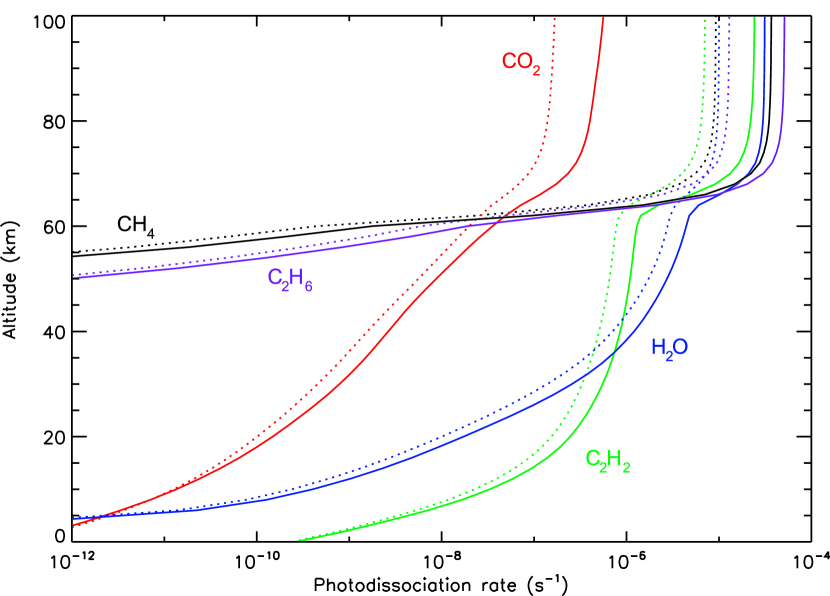
The photolysis rates computed for both atmospheric compositions and both UV spectral irradiances are shown in Fig. 10. These rates are found to be enhanced by a factor of 2–3 in the stratosphere and mesosphere for H2O and CO2 and by a factor of 4 for organic compounds. These photodissociations produce the radicals that activate the photochemical evolution, which is controlled by several hundreds of individual reactions, coupled with the vertical mixing and the condensation of some species. The resulting set of equations behaves strongly non-linearly and can be very sensitive to the photolysis rates, which is why the UV spectrum has a critical influence. Therefore, considering Cet as a close analog of our Sun in its early times, such enhanced photodissociation rates were likely to trigger a peculiar atmospheric chemistry that we plan to investigate shortly by using a photochemical model of the primitive Earth’s atmosphere. The higher H2O photolysis, associated with the intense heating of the thermosphere by the strong EUV irradiance, would also result in a higher escape rate of hydrogen to space, particularly important for the early evolution of Mars and Venus. The effect of the relatively strong UV fluxes is thus still significant for a 0.6 Gyr old Sun-like star, and is likely to play an even more important role for younger stars, and for the atmospheric processes that occurred during the earliest stages of our planet.
At wavelengths above 200 nm, the photospheric emission dominates and the spectrum can be computed using a stellar atmosphere model. However, the inaccuracy of synthetic spectra can have a significant effect on the photodissociation rates. This inaccuracy has various origins as, for instance, the opacities, the elemental abundances, the limb darkening/brightening. Edvardsson (2008) compared different models with observed stellar spectra, above 300 nm, and reported the occurrence of numerous patterns with widths of 0.5-1.5 nm, below 450 nm, with systematic uncertainties of about 10%. We noted even higher differences below 300 nm when comparing synthetic spectra obtained for the same stellar parameters but with different models. We can see in Fig. 9 that above 200 nm the synthetic model used for the young Sun fluctuates around that of Cet. This difference can be attributed to both the inaccuracy of the model and to the fact that Cet is a close but not exact replica of the Sun, having a slightly different mass and metallicity.
Between 150 and 200 nm, the photon flux increases by more than two orders of magnitude. Which means that a 10% error on a 1 nm bin at 200 nm represent 10 times more photons than all the flux in a 1 nm bin at 150 nm. We can thus wonder about the influence of this error on the photodissociation rates. In the atmosphere models we considered, most of the species are photodissociated at wavelengths below 200 nm and most absorption cross-sections decrease by orders of magnitude between 150 and 200 nm. As a consequence, variations of the flux above 200 nm have a limited impact on the dissociation rates. For some species that absorb at nm (like CO2 or hydrocarbons), photolysis rates can be slightly higher in the lowest atmosphere when computed with the young Sun model. But with the atmospheric compositions we considered, we checked that this effect remains negligible by comparing the rates from Fig. 10 with rates computed when both spectra are set to the same values at wavelengths above 200 nm. We should stress however that other atmospheric compositions, involving species that have strong absorption cross-sections at nm (like for instance SO2 or O3), would be much more sensitive to this part of the spectrum. This demonstrates that using both the observed spectrum of a young Sun proxy and a theoretical model may be necessary for a full description of planetary atmospheres.
7. Summary and conclusions
In this paper we have carried out an in-depth study of the bright, nearby solar analog Cet. Several methods have been used to estimate its effective temperature and chemical composition, yielding preferred values of = 5665 30 K, and . The systematic offset between values obtained from photometry/line profiles and the excitation/ionization Fe I and Fe II equilibria is evidence of non-LTE effects, probably related to UV overionization due to the strong magnetic activity of this star. Adopting as the best atmospheric parameters the photometry and H profile and the Fe II metallicity, we have been able to set constraints to the stellar age, which should be between 0.4 and 0.8 Gyr. All the information gathered indicates that Cet is a star with nearly 1 solar mass in a relatively unevolved evolutionary stage. As such, it is an excellent match to the Sun as it was some 3.7–4.1 Gyr ago.
The radiation from the young Sun must have played an essential role in shaping the atmospheres of the Solar System planets. In particular, the UV flux is responsible for the photochemical processes in the atmosphere. We have been able to compile data, taken both with FUSE and HST, covering the entire UV and it shows that Cet’s flux is some 35% lower than the current Sun’s between 210 and 300 nm, it matches the Sun’s at 170 nm and increases to at least 2–7 times higher than the Sun’s between 110 and 140 nm. We have compared these fluxes with a “theoretical” young Sun estimated by adding the current chromospheric flux to a photospheric model with the correct radiative properties. We have used a photochemical model to calculate the photodissociation rates of the most relevant molecules in the assumed composition of early Earth’s atmosphere. The results indicate that such rates should have been several times higher than those resulting from a simplistic “theoretical” solar spectrum.
Our calculations demonstrate that self-consistent planetary atmosphere calculations must account for the much stronger photodissociating radiation of the young Sun. The resulting chemistry could be significantly different from that commonly assumed. This is obviously very relevant at a significant point in the Solar System evolution, when life was gaining a secure foothold on Earth and Mars lost its liquid water inventory.
References
- Albarede & Blichert-Toft (2009) Albarede, F., & Blichert-Toft, J. 2009, in Origins of Life: Self-Organization and/or Biological Evolution? (EDP Science), 1–12
- Allende-Prieto et al. (2004) Allende Prieto, C., Barklem, P. S., Lambert, D.L., & Cunha, K. 2004, A&A, 420, 183
- Asplund et al. (2009) Asplund, M., Grevesse, N., Sauval, A. J., & Scott, P. 2009, ARA&A, 47, 481
- Ayres (1997) Ayres, T. R. 1997, JGR, 102, 1641
- Baliunas et al. (1995) Baliunas, S. L., et al. 1995, ApJ, 438, 269
- Baraffe et al. (1998) Baraffe, I., Chabrier, G., Allard, F., & Hauschildt, P. H. 1998, A&A, 337, 403
- Barrado y Navascués et al. (1998) Barrado y Navascués, D., Stauffer, J. R., & Randich, S. 1998, ApJ, 506, 347
- Barklem et al. (2002) Barklem, P., Stempels, H. C., Allende Prieto, C., Kochukhov, O. P., Piskunov, N. & O’Mara, B. J. 2002, A&A, 383, 951
- Bouchet et al. (1991) Bouchet, P., Schmider, F. X., & Manfroid, J. 1991, A&AS, 91, 409
- Canuto et al. (1982) Canuto, V. M., Levine, J. S., Augustsson, T. R., & Imhoff, C. L. 1982, Nature, 296, 816
- Canuto et al. (1983) Canuto, V. M., Levine, J. S., Augustsson, T. R., Imhoff, C. L., & Giampapa, M. S. 1983, Nature, 305, 281
- Carpenter (2001) Carpenter, J. M. 2001, AJ, 121, 2851
- Cayrel de Strobel & Bentolila (1989) Cayrel de Strobel, G. & Bentolila, C. 1989, A&A, 211, 324
- Cnossen et al. (2007) Cnossen, I., Sanz-Forcada, J., Favata, F., Witasse, O., Zegers, T., & Arnold, N. F. 2007, JGR (Planets), 112, 2008
- Cockell (2000) Cockell, C. S. 2000, P&SS, 48, 203
- Dorren & Guinan (1994) Dorren, J. D., & Guinan, E. F. 1994, in IAU Coll. 143, The Sun as a Variable Star, eds. J. M. Pap, C. Frölich, H. S. Hudson, & S. K. Solanki (Cambridge: CUP), p. 206
- Edvardsson (2008) Edvardsson, B. 2008, Physica Scripta Volume T, 133, 014011
- Edvardsson et al. (1993) Edvardsson, B., Andersen, J., Gustafsson, B., Lambert, D. L., Nissen, P. E. & Tomkin, J. 1993, A&A, 275, 101
- Flower (1996) Flower, P.J. 1996, ApJ, 469, 355
- Fröhlich & Lean (2004) Fröhlich, C., & Lean, J. 2004, ARA&A, 12, 273
- Gaidos & Gonzalez (2002) Gaidos, E. J. & Gonzalez, G. 2002, New Astronomy, 7, 211
- Güdel et al. (1997) Güdel, M., Guinan, E. F. & Skinner, S. L. 1997, ApJ, 483, 947
- Guenther & Demarque (1997) Guenther, D. B., & Demarque, P. 1997, ApJ, 484, 937
- Guinan et al. (2003) Guinan, E. F., Ribas, I., & Harper, G. M. 2003, ApJ, 594, 561
- Gustafsson et al. (2008) Gustafsson B., Edvardsson, B., Eriksson, K., Jörgensen U. G., Nordlund, A. & Plez, B. 2008, A&A, 486, 951
- Hauschildt et al. (1999) Hauschildt, P. H., Allard, F., & Baron, E. 1999, ApJ, 512, 377
- Heiter & Luck (2003) Heiter, U. & Luck, R. E. 2003, AJ, 126, 2015
- Jakosky & Phillips (2001) Jakosky, B. M., & Phillips, R. J. 2001, Nature, 412, 237
- Kasting (1993) Kasting, J. F. 1993, Science, 259, 920
- Kasting et al. (1993) Kasting, J. F., Whitmire, D. P., & Reynolds, R. T. 1993, Icarus, 101, 108
- Kaufer et al. (1999) Kaufer, A., Stahl, O., Tubbesing, S., Norregaard, P., Avila, G., Francois, P., Pasquini, L. & Pizzella, A. 1999, Messenger, 95, 8
- Kim et al. (2002) Kim, Y. C., Demarque, P. & Yi, S. K. 2002, ApJS, 143, 499
- King et al. (2003) King, J. R., Villareal, A. R., Soderblom, D. R., Gulliver, A. F. & Adelman, S. J. 2003, AJ, 125, 1980
- Kurucz et al. (1984) Kurucz, R. L., Furenlid, I., Brault, J. & Testerman, L. 1984, Solar Flux Atlas from 296 to 1300 nm, National Solar Observatory
- Kurucz et al. (1993) Kurucz, R. L., 1993, CD-ROMs, ATLAS9 Stellar Atmospheres Programs MOOG
- Lachaume et al. (1999) Lachaume, R., Dominik, C., Lanz, T., & Habing, H. J. 1999, A&A, 348, ,897
- Lean et al. (1997) Lean, J. L., Rottman, G. J., Kyle, H. L., Woods, T. N., Hickey, J. R., & Puga, L. C. 1997, JGR, 102, 29939
- Luck & Heiter (2006) Luck, R. E. & Heiter, U, 2006, AJ, 131, 3069
- Lyra & Porto de Mello (2005) Lyra, W. & Porto de Mello, G. F. 2005, A&A, 431, 329
- Masana et al. (2006) Masana, E., Jordi, C., Ribas, I. 2006, A&A, 450, 753
- Mamajek & Hillenbrand (2008) Mamajek, E. E., & Hillenbrand, L. A. 2008, ApJ, 687, 1264
- Mermilliod et al. (1997) Mermilliod, J.-C., Mermilliod, M., & Hauck, B. 1997, A&AS, 124, 349
- Messina & Guinan (2003) Messina, S., & Guinan, E. F. 2003, A&A, 409, 1017
- Meylan et al. (1993) Meylan, T., Furenlid, I., Wigss, M. S. & Kurucz, R. L. 1993, ApJS,85, 163
- Mojzsis et al. (1996) Mojzsis, S. J., Arrhenius, G., McKeegan, K. D., Harrison, T. M., Nutman, A. P., & Friend, C. R. L. 1996, Nature, 384, 55
- Moore et al. (1966) Moore, C. E., Minnaert, M. M. & Houtgast, J. 1996, The Solar Spectrum from 2935 Åto 8770 Å, Nat. Bur. Std., U.S. Monograph 61
- Ottman et al. (1998) Ottman, R., Pfeifer, M. J. & Gehren, T. 1998, A&A, 338, 661
- Pasquini (1992) Pasquini, L. 1992, A&A, 266, 347
- Pasquini et al. (1994) Pasquini, L., Liu, Q. & Pallavicini, R. 1994, A&A, 287, 191
- Pavlov et al. (2001) Pavlov, A. A., Brown, L. L., & Kasting, J. F. 2001, JGR, 106, 23267
- Perryman et al. (1998) Perryman, M. A. C., Brown, A. G. A., Lebreton, Y., Gomez, A., Turon, C., Cayrel de Strobel, G., Mermilliod, J. C., Robichon, N., Kovalevsky, J. & Crifo, F. 1998, A&A, 331, 81
- Porto de Mello et al. (2006) Porto de Mello, G. F., del Peloso, E. F., Ghezzi, L. 2006, Astrobiology, 6, 308
- Porto de Mello et al. (2008) Porto de Mello, G. F., Lyra, W. & Keller, G. R 2008, A&A, 488, 653
- Powner et al. (2009) Powner, M. W., Gerland, B. & Sutherland, J. D. 2009, Nature, 459, 239
- Radick et al. (1995) Radick, R. R., Lockwood, G. W., Skiff, B. A., & Thompson, D. T. 1995, ApJ, 452, 332
- Ramírez et al. (2007) Ramírez, I., Allende-Prieto, C. & Lambert, D. L. 2007, A&A, 465, 271
- Ribas et al. (2005) Ribas, I., Guinan, E. F., Güdel, M., & Audard, M. 2005, ApJ, 622, 680 (Paper I)
- Rucinski et al. (2004) Rucinski, S. M., et al. 2004, PASP, 116, 1093
- Sackmann & Boothroyd (2003) Sackmann, I.-J., & Boothroyd, A. I. 2003, ApJ, 583, 1024
- Schilbach et al. (1995) Schilbach, E., Robichon, N., Souchay, J. & Guibert, J., 1995, A&A, 299, 696.
- Schuler et al. (2006) Schuler, S. C., King, J. R., Terndrup, D. M., Pinsonneault, M. H., Murray, N. & Hobbs, L. M. 2006, ApJ, 636, 432
- Sleep et al. (2004) Sleep, N. H., Meibom, A., Fridriksson, T., Coleman, R. G., & Bird, D. K. 2004, PNAS, 101, 12818
- Sneden (1973) Sneden C., 1973, Ph.D. thesis, University of Texas
- Soderblom et al. (1993) Soderblom, D. R, Fedele, S. D., Jones, B. F., Stauffer, J. R. & Prosser, C. F. 1993, AJ, 106, 1080
- Telleschi et al. (2005) Telleschi, A., Güdel, M., Briggs, K., Audard, M., Ness, J.-U., & Skinner, S. L. 2005, ApJ, 622, 653
- Thévenin & Idiart (1999) Thévenin, F. & Idiart, T. P. 1999, A&A, 521, 753
- Thuillier et al. (2004) Thuillier, G., Floyd, L., Woods, T., Cebula, R., Hisenrath, E., Herse, M., & Labs, D., 2004, in Solar variability and its effects on climate, AGU Geophysical Monograph 141, Eds. J. M. Pap and P. Fox.
- Valenti & Fischer (2005) Valenti, J. A., & Fischer, D. A. 2005, ApJS, 159, 141
- Walker et al. (2007) Walker, G. A. H., Croll, B., Kuschnig, R., Walker, A., Rucinski, S. M., Matthews, J. M., Guenther, D. B., Moffat, A. F. J., Sasselov, D., Weiss, W. W. 2007, ApJ, 659, 1611
- Wood et al. (2005) Wood, B. E., Redfield, S., Linsky, J. L., Müller, H.-R., & Zank, G. P. 2005, ApJS, 159, 118
- Yi et al. (2003) Yi, S. K., Kim, Y. C. & Demarque, P. 2003, ApJS, 144, 259
- Zahnle & Walker (1982) Zahnle, K. J., & Walker, J. C. G. 1982, Rev. Geophys. Space Phys., 20, 280