Prominent 5d-orbital contribution to the conduction electrons in gold
Abstract
We have examined the valence-band electronic structures of gold and silver in the same column in the periodic table with nominally filled d orbitals by means of a recently developed polarization-dependent hard x-ray photoemission. Contrary to a common expectation, it is found that the 5d-orbital electrons contribute prominently to the conduction electrons in gold while the conduction electrons in silver are to some extent free-electron-like with negligible 4d contribution, which could be related to a well-known fact that gold is more stable than silver in air. The 4d electron correlation effects are found to be essential for the conduction electron character in silver.
pacs:
71.20.Gj, 71.27.+a, 79.60.-iI Introduction
Single-element materials in the same column in the periodic table often show mutually similar features in such cases of alkaline (-earth) metals and halogens. On the other hand, it is known for noble metals with group 11 in the periodic table that gold has considerably different chemical stability from that of silver, although their Fermi surface topology dHvAAg ; dHvAAu and predicted band dispersion near the Fermi level () are mutually similar Auband2 ; Auband1 ; Agband1 ; Jepsen1 . For instance, it is well known that solid gold is very stable under many circumstances while solid silver is gradually oxidized in air. The valence-band electronic configurations of these solids per atom have so far been recognized Auband1 ; Agband1 ; PES1970 to be composed of fully occupied d states (d10) plus one conduction electron occupying an sp state ( for silver and for gold) although these configurations have not been experimentally verified to date. In this paper, however, we show that the 5d-orbital contribution to the conduction electrons is actually prominent in bulk gold while the above configuration is practically correct for bulk silver, by means of the linear polarization-dependent hard x-ray photoemission which we have very recently developed. These findings could be related to a well-known fact that gold is more stable than silver in air.
There are few experimental techniques to probe the orbital contributions in the valence-band electronic states of solids. Such spectroscopic technique as resonance photoemission AllenAP1986 ; Fujimorid1PES ; N2000 and surface-sensitive low-energy two-dimensional angle-resolved photoemission over wide emission angles D2PES are not practical at all for bulk polycrystalline gold and silver to quantitatively clarify the itinerant s, p and d orbital contributions to the conduction electrons. Rough information of the orbital contributions can be obtained from a comparison of angle-integrated valence-band photoemission spectra at considerably different excitation energies HAXPESAg ; MatsunamiYb08 such as 1 and 8 keV, for which the relative photoionization cross-sections depend on Scofield ; Lindau . However, the dependence of the spectra is often seen also by the different bulk/surface contribution ratio due to the different photoelectron kinetic energies ASPRL2004 , which prevents us to reliably estimate the orbital contributions.
At hard x-ray excitations, the photoelectron cross-sections for the s and p states per an electron become comparable to those for the d and f states whereas they are very small at soft x-ray excitations Scofield ; Pdep1 ; Pdep2 ; Pdep3 . This is also the case for gold and silver. Moreover, it has been predicted theoretically that the photoelectron angular distribution with respect to the angle between the two directions of photoelectron detection and the linear polarization (electric field) of incident light has strong orbital dependence. As an overall tendency, the calculation Pdep1 ; Pdep2 ; Pdep3 predicts that a ratio of the photoelectron intensity toward the direction perpendicular to the polarization vector () to that along the polarization vector (), defined as , is very small as 0.1 for the s and p () states compared with that ( 0.2) for the d and f states at = 5-10 keV. When we measure the hard x-ray valence-band photoemission HXPES2003 ; YamaSmOsSb ; YbB122009 spectra with different linear polarization, a photoelectron intensity ratio (hereafter simply called “ratio”) practically equivalent to ( should be much deviated from 90∘ as in our present experimental geometry with 30∘, see the inset of Figure 1) can be obtained. Therefore, the extraction of the s and p contributions as well as that of the d and f contributions in the bulk valence band, for which there has been no conclusive experimental technique to date as mentioned above, become feasible by the linear polarization-dependent hard x-ray photoemission measurements.
II Experimental
Polarization-dependent hard x-ray photoemission measurement was performed at BL19LXU of SPring-8 YabashiPRL01 with a 27-m long undulator by using a newly developed MBS A1-HE hemispherical photoelectron spectrometer. A Si 111 double-crystal monochromator selected 8 keV radiation with linear polarization along the horizontal direction (the so-called degree of linear polarization ), which was further monochromatized by a channel-cut crystal with the Si 444 reflection. In order to switch the linear polarization of the hard x-ray from the horizontal to vertical directions, a (100) diamond was used as a phase retarder MotoDia in the Laue geometry with the 220 reflection, which was placed downstream of the channel-cut crystal. The transmittance of the x-ray at 8 keV for the diamond was confirmed as 35%. of the x-ray downstream from the phase retarder was estimated as about , which corresponds to the linear polarization components along the horizontal and vertical directions of 10% and 90%, respectively. As shown in the inset of Figure 1, the emission direction of photoelectron to be detected was set within the horizontal plane, where between the light polarization and the electron emission angle was 30∘ (90∘) at the excitation with the horizontally (vertically) linear polarization.
The polycrystalline gold and sliver prepared by in situ evaporation were measured at 12-15 K, where the base pressure was 8 x 10⁻⁸ Pa. The energy resolution was set to 280 (400) meV for the measurement of silver (gold). The absence of the O 1s and C 1s spectral weight was confirmed. The spectral weights were normalized by the photon flux. It should be noted that this technique is useful even for polycrystalline samples as we demonstrate in this paper since the angular distribution depends mainly on , which is determined by the measurement geometry.
III Polarization dependence of the core-level spectra for gold
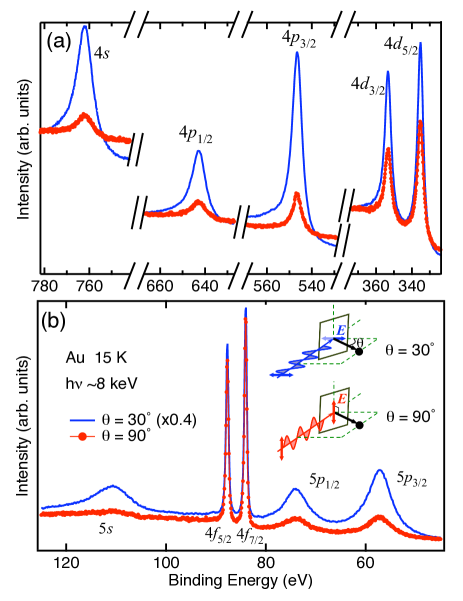
We show the polarization dependence of the core-level photoemission spectra for polycrystalline gold in Figure 1. The photoemission spectral weight at = 90∘ is more strongly suppressed compared with that at = 30∘ for the 4s, 4p, 5s and 5p core levels than for the 4f levels. The intensity ratios for the core levels estimated from our experimental data are consistent with the calculation Pdep1 ; Pdep2 ; Pdep3 as shown in Table 1 except for the s states. The experimentally estimated ratios for the 4s and 5s core levels are much larger than the predicted values from the calculation, but still smaller than those of the 4d and 4f states.
| 4s | 4p1/2 | 4p3/2 | 4d3/2 | 4d5/2 | 4f5/2 | 4f7/2 | 5s | 5p1/2 | 5p3/2 | |
|---|---|---|---|---|---|---|---|---|---|---|
| Experiment | 0.07 | 0.11 | 0.09 | 0.2 | 0.24 | 0.4 | 0.4 | 0.1 | 0.16 | 0.13 |
| Calculation | 0.02 | 0.1 | 0.07 | 0.24 | 0.3 | 0.54 | 0.54 | 0.02 | 0.1 | 0.07 |
IV Polarization-dependent valence-band spectra of silver and gold
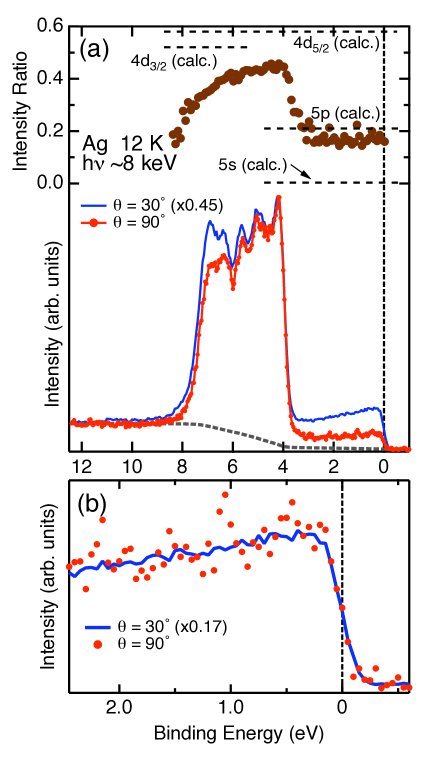
Figure 2 shows the polarization dependence of the valence-band spectra for polycrystalline silver. There is a strong spectral weight between 4 and 7 eV in both spectra at = 30∘ and 90∘, which is predominantly ascribed to the 4d contributions. Whereas this feature is consistent with the previous photoemission studies PES1970 ; HAXPESAg , it is found that the experimentally estimated in this energy region is consistent with the calculated ratio for the 4d excitations as shown in the upper panel of Figure 2(a). The experimental ratio decreases rapidly from 4 to 3 eV and then stays almost flat toward , indicating that the spectral weight near is strongly suppressed at = 90∘ compared with that of the 4d states in the region of eV. The intensity ratio near is larger than the calculated ratio for the 5s state and slightly less than that for the 5p state. The slope of the intensity from 2.5 eV to at both = 30∘ and 90∘ is qualitatively consistent with that of the partial density of states (PDOS) with s and p symmetries, which has been obtained by our band-structure (local density approximation, LDA) calculation by using the WIEN2k package Wien2k , but incompatible with that of the PDOS with d symmetry. These results reveal that the 4d bands are located far below and well separated from the conduction 5sp band in an energy region from to 3 eV. It is thus experimentally confirmed that the 4d orbitals are nearly fully occupied in the solid silver as expected for a long time, which has not been unfortunately verified by the previous high-energy photoemission HAXPESAg . The reduction of around 6.5 eV compared to that at 4.5 eV is mainly due to the mixture of the 5s state, which has been suggested by the previous band-structure calculations Agband1 ; Jepsen1 as well as our band-structure calculation.
We next show that the polarization dependence of the valence-band spectra for bulk gold is not only quantitatively but also qualitatively different from that for silver, as demonstrated in Figure 3. The intensity ratio , which hardly changes from 5 to 2 eV in the 5d band region, decreases gradually from 2 eV toward without showing a rapid suppression. The ratio in the vicinity of estimated as 0.22 is much larger than the calculated values for the 6s and 6p states. Even if for the 6s state is in fact larger than the calculated value and close to the experimentally obtained ratio as 0.1 for the 4s or 5s core-level state, in the vicinity of is still much larger than these values. In addition, the spectral line shape from to 1.5 eV is different between = 30∘ and 90∘ as shown in Figure 3(b), which is in contrast to that for silver in Figure 2(b). While the intensity is nearly flat or slightly enhanced from 1.5 eV to at = 30∘, it is gradually reduced toward at = 90∘. The different slope of the intensity for different suggests that the 5d-orbital contribution is extended into the region of eV and the additive 6sp-orbital components contribute in the spectrum at = 30∘.
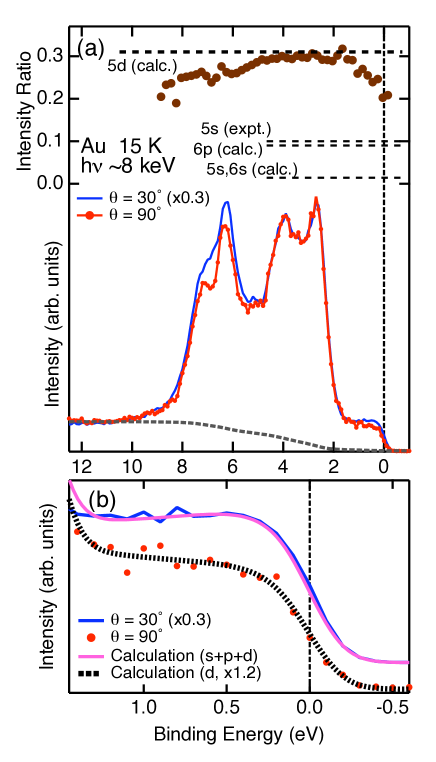
The polarization-dependent spectra of gold near are consistent with the result of the band-structure calculation. As shown in Figure 3, the spectrum at = 90∘ is excellently reproduced by the d PDOS whereas a naive sum of the s, p and d PDOS well simulates the spectrum at = 30∘. From a detailed analysis by comparison of the spectrum at = 30∘ with the results of the band-structure calculation, we have estimated the 5d weight to the total density of state at as 40-60%. On the other hand, we can estimate the 5d contribution from an analysis of in which the relative photoelectron cross-sections and angular distributions are taken into account (see Appendix). It should be noted that we do not need to use any information obtained from the band-structure calculation for this analysis. We have successfully estimated the 5d contribution in gold as % from the analysis of while the precise estimation is rather difficult because of possible deviations of the actual intensity ratios and cross-sections from the calculated values. The mutually consistent results from these two independent analyses undoubtedly indicate the prominent 5d contribution to the joint density of states in the energy range of 2 eV in gold.
V Discussions
The Fermi surface topology of the noble metals, which reflects a nature of the conduction electrons, is partially deviated from that expected for free electrons in crystalline solids dHvAAg ; dHvAAu . This has been shown theoretically to be resulting from the hybridization of the sp band with the d bands Auband1 ; Agband1 ; Jepsen1 . It has also been predicted that the d-sp hybridization near is quantitatively stronger for gold than for silver due to different energy and different degree of itinerancy between the 5d and 4d bands. Indeed, the experimentally observed threshold of the “d bands” by our and previous PES1970 ; HAXPESAg experiments is closer to for gold (2 eV) than for silver (4 eV) as shown in Figures 2 and 3. The strong itinerancy and d-sp hybridization for the 5d orbitals in gold are due to the relativistic effects as discussed for the long time Auband2 ; Auband1 ; Jepsen1 ; MattheissPt . Our findings, the prominent 5d contribution to the conduction electrons in gold and essentially negligible 4d mixture for silver, are understood as the results of the markedly different strength of d-sp mixing near . On the other hand, it should be noted that such a qualitative difference of the d mixture in the conduction band crossing has not been predicted from the band-structure calculations, in which additional electron correlation effects are not taken into account.
The stability or reactivity of solids in air has directly been discussed in terms of kinetic, thermodynamic and surface properties etc. by using a Born-Haber cycle, which are determined by such fundamental physical properties as crystal structure, lattice parameter, the nominal number of valence and conduction electrons, electronic dispersion near , Fermi surface topology and orbital symmetry of conduction electrons. On the other hand, the reactivity of the noble metals can also be discussed from a viewpoint of the electronic structure as seen in ref. Hammer, . Our results experimentally reveal one of few decisive differences in such properties as mentioned above between gold and silver. Namely, the conduction electrons in silver with the predominant 5sp character are more free-electron-like than those in gold, in which the 5d character is strongly mixed. This different orbital contribution to the conduction electrons could be related to the different stability in air between gold and silver. In addition to our results, it is known that platinum with fcc structure and nominal 5d96sp1 configuration is also very stable in air, for which a whole valence-band dispersions are predicted to be almost the same as those for gold except for the position of and therefore the 5d contribution to the conduction electrons is undoubtedly predominant MattheissPt . Considering this fact and our results, we can conclude that the prominent 5d contribution to the conduction electrons has a role to protect gold from the oxidation in air in addition to the preceding discussion Hammer , where the 5d orbitals are thought to be partially bound to the nucleus sites but considerably itinerant due to the relativistic effects. If the 5d contribution were negligible, gold would tend to be gradually oxidized in air as silver does. We note that a similar discussion of reactivity in terms of the d mixing in the conduction electrons is not applicable for copper even if the 3d contribution would be experimentally verified since the character of the 3d orbital is quite different from that of the 5d orbital. Indeed, both nickel (nominally 3d84sp2 or 3d94sp1) and zinc (nominally 3d104sp2) are not very stable in air.
We refer to possible other effects of the prominent 5d contribution to the conduction electrons in gold. Our result has revealed the presence of the intrinsic 5d holes in gold, which have previously been proposed from the results of the band-structure calculations Jepsen1 ; MattheissPt and the L2,3-edge x-ray absorption AuXAS although these studies have not given clear evidence of the 5d holes. [It should be noted that the 2p-6s and/or 2p-d () transitions also take place in addition to the 2p-5d transition in the L2,3-edge absorption.] It is expected that there are 5d holes even in recently investigaed gold nanoparticles showing magnetism MagAu due to the strong d-sp hybridization. The 5d holes will increase if the conduction electrons are transferred from the nanoparticles to neighbouring molecules as discussed in reference MagAu, . In such a situation, it is natural to consider a role of the 5d holes for the magnetism in the gold nanoparticles although our result does not give direct evidence of the 5d magnetism.
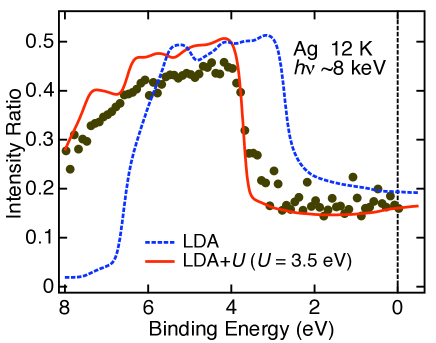
The band-structure calculations, in which all the valence-band electrons are treated as itinerant ones, basically give the results of conduction electrons with noticeable d-sp mixing for silver and gold. Such a calculated result well explain the experimental spectra of gold. For silver, the experimental 4d contribution in the spectra near is much less than that from the calculation. This deviation can be understood by considering the finite 4d electron correlation effects in silver. It is naturally expected that the correlated orbital contribution to the conduction electrons is suppressed due to the localization when the on-site Coulomb interactions are switched on, as seen for many rare-earth compounds. In order to verify whether the above scenario is correct for silver or not, we have also performed the LDA+-like LDAU97 calculation by using the linear muffin-tin orbital method LDA1 , in which the on-site Coulomb interaction value = 3.5 eV is applied to the 4d orbitals. Figure 4 shows the comparison of the ratio for silver with the predicted ratios from the calculations. One can notice that the LDA+ results better explain the experimental ratio near as well as in a wide valence-band region than the LDA calculation. We thus conclude that the 4d electron correlation effects are responsible for its negligible contribution to the conduction electrons in silver.
VI Conclusions
In conclusions, we have performed the polarization-dependent hard x-ray photoemission for gold and silver, from which the prominent 5d and negligible 4d contributions to the conduction electrons in gold and silver have been revealed. The 4d electron correlation effects are found to be essential for the negligible 4d contribution in silver.
Acknowledgements
We thank M. Suzuki, Y. Komura, Y. Tanaka, Y. Nakatsu, G. Kuwahara, A. Yamasaki, K. Mima, Y. Miyata, R. Yamaguchi, K. Terashima, T. Yokoi, S. Kitayama and K. Kimura for supporting the experiments. We are grateful to H. Tada, T. Kimura and T. Nakamura for discussions. This work was supported by Grant-in-Aid for Scientific Research (21740229, 21340101), Bilateral Programs with Russia, Innovative Areas (20102003) and the Global COE (G10) from MEXT and JSPS, Japan. IN thanks RFFI grants 08-02-00021, 08-02-91200, and grant of President of Russia MK-614.2009.2.
Appendix A Estimation of the 5d contribution to the conduction electrons in gold from the spectra
The intensity ratio in the vicinity of shown in the upper panel of Figure 3 (a), defined as , is experimentally obtained as . The ratio for the 5d5/2 states is calculated as 0.3 by using the parameters in references Pdep2, ; Pdep3, . We have calculated the ratio at the photoelectron kinetic energies of 1, 3, 5 and 10 keV and then obtained the above value at 8 keV by the interpolation since there are no calculation parameters for the 8-keV photoelectrons. As shown in Figure 3 (a), the calculated value for the 5d5/2 excitation is very close to the experimentally estimated ratio at the binding energy of 2-5 eV, which corresponds to the 5d-band region. for the 6sp band is assumed to be 0.1 because this value is very close to the value calculated (by the same manner as that for the 5d state described above) for the (Tl) 6p state and that for the 5s core-level excitation in our experiment (Figure 1). An photoemission intensity ratio per an electron of the 5d to 6sp states at = 30∘ and = 8 keV defined as , which has been expressed as a ratio of products of the calculated angular distribution at = 30∘ and the photoionization cross-section, has been estimated as . This value is not deviated very much from 1, therefore the experimental spectra near at = 30∘ can be well reproduced by the naive sum of the partial density of states as shown in Figure 3 (b). When is defined as the relative 5d contribution to the conduction electrons, and the relative 6sp contribution in the vicinity of is set to , the observed photoelectron intensity in the spectrum at = 30∘ is expressed as . Since the spectral weight is reduced at = 90∘ as the factor of 0.3 (0.1) for the 5d (6sp) states, the ratio is expressed as . Then we can estimate the 5d contribution as 0.5 when and .
References
- (1) Joseph A S and Thorsen A C 1965 Phys. Rev. 138 A1159
- (2) Joseph A S, Thorsen A C and Blum F A 1965 Phys. Rev. 140 A2046
- (3) Sommer C B and Amer H 1969 Phys. Rev. 188 1117
- (4) Christensen N E and Seraphin B O 1971 Phys. Rev. B 4 3321
- (5) Christensen N E 1972 Phys. Status Solidi B 54 551
- (6) Jepsen O, Glotzel D and Mackintosh A R 1981 Phys. Rev. B 23 2684
- (7) Eastman D E and Cashion J K 1970Phys. Rev. Lett. 24 310
- (8) Allen J W, Oh S J, Gunnarsson O, Schönhammer K, Maple M B, Torikachvili M S and Lindau I 1986 Advances in Physics 35 275
- (9) Fujimori A, Hase I, Namatame H, Fujishima Y, Tokura Y, Eisaki H, Uchida S, Takegahara K and de Groot F M F 1992 Phys. Rev. Lett. 69 1796
- (10) Sekiyama A, Iwasaki T, Matsuda K, Saitoh Y, Ōnuki Y and Suga S 2000 Nature 403 396
- (11) Nishimoto H, Nakatani T, Matsushita T, Imada S, Daimon H and Suga S 1996 J. Phys.: Condens. Matter 8 2715
- (12) Panaccione G et al. 2005 J. Phys.: Condens. Matter 17 2671
- (13) Matsunami M et al. 2008 Phys. Rev. B 78 195118
- (14) Scofield J H 1973 Lawrence Livermore Laboratory Report No. UCRL-51326
- (15) Yeh J J and Lindau I 1985 Atomic Data and Nuclear Data Tables 32 1
- (16) Sekiyama A et al. 2004 Phys. Rev. Lett. 93 156402
- (17) Trzhaskovskaya M B, Nefedov V I and Yarzhemsky V G 2001 Atomic Data and Nuclear Data Tables 77 97
- (18) Trzhaskovskaya M B, Nefedov V I and Yarzhemsky V G 2002 Atomic Data and Nuclear Data Tables 82 257
- (19) Trzhaskovskaya M B, Nikulin V K, Nefedov V I and Yarzhemsky V G 2006 Atomic Data and Nuclear Data Tables 92 245
- (20) Kobayashi K et al. 2003 Appl. Phys. Lett. 83 1005
- (21) Yamasaki A et al. 2007 Phys. Rev. Lett. 98 156402
- (22) Yamaguchi J et al. 2009 Phys. Rev. B 79 125121
- (23) Yabashi M, Tamasaku K and Ishikawa T, 2001 Phys. Rev. Lett. 87 140801
- (24) Suzuki M, Kawamura N, Mizumaki M, Urata A, Maruyama H, Goto S and Ishikawa T 1998 Jpn. J. Appl. Phys. 37 L1488
- (25) Blaha P, Schwarz K, Madsen G K H, Kvasnicka D and Luitz J 2001 WIEN2k, An Augmented Plane Wave + Local Orbitals Program for Calculating Crystal Properties (Karlheinz Schwarz, Techn. Universitat Wien, Austria) ISBN 3-9501031-1-2
- (26) Mattheiss L F and Dietz R E 1980 Phys. Rev. B 22 1663
- (27) Hammer B and Nørskov J K 1995 Nature 376 238
- (28) Zhang P and Sham T K 2002 Appl. Phys. Lett. 81 736
- (29) Yamamoto Y, Miura T, Suzuki M, Kawamura N, Miyagawa H, Nakamura T, Kobayashi K, Teranishi T and Hori H 2004 Phys. Rev. Lettl 93 116801
- (30) Anisimov V I, Aryasetiawan F and Lichtenstein A I 1997 J. Phys.: Condens. Matter 9 767
- (31) Andersen O K and Jepsen O 1984 Phys. Rev. Lett. 53 2571