Swimming against the current: Simulations of central AGN evolution in dynamic galaxy clusters
Abstract
We present a series of three-dimensional hydrodynamical simulations of central AGN driven jets in a dynamic, cosmologically evolved galaxy cluster. Extending previous work, we study jet powers ranging from erg/s to erg/s and in duration from Myr to Myr. We find that large-scale motions of cluster gas disrupt the AGN jets, causing energy to be distributed throughout the centre of the cluster, rather than confined to a narrow angle around the jet axis. Disruption of the jet also leads to the appearance of multiple disconnected X-ray bubbles from a long-duration AGN with a constant luminosity. This implies that observations of multiple bubbles in a cluster are not necessarily an expression of the AGN duty cycle. We find that the “sphere of influence” of the AGN, the radial scale within which the cluster is strongly affected by the jet, scales as . Increasing the duration of AGN activity does not increase the radius affected by the AGN significantly, but does change the magnitude of the AGN’s effects. How an AGN delivers energy to a cluster will determine where that energy is deposited: a high luminosity is needed to heat material outside the core of the cluster, while a low-luminosity, long-duration AGN is more efficient at heating the inner few tens of kpc.
keywords:
1 Introduction
The X-ray emitting gas in the centre of many galaxy clusters has a cooling time less than the Hubble time. Supported by large central concentrations in the surface brightness profile, early models of cluster evolution posited that cooling gas is funneled onto the central galaxy in the form of a cooling flow, ultimately resulting in a cooling catastrophe as more and more gas condenses out of the hot phase (Fabian 1994). However, high-resolution spectra of clusters show a lack of cool gas below a temperature floor of about one third of the virial temperature ( keV) and a lack of star formation at the levels expected for the early estimates of cooling rates in excess of 100 solar masses per year in powerful cooling flows (e.g., Peterson et al. 2001; Fabian et al. 2001; Kaastra et al. 2001; Tamura et al. 2001). The most natural interpretation is that some source of heat is preventing the gas from cooling. The heat source must respond to the cooling rate of the cluster gas in such a way that heating and cooling are balanced, on average, in a self-regulating feedback cycle.
Many different mechanisms for heating in clusters have been proposed, including AGN outflows, thermal conduction, dynamical friction, gravitational heating, cosmic rays and preheating, each either alone or in combination (see Conroy & Ostriker 2008; Brighenti & Mathews 2002 for reviews). However, recent studies have found evidence for AGN activity in the central galaxy of nearly all cooling-core clusters (Burns 1990; Mittal et al. 2009).
The now widely accepted picture is that radio-loud AGN inflate bubbles of under-dense, relativistic plasma which displaces the local ICM. The plasma bubbles appear as dark cavities in X-ray observations (see, for example, Bîrzan et al. 2004; Dunn & Fabian 2004; Rafferty et al. 2006). While the presence of cavities is ubiquitous, the longer term evolution of the plasma, and the direct effects on the gas are still uncertain and a topic of ongoing work (e.g. Reynolds et al. 2002; Ruszkowski et al. 2004b; Zanni et al. 2005; Gaibler et al. 2009).
Although it is possible that AGN outflows are not solely or primarily responsible for cluster feedback, understanding how AGN interact with the cluster environment is still necessary to understand how clusters evolve.
Interactions with the cluster environment can have an effect on other types of cluster heating. Recent work by Parrish et al. (2010) and Ruszkowski & Oh (2010) has found that turbulence in the cluster above a threshold value can suppress the heat-flux-driven buoyancy instability which would other wise inhibit thermal conduction. Turbulence can, therefore, allow efficient thermal conduction to occur, so it is important to understand the velocity structure of the cluster and how AGN alter that structure.
1.1 AGN simulations
The details of how an AGN delivers energy to the cluster are still largely unknown. Simulations of AGN jets or hot, under-dense bubble in idealized, spherically symmetric clusters have found that energy is confined to a narrow angle around the jet axis, rather than being spread throughout the cluster (e.g. Churazov et al. 2001; Reynolds et al. 2001; Saxton et al. 2001; Brüggen et al. 2002; Brüggen & Kaiser 2002; Reynolds et al. 2002; Ruszkowski et al. 2004a; Dalla Vecchia et al. 2004; Omma et al. 2004; Omma & Binney 2004; O’Neil et al. 2009; O’Neil & Jones 2010). Turbulence produced by RT instabilities has been shown to help in distributing energy and in producing a self-regulated AGN jet (Scannapieco & Brüggen 2008, Brüggen & Scannapieco 2009).
However, a simulation carried out by Heinz et al. (2006) found that in a realistic, cosmologically evolved cluster the motion of cluster gas effectively distributed the effects of the AGN over a wide angle. There is also observational evidence for the misalignment of radio jets and X-ray cavities in Abell 4059, presumably due to bulk motions in the ICM (Heinz et al. 2002). MHD simulations of clusters with AGN and turbulence from star formation (Falceta-Gonçlaves et al. 2010b) were able to distribute AGN energy isotropically and produce a filamentary structure similar to the observed in Perseus.
An alternate means of distributing energy over a wide angle is to change the properties of the AGN rather than the cluster. Two-dimensional simulations in spherically symmetric clusters of slow, wide opening angle jets (Sternberg et al. 2007) or narrow, rapidly precessing jets with a wide precession angle (Sternberg & Soker, 2008) have been able to effectively distribute energy in the cluster core. Three-dimensional simulations by Falceta-Gonçlaves et al. (2010a) of slowly precessing jets were also able to produce an approximately isotropic energy distribution. These simulations were also able to create multiple bubbles if a large precession angle () was used.
In this paper, we directly investigate the role of cluster weather and jet power, as well as the injection history, on the evolution of radio lobes and X-ray cavities in the ICM.
1.2 Jet intermittency
One critical question concerning the effect of jet activity is what the jet duty cycle is, i.e., what fraction of the time a black hole at the centre of a cool core cluster is actively driving a jet. The average jet power is often used to estimate the amount of AGN heating. However, the heating from a short, powerful period of AGN activity could be different from a long-lived, low-luminosity AGN that injects the same amount of total power.
Observations of multiple radially segregated sets of cavities in several clusters have been used to argue that jet activity is intermittent. Examples include Perseus (Böhringer et al. 1993; Fabian et al. 2000, 2003, 2006), Hydra A (Wise et al. 2007), Virgo (Forman et al. 2007), and Abell 262 (Clarke et al. 2009). The duty-cycle inferred from these observations has been taken as evidence for self-regulation between cooling of the central cluster gas and AGN activity on timescales of tens of millions of years. Similar arguments have been made on the basis of sound and shock waves observed in deep Chandra observations of nearby clusters (Virgo, Perseus), which associate an AGN outburst with every ripple.
As we will argue, the underlying assumption that surface brightness features can be associated one-to-one with activity in the central engine is likely overly optimistic. Sternberg & Soker (2009) have found that multiple sound waves can be excited by a single episode of bubble formation. Falceta-Gonçlaves et al. (2010a) were able to create multiple bubbles in simulations of a precessing AGN jet with a large precession angle. Cluster weather and the dynamic nature of the evolution of radio lobes can introduce features very similar to those observed in nearby clusters even in the case of continuously powered jets with no actual modulation of the jet power.
In this paper, we present the results of hydrodynamical simulations of AGN jets in a realistic galaxy cluster with a variety of AGN properties, focusing on how the interaction of the AGN with a dynamic ICM affects the evolution of the morphology and energy distribution of the AGN. The paper is arranged as follows: Section 2 describes the setup and technical details of our simulations, Section 3 presents the results and discusses the implications for cluster heating and observations, Section 4 presents a analytic toy model to estimate the characteristic timescale for an individual bubble form and break off from the jet, and Section 5 presents a summary of our results and conclusions.
2 Technical Description
2.1 Code description
Simulations are carried out using the FLASH 2.4 hydrodynamics code (Fryxell et al. 2000), which is a modular, block-structure adaptive mesh code. It solves the Riemann problem on a three-dimensional Cartesian grid using the piecewise-parabolic method. Our simulations include gravity from dark matter particles, advanced using a cosmological variable-time-step leapfrog method. Gravity is computed by solving Poisson’s equation with a multigrid method using isolated boundary conditions. Radiative cooling and star formation are not included in our simulations, but for the relatively short time simulated (200 Myr) these should not have a significant effect on the large scale evolution of the cluster and can be neglected. Gas is modeled as having a uniform adiabatic index of .
2.2 Initial Conditions
Our simulations are carried out in a dynamic cluster that has been extracted from a cosmological SPH simulation. The cluster is based on a rerun of the S2 cluster in Springel et al. 2001 and is identical to the cluster used in Heinz et al. (2006), Brüggen et al. (2007) and Heinz et al. (2010). Radiative cooling and star formation were included in the SPH simulation used to construct the cluster we use for our initial setup. The cluster is a massive, X-ray bright cluster with a mass of M☉ and a central temperature of keV. There is a net circular motion in the cluster centre as well as large directional motions spanning 100’s of kpc farther out, and a dynamically-induced cold front. This cluster is chosen specifically because it is not relaxed, allowing us to determine how the motion of cluster gas affects the evolution of the AGN jet.
Disturbed clusters are common in cosmological simulations (e.g. Burns et al. 2008) and in real clusters based on X-ray surface brightness analysis (e.g. Schuecker et al. 2001). Little is currently known about the detailed velocity structure of gas in galaxy clusters, but future high spectral resolution observations with the International X-ray Observatory (IXO) may be able to provide this information.
For comparison purposes, we have also carried out a control simulation in a hydrostatic cluster. The hydrostatic cluster is set up such that the radial gas density and gravitational profile are similar to the average profiles of our realistic cluster. The pressure is then set such that the cluster is in hydrostatic equilibrium everywhere, and the gas is stationary everywhere. The gas density profiles for this cluster is fit by the sum of two exponential functions with the form where is the radius in cm from the cluster centre and is the mass density in g/cm3. The values of can be found in Table 1. The gravitational potential profile is fit by a logarithm of the form where is the radius in cm from the cluster centre and is the gravitational potential. The values of can be found in Table 1.
| Parameter | Value |
|---|---|
2.3 Jet injection
The computational domain consists of a 2.8 Mpc3 box centred on the cluster. The maximum resolution is pc near the jet nozzle. Simulations are carried out by placing two oppositely directed jets at the centre of the gravitational potential of the cluster. The jet nozzle is modeled as two circular disks back-to-back with inflow boundaries, resolved by 12 grid elements in diameter. The nozzle faces obey inflow boundary conditions fixed by the mass-, momentum- and energy fluxes of the jet. Unresolved dynamical instabilities near the base of the jet are modeled by imposing a random-walk jitter on jet axis confined to a half-opening angle. This is necessary to model the ‘dentist’s drill’ effect of Scheuer (1982). Jet material is injected with a velocity of cm/s and an internal Mach number of 10 in all simulations.
The simulations we present vary in AGN luminosity and duration. Simulations 44, 45 and 46 have AGN luminosities of erg/s, erg/s and erg/s, respectively, and all 3 simulations have an AGN active for the first 30 Myr of the simulation. Simulations 45L and 45C have a luminosity of erg/s, the same as simulation 45, but the duration of AGN activity is increased to 90 Myr for simulation 45L and is continuous for the entire 200 Myr run time for simulation 45C. We also carry out a control simulation with no AGN present. Comparing cluster properties with and without an AGN at the same time allows us to separate the effects of the AGN from the dynamical evolution of the cluster gas. See table 2 for details of the setups for each simulation. All simulations are run for a total of 200 Myr.
The simulation carried out in the hydrostatic cluster (45S in table 2) is identical to simulation 45C, with an AGN luminosity of erg/s that is on continuously for 200 Myr.
| Name | Luminosity | Duration | Cluster |
|---|---|---|---|
| 44 | erg/s | 30 Myr | Realistic |
| 45 | erg/s | 30 Myr | Realistic |
| 46 | erg/s | 30 Myr | Realistic |
| 45L | erg/s | 90 Myr | Realistic |
| 45C | erg/s | Continuous | Realistic |
| 45S | erg/s | Continuous | Hydrostatic |
| Control | Realistic | ||
| Hydrostatic Control | Hydrostatic |
2.4 Visualization
The simulation output was virtually observed using the publicly available in-house tool XIM (see Heinz & Brüggen, 2009). Taking input grids from numerical hydrodynamic simulations, XIM performs spectral modeling of thermal emission, including Doppler shifts and ionization balance, using the APEC database to model the line emission. It then performs spectral projection along an arbitrary line–of–sight, PSF convolution, telescope and detector efficiency, and spectral convolution with the detector response (using the proper response files for current and future telescopes). Finally, it adds sky- and instrument backgrounds and Poisson counting error.
The code currently does not account for vignetting and uses a simplified mono-energetic PSF in the case of IXO simulations. However, the impact of these limitations on the predictions presented below should be small.
Our virtual observations use the Chandra ACIS instrument response. The broad-band images shown span an energy range from 0.3 keV to 7 keV. For direct comparison, the images were placed at the redshift of the Perseus cluster of z=0.01756. The exposure time was taken to be 250 ksec.
For the pseudo-synchrotron radio images shown below, we assume equipartition and a completely tangled magnetic field. The electrons are assumed to obey an powerlaw spectrum. Radio intensity is calculated as integrated along the line of sight, where is the local fraction of jet material and is local pressure. All radio images are plotted in arbitrary units, but on the same logarithmic scale, covering 4 orders of magnitude.
3 Results
3.1 Morphological description
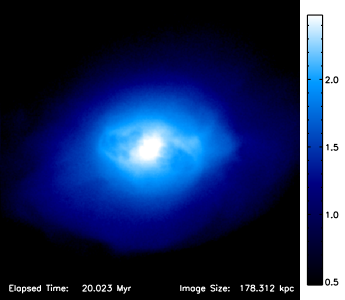
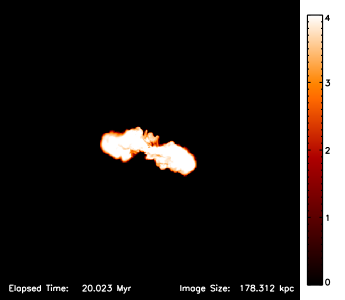
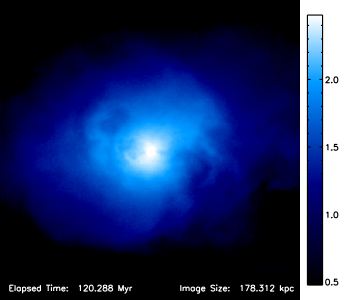
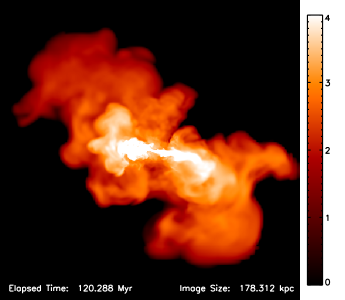
The generic features of all three base simulations (44, 45, 46) are similar. Figure 1 shows synthetic X-ray and radio images for simulation 45 after 20 Myr.
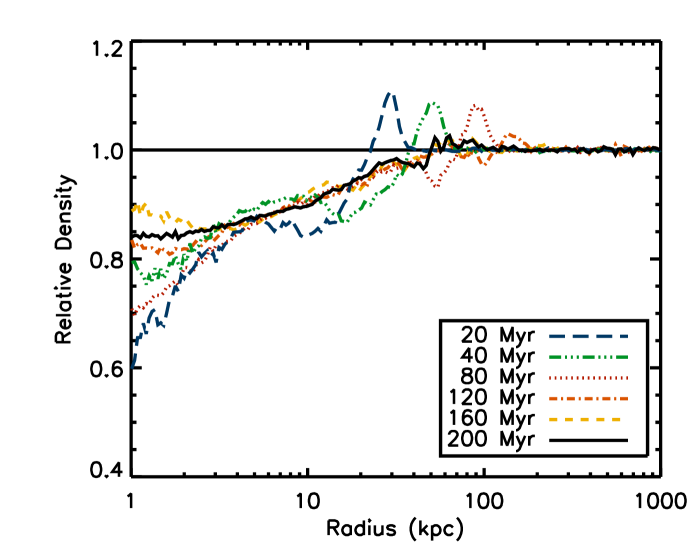
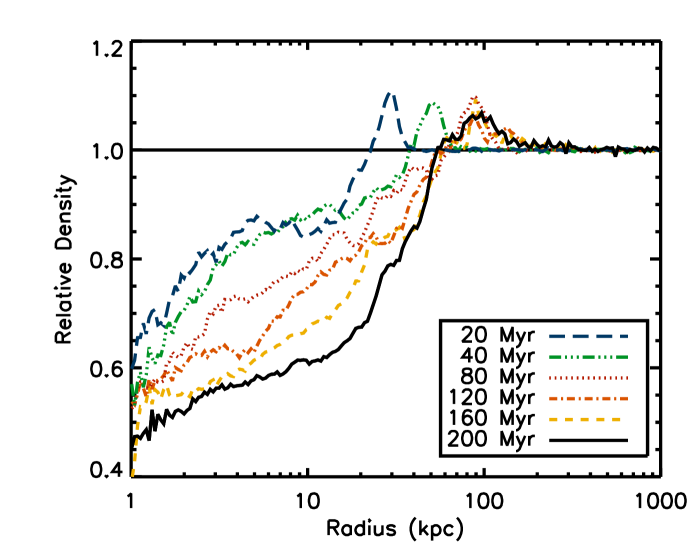
The AGN jet initially inflates a pair of low-density bubbles which appear morphologically similar to observations of X-ray bubbles and radio lobes. After the AGN turns off, these bubbles quickly decelerate and reach a fixed radius by about 100 Myr. Figure 2 shows the average density relative to a control simulation with no AGN vs. radius for simulation 45 at different times. The jet inflates a region of low density in the centre of the cluster and drives a high density wave outward. After the jet shuts off, the under-dense region expands for a while but after 120 Myr has a fixed extent of 50 kpc. The high-density region decelerates but continues to expand slowly, increasing in size from 160 kpc at 120 Myr to 250 kpc at 200 Myr.
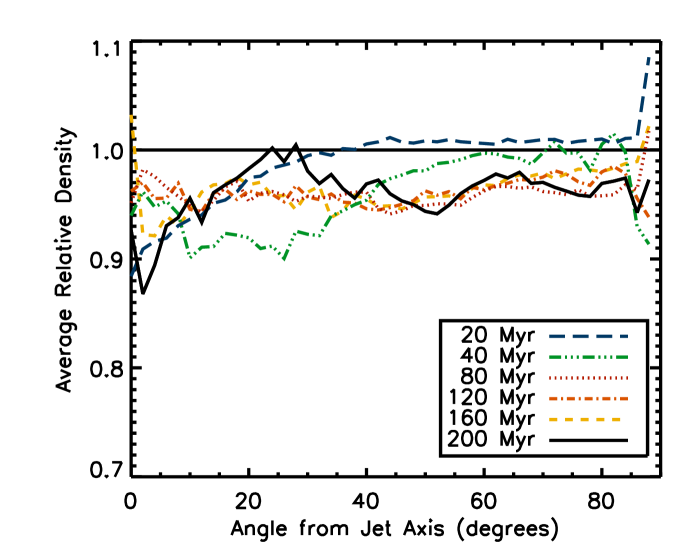
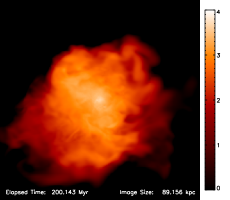
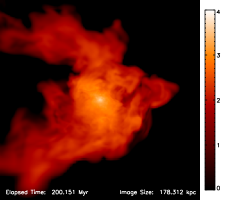
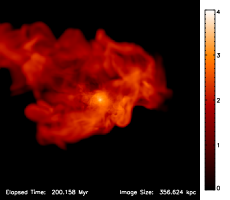
The evolution at later times is determined mainly by the motion of gas within the cluster. Looking at a plot of the angular dependence of average relative density within 50 kpc of the cluster centre (Fig. 3), we see the density decrease is concentrated within 30 degrees of the jet axis at 20 Myr, but by 80 Myr the decrease is nearly uniform across all angles. Large-scale flows within the cluster, in the form of turbulence, rotational motions and large-scale direction flows, effectively disrupt the bubbles and distribute them throughout the centre of the cluster. Figure 4 shows synthetic radio emission for simulations 44, 45 and 46 after 200 Myr. In all cases the jet material is well spread out and most of the information about the initial direction of the jet (left to right in the images shown) has been lost. However, the radius reached by the jet material increases with increasing energy. In Fig. 4 the size scale of the radio emission increases by about a factor of two for each factor of 10 increase in power.
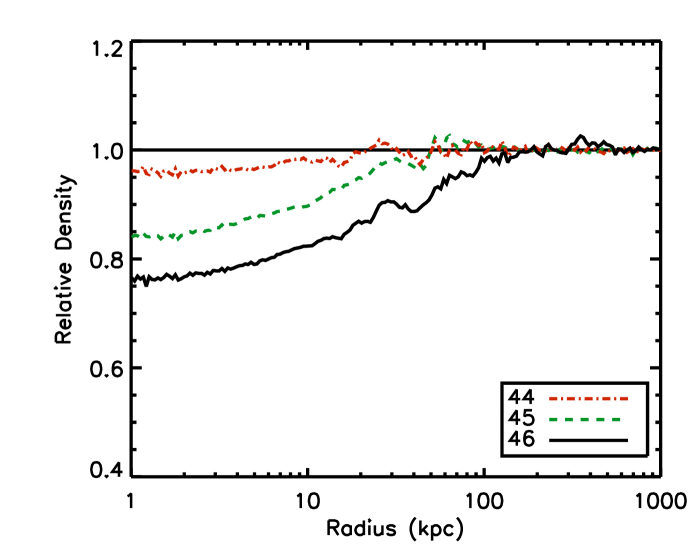
Plots of average density relative to a control simulation with no AGN vs. radius (Fig. 5) show a decrease in density in the centre of the cluster out to about 20 kpc, 50 kpc and 100 kpc for simulations 44, 45 and 46, respectively. This is consistent with the volume of density decrease scaling linearly with luminosity (or radius of density decrease ).
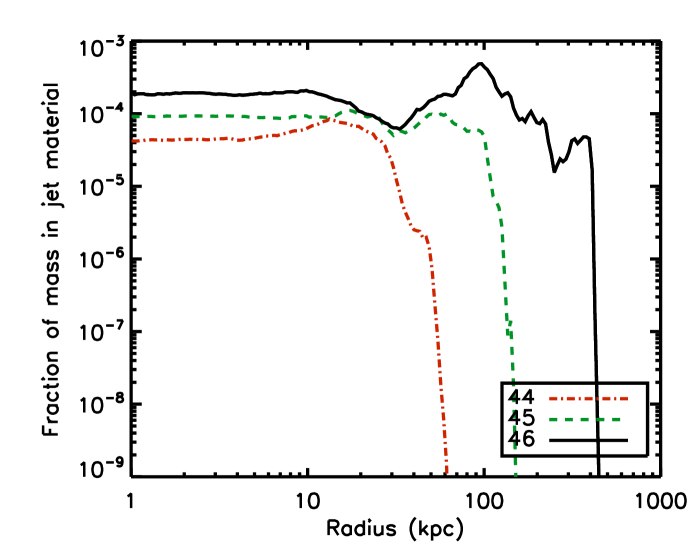
There are several ways that the “radius of AGN influence” can be defined. In addition to the radius of density decrease, the maximum radius that any jet material reaches and the maximum radius of the high-density wave surrounding the AGN can also be used. The maximum radius that any jet material reaches, corresponding to the maximum radius of any synthetic radio emission in Fig. 4, is about 60 kpc, 150 kpc and 450 kpc after 200 Myr for the 44, 45, and 46 run, respectively. The maximum radius reached by any jet material can also be seen as a sharp cutoff in Fig. 6, which plots the fraction of jet material vs. radius.
The maximum radius of the high-density wave corresponds to the maximum radius at which there is a density discrepancy in Fig. 5. The wave extends to about 100 kpc, 250 kpc and 500 kpc at 200 Myr in the three simulations. For any of these three definitions of “radius of AGN influence” the radius scales with luminosity roughly as at any time during the simulation.
The magnitude of the density decrease in the cluster also depends on AGN luminosity. In Fig. 5 the density decrease in the inner few kpc is about 5%, 15% and 25% for simulations 44, 45 and 46.
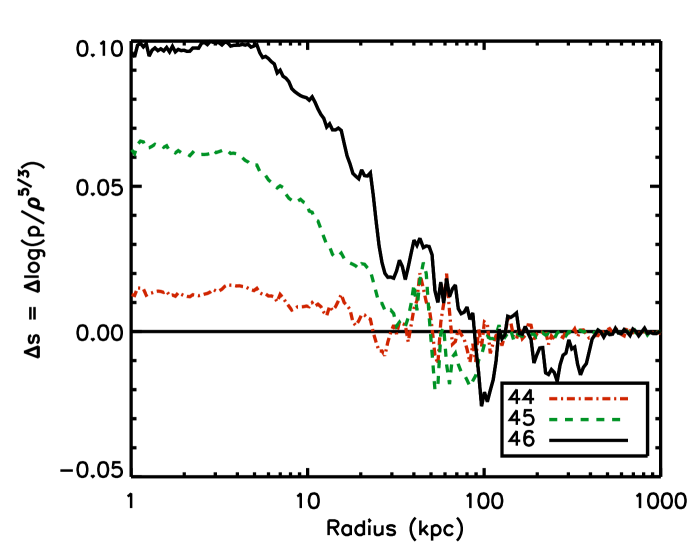
Other variables show a similar radial profile to the density plots. For example, Fig. 7 plots the average change in entropy for simulations 44, 45 and 46 at 200 Myr. There is an increase of entropy in the cluster centre corresponding to the decrease in average density within 20 kpc, 50 kpc and 100 kpc, respectively. The relative change in entropy also increases with luminosity, with values of , and in the inner few kpc. This indicates that most of the heating of the cluster gas is taking place near the centre of the cluster and in the region where the density has decreased most strongly. Outside the radius of density decrease the change in entropy is quite complex. Low entropy gas has been lifted out of the cluster centre and mixed with higher entropy gas while the AGN has prevented some gas from falling in as far as it would have otherwise. There are changes in entropy out to the shock radius, but they do not follow a consistent pattern.
3.2 Dependence on duty cycle
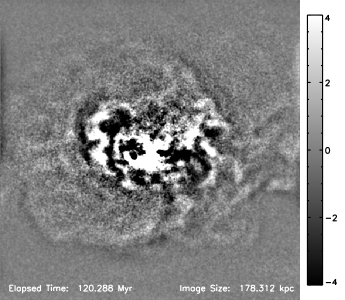
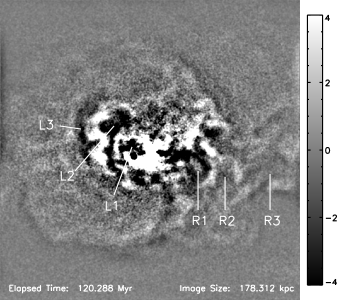
Our second group of simulations all have the same AGN luminosity of erg/s, but the AGN is active for different amounts of time: 30 Myr for simulation 45, 90 Myr for 45L and continuously until the end of the simulation at 200 Myr for 45C. The long-duration simulations begin identically to model 45 with the inflation of a pair of bubbles that are deflected by the large-scale circular motion of cluster gas. Eventually, the bubbles are sheared off and become disconnected from the jet. At this point the bubble is no longer powered, but continues rise and be pushed by the cluster gas, which moves the bubble away from the jet axis. The jet then inflates a second bubble behind the first which grows until it too is broken off and advected away. The cycle of bubble inflation and break off leads to the existence of multiple X-ray bubbles within the cluster. In simulation 45C, there are about 12 generations of bubble formation in 200 Myr. Figure 8 shows a synthetic Chandra X-ray image and synthetic radio image for simulation 45C after 120 Myr, produced in the same way as the images in Fig. 1. In the X-ray image (upper left panel) there is an inner bubble just to the left of the cluster centre (extending to about 20 kpc) and a second, outer bubble visible to the upper left of the cluster centre (extending to about 40 kpc). These two bubbles are also visible as distinct structures in the radio image (upper right panel).
Close examination of an unsharp-masked image (lower panels) shows these two bubbles (L1 and L2 in lower right panel) as well as a third (L3) immediately to the left of the second. All three of these bubble were formed by the AGN jet directed to the left. On the right, there is a fairly large bubble reaching 40 kpc (R1), outside of which there is a second possible bubble reaching 65 kpc (R2), and then a third reaching about 85 kpc (R3). Due to the low contrast between the interiors of bubbles R2 and R3 and their surroundings, they would likely be identified as waves rather than bubbles in an X-ray observation (see also Enßlin & Heinz (2002) for discussion of X-ray detectability of bubbles).
The radio image reveals an extended radio halo that goes beyond the bubbles identifiable in the X-ray images. However, there are several small ripples in the unsharp-masked images through the halo region. Morphologically, the radio image appears similar to observations of the extended radio emission of M87 (Owen et al. 2000), with a large radio bubble containing smaller, highly-structured lobes, which are in turn powered by narrow jets from the AGN.
The unsharp-mask image in the right panel of Fig. 8 and Fig. 3 from Fabian et al. 2003, produced using the same technique, both show multiple bubbles and sound waves with a similar size scale and morphology. Clearly, in this case any inference about the AGN duty cycle from the observation of sound waves or multiple generations of bubbles would be erroneous.
The break off of bubbles also limits the radius affected by the AGN. Figure 9 shows a time sequence of the average density relative to a control simulation with no AGN vs. radius for simulation 45C. The central density decrease expands to a radius of about 60 kpc by 80 Myr, but then the radius remains fixed at between 50 and 60 kpc, even though the AGN continues to inject energy. The density in the centre of the cluster continues to drop with time as more material is pushed out, but the material continues to pile up between 50 kpc and 250 kpc without increasing the size of the region being heated.
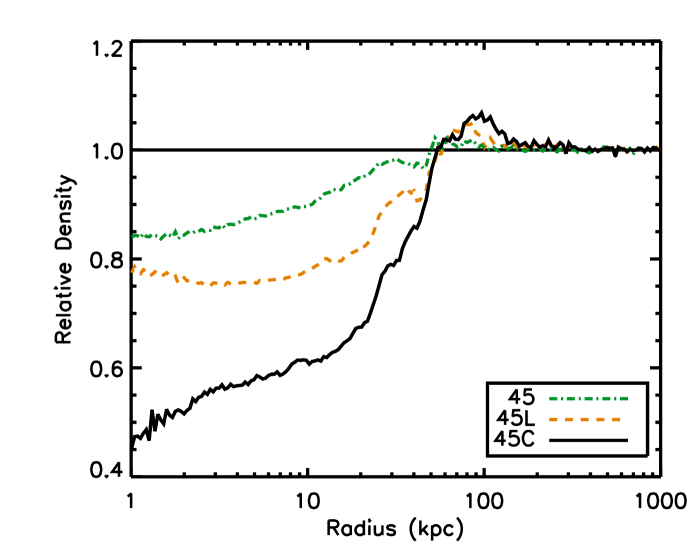
Figure 10 compares the relative density of simulations 45, 45L and 45C after 200 Myr. In all three cases the under-dense region extends to 50 to 60 kpc with an over-dense region extending to 250 kpc. The amount of material removed increases with AGN duration, with the density decreasing in the inner few kpc by about 15% for simulation 45, 25% for 45L and 40% for 45C. The density decrease for simulation 45L is nearly the same as simulation 46 (Fig. 5), although only 30% as much energy has been injected.
This indicates that the impact made by a central AGN depends not only on how much energy is injected but how it is injected. The jet luminosity determines the radius heated, while the amount of heating is determined by a combination of luminosity and duration. A high-luminosity jet can reach a larger radius, but a low-power, long-duration jet is more efficient at heating the centre of the cluster.
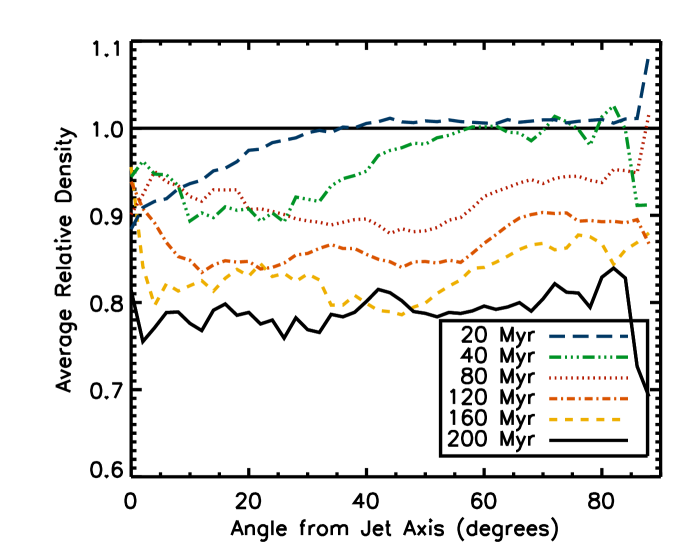
The density decrease is still well distributed in angle in all three simulations. Figure 11 plots the average relative density within 50 kpc for model 45C from 20 to 200 Myr. By 80 Myr, the density decrease is even distributed over all angles and remains so even as the density continues to decrease.
3.3 Comparison with Hydrostatic Simulation
To verify that it is the motion of gas within the cluster that determines the energy distribution, we have carried out one simulation in a spherically symmetric hydrostatic cluster for comparison. The hydrostatic cluster has similar initial spherically averaged mass and density profiles, but the radial pressure profile is adjusted to obey hydrostatic balance. The result is a central temperature about higher than in the dynamic cluster to compensate for the lack of any rotational support. For simulation 45S, we injected jets in the cluster centre with a luminosity of erg/s for the entire 200 Myr of the simulation. This is identical to the setup for simulation 45C, aside from the different cluster environment.
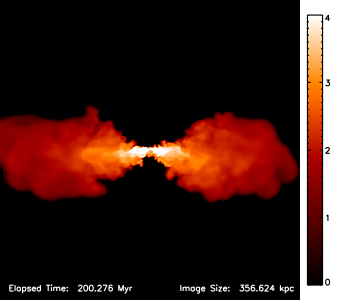
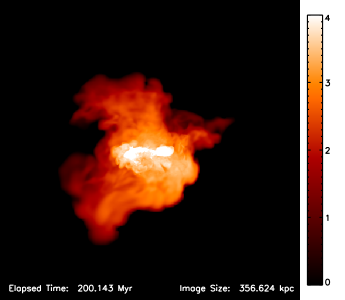
A morphological comparison of synthetic radio emission from simulation 45S and 45C at 200 Myr (Fig. 12) shows clear differences between the two cluster setups. In the hydrostatic case (left panel), the two large radio bubbles have been inflated to the left and right of the cluster centre, aligned with the jet axis. Most jet material is within 20 degrees of the jet axis. In the realistic cluster, jet material is spread in all direction around the cluster centre. Jet material has also propagated farther from the cluster centre, out to a maximum of about 200 kpc, rather than a maximum of about 150 kpc in the realistic cluster. This indicates that it is the motion of gas in the cluster that spreads AGN material in angle and limits it in radius.
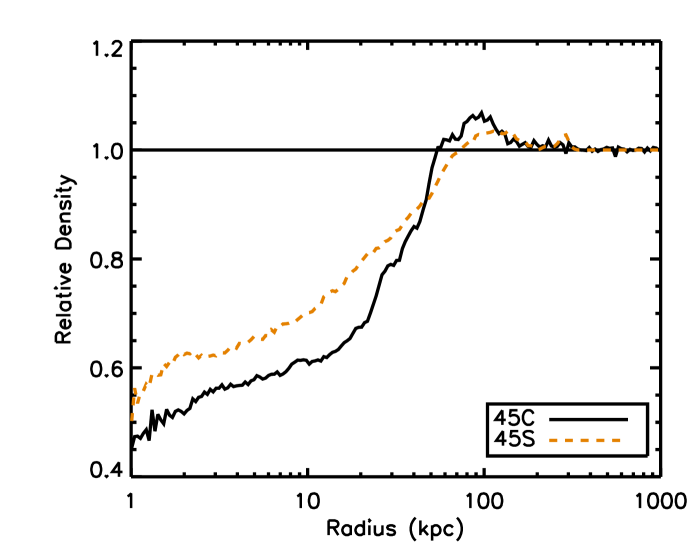
The differences between a static and a dynamic cluster can also be seen in the density profiles of the two simulations. Figure 13 plots the relative density vs. radius at 200 Myr for simulations 45C (realistic cluster) and 45S (hydrostatic cluster). The density decrease in the hydrostatic case extends to about 80 kpc, rather than 50 kpc, and the over-dense region reaches 300 kpc, rather than 250 kpc.
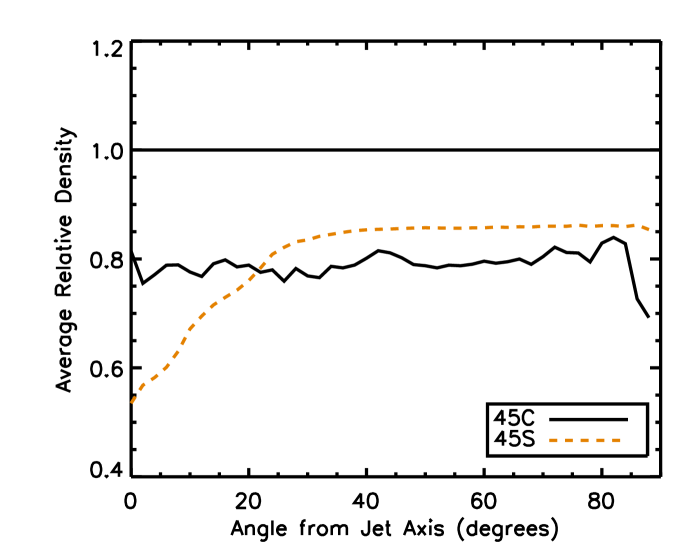
Figure 14 plots the average relative density within 50 kpc for the two simulations at 200 Myr. While the hydrostatic cluster simulation does have a density decrease at all angles, the effect is about a factor of 2 stronger near the jet axis compared to 30 degrees off axis, whereas the dynamic cluster simulation has a uniform decrease at all angles.
4 Analytic Model
The scaling of radius with luminosity and the insensitivity of radius to jet duration can be understood with an analytic toy model that produces a characteristic timescale for bubble formation. The jet initially inflates an expanding cocoon with the internal pressure balancing the ram pressure of the expanding shock, , where is the radius of the external shock.
Following Kaiser & Alexander (1997) and Heinz et al. (1998), for a density profile of the form
| (1) |
where is the density at radius , there is a self-similar solution for the radius of the shock
| (2) |
where
| (3) |
and is the time at which , is the jet luminosity and is a constant taken from Heinz et al. (1998). The pressure in the cocoon then takes the form
| (4) |
which decreases with time as . Because there is a circular motion in our cluster, there is an additional component of ram pressure on one side of each jet. In the inner 10 kpc of the cluster, density scales approximately as and velocity scales as , so the ram pressure due to circular motion is roughly constant, with a value of dyne/cm2. When the pressure in the cocoon drops below this value, the base of the cocoon will collapse and expanding bubble will be cut off from the jet. Setting from Eqn. 4 equal to , we can find the time for which the bubble will be cut off. Outside the cluster centre, the density can be approximated by a power law with and g/cm3 for kpc Using these values, we find a cutoff time, of
| (5) |
where erg/s. This time corresponds to a shock radius of
| (6) |
In our simulations, the cutoff time appears to be about 20 Myr and the size of the cocoon at the cutoff time is about 40 kpc for the erg/s simulations, but for a toy model using a very simple density structure this is a reasonably close prediction. Once the bubble is cut off, no more energy is added and it continues to expand and evolve independent of continued jet activity. The cutoff time scales very weakly with luminosity (), so the energy in the bubble when it is cut off will scale as . The radius at the cutoff scales as , quite close to the seen in our simulations.
After cutoff, the shock will continue to expand but without additional energy input. If the expansion remains supersonic, it will follow a Sedov-Taylor solution for an expanding shock, with which is in this case (Chevalier 1976). This is roughly consistent with the continued slow expansion seen in our simulations and is again close to .
After the first bubble breaks off, the centre of the cluster is filled in with dense material and a new cocoon must form. If the jet remains active, the new cocoon will go through the same process of growth and breakoff as the first. Assuming the first bubble is advected away from the jet axis, the second bubble will be expanding into a density gradient similar to the first, so the time and size scale for the second breakoff will be similar as well. The energy in the first bubble sets the maximum radius reached in the simulation, with subsequent bubbles following a similar expansion history. Cutting off the bubble near the base of the jet provides an explanation for multiple generations of bubble formation with a timescale determined by the cluster parameters.
In our simulations, the radius of density decrease (and entropy increase) appears to approximately correspond to the radius of the shock at the time the first bubble breaks off. Although disconnected bubbles rise beyond this radius, it may be that the strongest effects are limited to the region where the bubbles are still powered.
5 Summary and Conclusions
We have carried out a series of high-resolution hydrodynamic simulations of AGN jets in the centres of galaxy clusters. Simulations are carried out in a realistic, dynamic cluster and cover a range of AGN luminosities and durations.
We find that the interaction of AGN jets with the motion of cluster gas is critical for determining the evolution of both the cluster and radio lobes. In particular, we find that:
-
•
Multiple bubbles can be formed from a single period of AGN activity with a constant luminosity. As the AGN develops, bubbles can be broken off from the jet by the motion of gas within the cluster, leading to many generation of bubble formation. These bubbles can be pushed away from the jet axis by cluster weather. Therefore, observations of multiple X-ray or radio bubbles in a cluster does not necessarily give you any information about the duty cycle of the AGN or about the past alignment of the AGN jet.
-
•
A toy model balancing pressure in an expanding cocoon against ram pressure due to circular motion in the cluster core provides a reasonable estimate for the timescale of bubble breakoff.
-
•
Energy from the AGN is distributed over all angles by large-scale motions in the cluster. Jet material is distributed throughout the centre of the cluster and any information about the original orientation of the jet is lost on a time scale of about 100 Myr. This is not the case in a hydrostatic cluster, where the absence of large-scale flows allows the jets to propagate without being deflected.
-
•
A jet of a given luminosity will create a low-density, high-entropy cavity that expands to a fixed radius and then stops, limited by the interaction with large-scale flows in the cluster. The radius reached scales approximately as . The exact radius reached is likely to depend on the detailed velocity and density structure within the cluster, but it does indicate that only high-luminosity AGN will be able to directly heat gas at 100 kpc or more from the cluster centre.
-
•
How an AGN delivers its energy determines where that energy ends up in the cluster. Lower luminosity AGN that are active for long periods are more efficient at heating the inner few 10’s of kpc, while high luminosity AGN are necessary to deliver energy to large radii. In our simulations, an AGN with a luminosity of erg/s that was active for 90 Myr was as effective at removing mass and increasing entropy in the inner 30 kpc of the cluster as a erg/s AGN active for 30 Myr, despite emitting only 30% as much total power. However, the effects of the erg/s AGN were limited to half the radius of the erg/s AGN.
-
•
In a hydrostatic cluster, AGN evolution is quite different. A long-duration AGN inflates two large bubbles rather than many smaller ones. Jet material remains concentrated near the jet axis and the radius reached by the jet material continues to increase with time beyond the value we find in the dynamic case.
The relationship between jet power and the radius of the jets “sphere of influence” has consequences for the impact jets have on clusters. The strong effect that the motion of cluster gas has on the AGN development means that exactly how and where an AGN deposits energy will be strongly affected by the inflation history of the jet and the dynamical state of the cluster.
Low-power AGN are more efficient at heating the central cluster, but the heat is confined, implying that an additional heat source may be needed farther from the centre of the cluster. One possible heat source is conduction of heat from warm gas in the outer cluster to cooling gas toward the centre. Recent work by Parrish et al. (2010) and Ruszkowski & Oh (2010) has shown that turbulence can suppress the heat-flux-driven buoyancy instability and allow efficient thermal conduction to occur. AGN activity can act as a source of turbulence, potentially providing a switch that allows conduction to occur when an AGN is active. Heinz et al. (2010), using some of the same simulations presented here, found an increase in the turbulent velocity dispersion of cluster gas due to AGN activity of up to several km s-1.
Central heating in cooling flows (where the entropy has to be injected in a relatively small volume) is more likely to result from continuously operating lower power jet than episodic powerful outbursts. This is, in a sense, numerical confirmation of the effervescent model, where continuous low-level activity generated multiple generations of bubbles (Ruszkowski & Begelman 2002). However, in our case, the effect of cluster weather is primarily responsible for breaking off bubbles, not necessarily the bubble’s buoyant escape.
The initial structure of a cluster will play a large role in determining the specific morphology of an AGN outflow. Although we only use one realistic cluster setup for our simulations, it is clear that the assumption of a simple one-to-one correspondence between observations of X-ray cavities or waves and periods of activity from an intermittent AGN is not valid. Multiple bubbles could be formed by intermittent AGN activity, but it is possible to produce multiple generations of X-ray bubbles from a single, continuously active AGN.
The simulations presented here do not include magnetic fields. The presence of magnetic fields could stabilize the bubbles created by the AGN, allowing them to rise farther away from the cluster centre before becoming disrupted (Ruszkowski et al. 2007). Observations of an increase in X-ray cavity size with distance from the cluster centre have been interpreted as favoring a current-dominated MHD jet model (Diehl et al. 2008). However, Brüggen et al. (2009) argued that pure hydro simulations could produce similar observations. Even if the bubble evolution is not dominated by magnetic fields, the presence of weak magnetic fields will affect the mixing of jet and cluster material and can change where energy is deposited. Future simulations including realistic magnetic fields will assess the effect of magnetic fields on cluster evolution.
Acknowledgments
BM and SH acknowledge support from NSF grant 0707682. MB acknowledges support from the DFG under grant BR 2026/3 within the Priority Programme “Witnesses of Cosmic History.” MR acknowledges support from NASA Chandra theory grant TM8-9011X. The software used in this work was in part developed by the DOE-supported ASC/Alliance Center for Astrophysical Thermonuclear Flashes at the University of Chicago.
References
- [1] Bîrzan L., Rafferty D. A., McNamara B. R., Wise M. W., Nulsen P. E. J., 2004, ApJ, 607, 800
- [2] Böhringer H., Voges W., Fabian A. C., Edge A. C., Neumann D. M., 1993, MNRAS, 264, L25
- [3] Brighenti F., Mathews W. G., 2002, ApJ, 573, 542
- [4] Brüggen M., Kaiser C. R., 2002, Nat, 418, 301
- [5] Brüggen M., Scannapieco E., 2009, MNRAS, 398, 548
- [6] Brüggen M., Kaiser C. R., Churazov E., Enßlin T. A., 2002, MNRAS, 331, 545
- [7] Brüggen M., Heinz S., Roediger E., Ruszkowski M., Simionescu A., 2007, MNRAS, 380, L67
- [8] Brüggen M., Scannapieco E., Heinz S., 2009, MNRAS, 395, 2210
- [9] Burns J. O., 1990, AJ, 99, 14
- [10] Burns J. O., Hallman E. J., Gantner B., Motl P. M., Norman M. L., 2008, ApJ. 675, 1125
- [11] Chevalier R. A., 1976, ApJ, 207, 872
- [12] Churazov E., Brüggen M., Kaiser C. R., Böhringer H., Forman W., 2001, ApJ, 554, 261
- [13] Clarke T. E., Blanton E. L., Sarazin C. L., Anderson L. D., Gopal-Krishna, Douglass E. M., Kassim N. E., 2009, ApJ, 697, 1481
- [14] Conroy C., Ostriker J. P., 2008, ApJ, 681, 151
- [15] Dalla Vecchia C. Bower R. G., Theuns T., Balogh M. L., Mazzotta P., Frenk C. S., 2004, MNRAS, 355, 995
- [16] Diehl S., Li H., Fryer C. L., Rafferty D., 2008, ApJ, 687, 173
- [17] Dunn R. J. H., Fabian A. C., 2006, MNRAS, 373, 959
- [18] Enßlin T. A., Heinz S., 2002, A&A, 384, L27
- [19] Fabian A. C., 1994, ARA&A, 32, 277
- [20] Fabian A. C., Sanders J. S., Ettori S., Taylor G. B., Allen S. W., Crawford C. S., Iwasawa K., Johnstone R. M., Ogle P. M., 2000, MNRAS, 318, L65
- [21] Fabian A. C., Mushotzky R. F., Nulsen P. E. J., Peterson J. R., 2001, MNRAS, 321, L20
- [22] Fabian A. C., Sanders J. S., Allen S. W., Crawford C. S., Iwasawa K., Johnstone R. M., Schmidt R. W., Taylor G. B., 2003, MNRAS, 344, L43
- [23] Fabian A. C., Sanders J. S., Taylor G. B., Allen S. W., Crawford C. S., Johnstone R. M., Iwasawa K., 2006, MNRAS, 366, 417
- [24] Falceta-Gonçlaves D., Caproni A., Abraham Z., Teixeira D. M., de Gouveia Dal Pino E. M., 2010a, AJ, 713, L74
- [25] Falceta-Gonçlaves D., de Gouveia Dal Pino E. M., Gallagher J. S., Lazarian A., 2010b, AJ, 708, L57
- [26] Forman W., Jones C., Churazov E., Markevitch M., Nulsen P., Vikhlinin A., Begelman M., Böhringer H., Eilek J., Heinz S., Kraft R., Owen F., Pahre M., 2007, ApJ, 665, 1057
- [27] Fryxell B., Olson K., Ricker P., 2000, ApJS, 131, 273
- [28] Gaibler V., Krause M., Camenzind M., 2009, MNRAS, 400, 1785
- [29] Heinz S., Brüggen M., 2009, ApJS submitted, arXiv:0903.0043
- [30] Heinz S., Reynolds C. R., Begelman M. C., 1998, ApJ, 501, 126
- [31] Heinz S., Choi Y., Reynolds C. S., Begelman M. C., 2002, ApJ, 569, L79
- [32] Heinz S., Brüggen M., Young A., Levesque E., 2006, MNRAS, 373, L65
- [33] Heinz S., Brüggen M., Morsony B., 2010, ApJ, 708, 462
- [34] Kaastra J. S., Ferrigno C., Tamura T., Paerels F. B. S., Peterson J. R., Mittaz J. P. D., 2001, A&A, 365, L99
- [35] Kaiser C. R., Alexander P., 1997, MNRAS, 286, 215
- [36] Mittal R., Hudson D. S., Reiprich T. H., Clarke T., 2009, A&A, 501, 835
- [37] O’Neil S. M., Jones T. W., 2010, ApJ, 710, 180
- [38] O’Neil S. M., De Young D. S., Jones T. W., 2009 ApJ, 694, 1317
- [39] Omma H., Binney J., 2004, MNRAS, 350, L13
- [40] Omma H., Binney J., Bryan G., Slyz A., 2004, MNRAS, 348, 1105
- [41] Owen F. N., Eilek J. A., Kassim N. E., 2000, ApJ 543, 611
- [42] Parrish I. J., Quataert E., Sharma P., 2010, ApJ, 712, L194
- [43] Peterson J. R., Paerels F. B. S., Kaastra J. S., Arnaud M., Reiprich T. H., Fabian A. C., Mushotzky R. F., Jernigan J. G., Sakelliou I., 2001, A&A, 365, 104
- [44] Rafferty D. A., McNamara B. R., Nulsen P. E. J., Wise M. W., 2006, ApJ, 652, 216
- [45] Reynolds C. S., Heinz S., Begelman M. C., 2001, ApJ, 549, L179
- [46] Reynolds C. S., Heinz S., Begelman M. C., 2002, MNRAS, 332, 271
- [Ruszkowski & Begelman(2002)] Ruszkowski M., Begelman M. C., 2002, ApJ, 581, 223
- [47] Ruszkowski M., Oh S. P., 2010, ApJ, 713, 1332
- [48] Ruszkowski M., Brüggen M., Begelman M. C., 2004a, ApJ, 611, 158
- [49] Ruszkowski M., Brüggen M., Begelman M. C., 2004b, ApJ, 615, 675
- [Ruszkowski et al.(2007)] Ruszkowski M., Enßlin T. A., Brüggen M., Heinz S., Pfrommer C., 2007, MNRAS, 378, 662
- [50] Saxton C. J., Sutherland R. S., Bicknell G. V., 2001, ApJ, 563, 103
- [51] Scannapieco E., Brüggen M., 2008, ApJ, 686, 927
- [52] Scheuer P. A. G., 1982, in Heeschen D. S., Wade C. M., eds, Proc. IAU Symp. 97, Extragalactic Radio Sources. Reidel, Dordrecht, p. 163
- [53] Schuecker P., Böhringer H., Reiprich T. H., Feretti L., 2001, A&A, 378, 408
- [54] Springel V., White M., Hernquist L., 2001, ApJ, 549, 681
- [55] Sternberg A., Soker N., 2008, MNRAS, 384, 1327
- [56] Sternberg A., Soker N., 2009, MNRAS, 395, 228
- [57] Sternberg A., Pizzolato F., Soker N., 2007, ApJ, 656, L5
- [58] Tamura T., Kaastra J. S., Peterson J. R., Paerels F. B. S., Mittaz J. P. D., Trudolyubov S. P., Stewart G., Fabian A. C., Mushotzky R. F., Lumb D. H., Ikebe Y., 2001, A&A, 365, L87
- [59] Wise M. W., McNamara B. R., Nulsen P. E. J., Houck J. C., David L. P., 2007, ApJ, 659, 1153
- [60] Zanni C., Murante G., Bodo G., Massaglia S., Rossi P., Ferrari A., 2005, A&A, 429, 399