Towards a Complete Census of AGNs in Nearby Galaxies: The Incidence of Growing Black Holes
Abstract
We investigate the local supermassive black hole (SMBH) density function and relative mass accretion rates of all active galactic nuclei (AGNs) identified in a volume-limited sample of infrared (IR) bright galaxies () to Mpc (Goulding & Alexander 2009). A database of accurate SMBH mass () estimates is compiled from literature sources using physically motivated AGN modeling techniques (reverberation mapping, maser mapping and gas kinematics) and well-established indirect estimation methods (the M- and – relations). For the three sources without previously published estimates, we use 2MASS -band imaging and galfit to constrain the bulge luminosities, and hence SMBH masses. In general, we find the AGNs in the sample host SMBHs which are spread over a wide mass range (–), but with the majority in the poorly studied – region. Using sensitive hard X-ray (2–10 keV) and mid-IR constraints we calculate the bolometric luminosities of the AGNs () and use them to estimate relative mass accretion rates. We use these data to calculate the volume-average SMBH growth rate of galaxies in the local Universe and find that the AGNs hosting SMBHs in the mass range – are dominated by optically unidentified AGNs. These relatively small SMBHs are acquiring a significant proportion of their mass in the present-day, and are amongst the most rapidly growing in the local Universe (SMBH mass doubling times of 6 Gyrs). Additionally, we find tentative evidence for an increasing volume-weighted AGN fraction with decreasing SMBH mass in the – range. Overall, we conclude that significant mass accretion onto small SMBHs may be missed in even the most sensitive optical surveys due to absent or weak optical AGN signatures.
keywords:
galaxies: active – galaxies: evolution – galaxies: nuclei – infrared: galaxies1 Introduction
It is now well established that all massive galaxies (–) in the local Universe harbour central super-massive black holes (SMBHs), with masses proportional to those of their stellar spheroids (hereafter, bulge; e.g., Kormendy & Richstone 1995; Magorrian et al. 1998). Comparisons between the SMBH mass density in the local Universe and the total energy produced by active galactic nuclei (AGNs) across cosmic time have shown that these SMBHs were primarily grown through mass-accretion events (e.g., Soltan 1982; Rees 1984; Marconi et al. 2004). The space density of high-luminosity AGNs appears to have peaked at higher redshifts than lower-luminosity AGNs, suggesting that the most massive SMBHs (–) grew first, a result commonly referred to as ‘AGN cosmic downsizing’ (e.g., Cowie et al. 2003; Ueda et al. 2003; McLure & Dunlop 2004; Hasinger et al. 2005; Alonso-Herrero et al. 2008). Extrapolation of these results imply that the most rapidly growing SMBHs in the nearby Universe should be of comparatively low mass (). To determine the characteristic masses of these growing SMBHs requires a complete census of AGN activity and SMBH masses in the local Universe.
Using data from the Sloan Digital Sky Survey (SDSS; York et al., 2000) in conjunction with the well established SMBH–stellar velocity dispersion relation (hereafter, M–; e.g., Gebhardt et al. 2000; Tremaine et al. 2002), Heckman et al. (2004; hereafter, H04) deduced that relatively low mass SMBHs () residing in moderately massive bulge-dominated galaxies host the majority of present-day accretion onto SMBHs. However, the space density of SMBHs derived from the M– relation in the optical survey of H04 was limited by the spectral resolution of the SDSS () to SMBHs of (assuming the M– relation of Gebhardt et al. 2000). Furthermore, due to attenuation of optical emission by dust, source selection and AGN classification at optical wavelengths will be biased against gas-rich, dust-obscured objects. These surveys are unlikely to include galaxies hosting the smallest bulges, and consequently the lowest mass SMBHs, and may therefore be missing a significant proportion of SMBH growth in the local Universe. Indeed, the nearby Scd galaxy, NGC 4945, hosting a low-mass SMBH (; Greenhill et al. 1997) only displays evidence for AGN activity in X-ray (Iwasawa et al., 1993) and mid-infrared (mid-IR) observations (Goulding & Alexander, 2009). By contrast, the AGN in NGC 4945 (accreting at percent of the predicted Eddington limit; Itoh et al. 2008) is completely hidden at optical wavelengths, and classified as a starburst galaxy. Clearly, using optical data alone, the intrinsic AGN properties of sources similar to NGC 4945 cannot be derived.
While optical emission-line diagnostics alone cannot reliably characterise the properties of a non-negligable fraction of the AGN population, they are readily identified at obscuration independent wavelengths (e.g., X-ray; mid-IR). Hence, the identification of AGNs made at X-ray and mid-IR wavelengths complements traditional UV/optical methods to yield a more complete census of AGN activity. Indeed, using the high resolution mid-IR spectrograph on-board the NASA Spitzer Space Telescope (Spitzer-IRS), Goulding & Alexander (2009; GA09) found using the first complete volume-limited sample of all ( percent) local ( Mpc) bolometrically luminous galaxies (), that percent of local AGNs are not identified in sensitive optical surveys. At least percent of these AGNs were previously identified as pure optical starburst galaxies, similar to NGC 4945 (i.e., not even otherwise known to be transition-type objects as defined by Kauffmann et al. 2003). Furthermore, percent of the optically unidentified AGNs were found to reside in late-type spiral galaxies (Sc–Sd; e.g., similar to NGC 4945). Complimentary to this, from a heterogenous sample of Palomar galaxies, Satyapal et al. (2007) and Satyapal et al. (2008) have also concluded that optically unidentified AGNs exist in some late-type spiral galaxies. With the inclusion of these new optically unidentified AGNs, it is natural to ask, what are the masses of local active SMBHs, what are their Eddington ratios, and hence, how rapidly are active SMBHs growing in the local Universe?
In this paper, we investigate the growth rates and space density of actively accreting SMBHs using the 17 AGNs identified in the volume-limited survey of GA09. Whilst the source statistics considered here are significantly smaller than those studies using the SDSS, this work compliments that of H04 by including a relatively large number (given the considered small volume) of optically unidentified AGNs (10) which would not be reliably identified or characterised in the SDSS survey.111Following GA09, throughout this paper we define an optically unidentified AGN as an object which is not unambiguously identified as a Seyfert galaxy at optical wavelengths using solely traditional optical emission-line diagnostics. This has the advantage that we may directly compare statistics from the sample considered here to those derived from large N surveys such as the SDSS. Furthermore, by including a significant population of bolometrically luminous (but dust-obscured) late-type spiral galaxies (Sc–Sd) we are able to extend the SMBH density function to . As many of the late-type spiral galaxies host small galactic bulges, and hence lower mass SMBHs, particular attention is paid to obtaining accurate mass estimates for these SMBHs. Given their proximity, many of the sources in GA09 are well-studied and have multiple estimates of SMBH mass () from a variety of methods (i.e., reverberation mapping techniques; mapping of water maser spots; gas kinematical estimates; the M– relation; correlation of with the luminosity of the galactic bulge); below we discuss the relative accuracy of each SMBH mass estimate technique. Furthermore, to determine the relative mass accretion rates and hence average growth times of the SMBHs in our sample we require the best available estimates of the AGN bolometric luminosity (). Here we use two approaches: 1) for the AGNs with currently published data, we use high-quality well-constrained sensitive hard X-ray (2–10 keV) luminosities to directly measure ; and 2) we accurately infer using a well-constrained hard X-ray to high-ionisation mid-IR emission line relation.
In §2 we outline the construction and basic reduction analysis of the AGN sample derived from GA09. In §3 we present the SMBH mass estimates. For a minority of objects (three out of 17 AGNs) without published estimates we outline the use of a bulge/disc decomposition method with 2MASS K-band images, and following Marconi & Hunt (2003), we use the – relation to estimate their SMBH masses. In §4 we use hard (2–10 keV) X-ray measurements and high-ionisation mid-IR emission to estimate the intrinsic luminosity of the AGNs considered in our sample. Using our well-defined estimates for SMBH mass and AGN bolometric luminosity, we investigate the relative mass accretion rates of our sample of active SMBHs in §5. We use these estimates to provide new constraints on the volume-average SMBH growth rates in the local Universe. We further compare these results to the previous works of H04 and Greene & Ho (2007) by producing a local AGN population density function. Finally, in §6 we present our conclusions.
2 The Sample
2.1 Selection and Data-reduction
The sample of local AGNs is derived from the Spitzer-IRS spectral investigation of a volume-limited sample of IR-bright galaxies to Mpc by GA09. High-resolution Spitzer-IRS spectroscopy () was obtained for sixty-four of the sixty-eight ( percent) galaxies detected in the Revised Bright Galaxy Sample (RBGS; Sanders et al. 2003) with within the considered volume.222Based on the principle of reprocessed emission in the Unified AGN model, selection on the basis of IR-luminosity will select all bolometrically luminous AGNs with . However, we note that it will also select dust-rich star-forming systems which may dominate the bolometric luminosity of the galaxy. A particular advantage to a volume-limited sample is that, unlike magnitude-limited surveys, they do not suffer from radial selection effects and thus can be used to construct volume-averaged statistics. By contrast, volume-limited samples yield limited source number statistics due to their inability to probe both the faintest and most luminous systems.
Given the relatively small distance scale considered here, it is prudent to note the importance of distance measurement. For our consider sample, luminosity distances were calculated using the cosmic attractor model of Mould et al. (2000) which accurately adjusts heliocentric redshifts to the centroid of the local group. Hence, unlike many other local surveys, to Mpc our sample does not include galaxies from local over densities such as the Virgo cluster at Mpc (see Appendix A1 for a detailed analysis and validation of the considered space-volume in this survey).
The Spitzer-IRS spectroscopic data presented in GA09 was reduced using a custom idl pipeline which utilises the Spitzer Science Center data-processing packages SPICE, IRSCLEAN and CUBISM. For further detailed information on the reduction processes and spectral analyses see §§2.1 and 2.2 of GA09 and references there-in.
2.2 [NeV] as an unambiguous AGN indicator
Due to the very high-ionization potential of [NeV] (97.1 eV) we consider its detection coincident with the galactic nucleus in mid-IR spectroscopy to be an almost unambiguous identifier of AGN activity. Theoretically, Schaerer & Stasińska (1999) have predicted that extremely hot O and B stars, in particular dense populations of Wolf-Rayet stars, may produce ionization spectra capable of exciting lines such as [OIV] (54.9 eV) and [NeV]. However, observationally, GA09 found that even in extreme Wolf-Rayet galaxies, whilst [OIV] is clearly detected in these types of systems, [NeV] emission remains absent to the detection limits of this survey. Complimentary to this, Hao et al. (2009) find from a Spitzer-IRS study of 12 Blue Compact Dwarf galaxies that the mid-IR spectroscopy for eight of their sample contain [OIV] emission, however none appear to be producing [NeV].
Similarly, extreme starburst driven shocks have also been predicted to excite some high-ionization lines such as [NeV] (Allen et al., 2008), however these require exceptionally high velocities, and based on the [NeV]–[NeII] and [NeIII]–[NeII] emission line ratios presented in GA09, the AGNs in this study are not consistent with shock models. Furthermore, AGNs which contain strong star-formation contributions to their bolometric luminosity are often found to have relatively low mid-IR [NeV]–[NeII] and [NeIII]–[NeII] ratios (Armus et al. 2006; Satyapal et al. 2008; Goulding & Alexander 2009; Dale et al. 2009). However, these ratios are not necessarily strong tracers of the intrinsic power of the AGN. Indeed, many Seyfert 2s are found to be hosted in galaxies where-by star-formation dominates the IR spectral energy distribution (Weedman et al. 2005; Buchanan et al. 2006; Deo et al. 2007), thus yielding a low [NeV]–[NeII] ratio (log-average ); however, the central source may still be extremely luminous at other energies e.g., NGC 4945 is the most luminous local AGN at keV (Done et al. 1996) and by contrast has a [NeV]–[NeII] ratio of .
The mid-IR spectra of seventeen of the sixty-four galaxies ( percent) presented in GA09 were found to contain the [NeV] emission line, and hence, host AGN activity. These seventeen sources are the main focus of the current paper. See Table 1.
3 Black Hole Mass Determination
3.1 Archival Data
To accurately determine the relative mass accretion rates and space density of active SMBHs in the local Universe requires reliable SMBH mass () estimates for the seventeen AGNs within our volume-limited sample. Here we outline the construction of the heterogeneous database of the most reliable available SMBH masses for these AGNs, derived from a variety of archival sources and estimation methods.
Many of the sources in the sample are late-type galaxies hosting relatively small bulges, and hence low-mass SMBHs. In such systems, SMBH mass estimates are often challenging to determine as: 1) characteristically low velocity dispersions can be difficult to measure as they are often at the resolution limit of published observations, 2) modeling of the contamination from composite stellar populations can often lead to inconsistencies between published measurements and 3) SMBH mass relations are poorly constrained at .
Given the varying degrees of accuracy associated with measurements estimated from differing methodologies, we have chosen to prioritise the archival data (which we further expand on here) based upon two broad categories: (i) physically motivated AGN modeling techniques (i.e., reverberation mapping, water maser mapping and gas kinematics of the central engine) and (ii) indirect estimations from observational relations (the M– and – relations). The adopted for the sources and their associated measurement methodologies are given in columns 12 and 13 of Table 1. The database contains four SMBH measurements determined from physically motivated AGN modeling and 13 from indirect methods.
3.1.1 Direct SMBH mass constraints from reverberation mapping, maser mapping and gas kinematics
Under the assumption that the gas in the broad-line region (BLR) is virialised by the SMBH and the orbital motion of the gas is Keplerian, estimations are possible through reverberation mapping techniques (Blandford & McKee, 1982). The time-lag between changes in the AGN continuum flux and the response of the broad-line region is used to directly infer the size of the virial radius and hence the mass of the SMBH (for an in-depth review see Peterson 2001). To date, reverberation mapping is widely accepted to be the most reliable of estimation methodologies (e.g., Wandel et al. 1999; Peterson & Wandel 1999; Onken et al. 2003; Bentz et al. 2009). Only a minority of the galaxies in the sample (NGC 1068, NGC 4051 and NGC 5033) are known to have detected BLRs. However, the BLRs of NGC 1068 and NGC 5033 (both are Seyfert 1.9) are extremely weak and are therefore likely to suffer from optical extinction. Thus, estimates using the BLR are not possible for these two AGNs. Hence, only one object (NGC 4051; Wandel 1999) in our sample has archival reverberation mapping data giving .
Complimentary to reverberation mapping, and also assuming Keplerian motion, mapping of water maser spots and observations of gas kinematics within the gravitational sphere of influence of the SMBH are thought to yield relatively precise measurements of . Again, due to the nature of the observations and the requirement of a suitable gas disc (i.e., a relatively face-on inclination to the observer), few estimations using these methods exist in the current literature. Indeed, in our sample there are currently only two AGNs (NGC 1068 and NGC 4945) with estimations from the mapping of water maser spots ( and , respectively) and one AGN (NGC 5128) with a spatially resolved gas dynamical estimate ().
3.1.2 Indirect SMBH mass constraints from the M– relation
Since the seminal discovery that the mass of the stellar spheroid is closely related to (Magorrian et al. 1998), indirect estimation methods have become ubiquitous in the current literature (e.g., Ferrarese & Merritt 2000; Gebhardt et al. 2000; Nelson et al. 2004; Onken et al. 2004; Greene & Ho 2006). Comparisons of spatially resolved stellar dynamics with reverberation-based estimates (over the range of –) show that these are well-correlated with the effective stellar velocity dispersions () within the galaxy bulge (i.e., the M– relation; Gebhardt et al. 2000),
| (1) |
with an intrinsic scatter of only 0.34 dex. Furthermore, with the inclusion of a sample of dwarf Seyfert 1 galaxies, the correlation may be reasonably extrapolated to SMBH masses in the range – (Barth et al., 2005). However, we acknowledge that to-date, the M– relation is still poorly constrained for and suffers from systematic uncertainties. Specifically, these are caused by the lack of homogeneous source statistics in this mass region and also the poor understanding of the physical nature of the central region in very late-type (Scd–Sm) galaxies (e.g., the existence of either a pseudo- or classical bulge; Kormendy & Kennicutt 2004). Of the three AGNs in our sample which are classified as Hubble-type Scd or later, only NGC 3621 (Sd) has an measurement estimated from the M– relation.333The measurement for NGC 1448 (Scd) is estimated from the –LK,bul relation (see §3.2.1) due to the lack of sufficient spectroscopic data to measure a stellar velocity dispersion. NGC 4945 (Scd) is an H2O megamaser source, and hence has an accurate and direct measurement of (Greenhill et al. 1997). See also Table 1. Specifically, using the Echellette spectrograph on Keck-II, Barth et al. (2009) measure an accurate line-of-sight stellar velocity dispersion of the Calcium II triplet lines (CaT; , 8542, 8662) observed in the central nuclear star cluster. They find a velocity dispersion consistent with a SMBH mass of . We find that all of the AGNs in our sample host SMBHs with and thus are unlikely to suffer significant systematic uncertainities arrising from the use of the M– relation to estimate even in the most late-type galaxies.
Ten of the 13 AGNs in our sample without direct measurements have published estimates using the M– relation. For consistency purposes (and where possible) we have used the central stellar velocity dispersions given in the recently published catalogue of Ho et al. (2009). They measure the central for the 486 galaxies within the Palomar Survey (Ho et al. 1997a, b) using the averaged values derived from the fitting of stellar absorption templates (Valdes et al., 2004) to the blue (4230–5110 Å) and red (6210–6860 Å) spectral ranges (i.e., the published spectroscopy does not include standard velocity dispersion measurement features; e.g., CaT). Where available, Ho et al. (2009) compare values derived from the modeling of the stellar absorption features to previously published measurements from CaT lines which are available in the HyperLeda database.444The HyperLeda database is a continuously updated electronic catalogue of galactic measurements available at http://leda.univ-lyon1.fr/. Specifically, HyperLeda contains a consolidated list of archival velocity dispersions for many nearby galaxies. Measured errors are compared between the Palomar measurements and the weighted average adopted by HyperLeda for the available published measurements. The final adopted measurement of by Ho et al. (2009) is that with the smallest overall error. Where the values assumed by Ho et al. (2009) are previously published or are from HyperLeda we quote these references in column 14 of Table 1 (6 objects). For the AGNs in our sample which are not part of the Palomar survey, values of derived from direct fitting analyses of the CaT lines are adopted from other published sources (see column 14 of Table 1; 4 objects). All final adopted measurements are converted to estimates using Equation 1.555We note that NGC 6300 currently has two measurements of from fitting of the CaT lines (Garcia-Rissmann et al., 2005), which were obtained through direct-fitting and cross-correlation analyses. For consistency with other measurements, we adopt the direct-fitting value of . We find that the derived from the cross-correlation method is a factor two larger; however, using this larger measurement will have little impact on our overall results.
| Common | Hubble | AGN | log() | log() | Ref. | log() | log() | log() | Method | Ref. | |||
| Name | (Mpc) | Type | ID | () | () | () | () | (mag) | (mag) | () | |||
| (1) | (2) | (3) | (4) | (5) | (6) | (7) | (8) | (9) | (10) | (11) | (12) | (13) | (14) |
| E121-G006 | 14.5 | Sc | IR | 39.04 | - | - | 41.82 | - | 8.98 | 10.91 | LBul | 14 | |
| NGC 0613 | 15.0 | Sbc | IR | 39.38 | - | - | 42.26 | - | 7.03 | - | M- | 15 | |
| NGC 0660 | 12.3 | Sa | IR | 39.71 | - | - | 42.69 | - | 7.34 | - | M- | 21 | |
| NGC 1068 | 13.7 | Sb | IR,O,X | 41.66 | 43.48 | 1,9,2 | 45.26 | 44.85 | 5.79 | - | M | 16 | |
| NGC 1448 | 11.5 | Scd | IR | 39.40 | - | - | 42.28 | - | 7.66 | 10.64 | LBul | 14 | |
| NGC 1792 | 12.5 | Sbc | IR | 38.26 | - | - | 40.49 | - | 7.01 | 9.08 | LBul | 14 | |
| NGC 3621 | 6.6 | Sd | IR,O | 38.18 | - | - | 40.68 | - | 6.60 | - | M- | 22 | |
| NGC 3627 | 10.0 | Sb | IR | 38.38 | - | - | 40.95 | - | 5.99 | - | M- | 21 | |
| NGC 3628 | 10.0 | Sb | IR | 38.81 | - | - | 41.51 | - | 6.07 | - | M- | 20 | |
| NGC 4051 | 13.1 | Sbc | IR,O,X | 39.88 | 41.72 | 3,2,4,5 | 42.91 | 42.71 | 7.67 | - | R | 19 | |
| NGC 4945 | 3.9 | Scd | IR,X | 38.72 | 42.49 | 6,2,7,4,5 | 41.40 | 43.61 | 5.23 | - | M | 17 | |
| NGC 5033 | 13.8 | Sc | IR,O,X | 39.08 | 40.85 | 8,9 | 41.86 | 41.73 | 6.96 | - | M- | 21 | |
| NGC 5128 | 4.0 | S0 | IR,X,Ra | 39.38 | 41.85 | 2,9,4,5 | 42.26 | 42.86 | 3.94 | - | G | 18 | |
| NGC 5194 | 8.6 | Sbc | IR,O,X | 38.85 | 41.11 | 10,2 | 41.56 | 42.00 | 5.92 | - | M- | 15 | |
| NGC 5195 | 8.3 | Irr | IR | 37.89 | - | - | 40.30 | - | 6.25 | - | M- | 20 | |
| NGC 5643 | 13.9 | Sc | IR,O,X | 40.43 | 41.08 | 11,12,2 | 43.63 | 41.98 | 7.17 | - | M- | 23 | |
| NGC 6300 | 13.1 | Sb | IR,O,X | 39.78 | 41.63 | 13,4,5 | 42.79 | 42.60 | 6.93 | - | M- | 24 |
NOTES: (1) Common galaxy name. (2) Distance to source in megaparsecs from the Revised Bright Galaxy Survey (RBGS; Sanders et al. 2003). (3) Morphological type from RC3 (de Vaucouleurs et al., 1991). (4) Waveband of AGN identification; IR: Mid-Infrared spectroscopy (GA09); O: Optical spectroscopy (references presented in GA09); X: X-ray spectroscopy (2–10 keV; see column 7 for references); R: Radio observations. (5) Logarithm of [OIV] luminosity in calculated using [OIV] flux presented in GA09; mean uncertainty is approximately 10 percent. (6) Logarithm of absorption corrected hard X-ray luminosity (2–10 keV) in which have been converted to the distances given in column 2. (7) Reference for X-ray data. (8) Logarithm of bolometric luminosity of the AGN estimated from using Equation 4. (9) Logarithm of bolometric luminosity of the AGN estimated from using the bolometric corrections described in Marconi et al. (2004). (10) Total K-Band magnitude from 2MASS Large Galaxy Atlas (Jarrett et al. 2003). (11) K-Band magnitude of bulge produced using GALFIT (Peng et al. 2002; see section 3.2.1). (12) Logarithm of estimated black hole mass and associated 1-sigma errors in solar masses. (13) Method of measurement; M: Maser Mapping; G: Gas Kinematics; R: Reverberation Mapping; M-: Mass–Velocity Dispersion Correlation; LBul: -band Luminosity–Bulge Correlation. (14) Reference for measurement.
REFERENCES: (1) Matt et al. (1997); (2) Dadina (2007); (3) Pounds et al. (2004); (4) Tueller et al. (2008); (5) Winter et al. (2009); (6) Guainazzi et al. (2000); (7) Itoh et al. (2008); (8) Cappi et al. (2006); (9) Bird et al. (2007); (10) Fukazawa et al. (2001); (11) Maiolino et al. (1998); (12) Guainazzi et al. (2004); (13) Matsumoto et al. (2004); (14) This Paper; (15) HyperLeda; (16) Greenhill et al. (1996); (17) Greenhill et al. (1997); (18) Marconi et al. (2001); (19) Wandel (1999); (20) Ho et al. (2009); (21) Barth et al. (2002); (22) Barth et al. (2009); (23) Whittle (1992); (24) Garcia-Rissmann et al. (2005); a for a review see Israel (1998).
3.2 Galaxy Decompositions using GALFIT
3.2.1 Indirect SMBH mass constraints from the –LK,bul relation
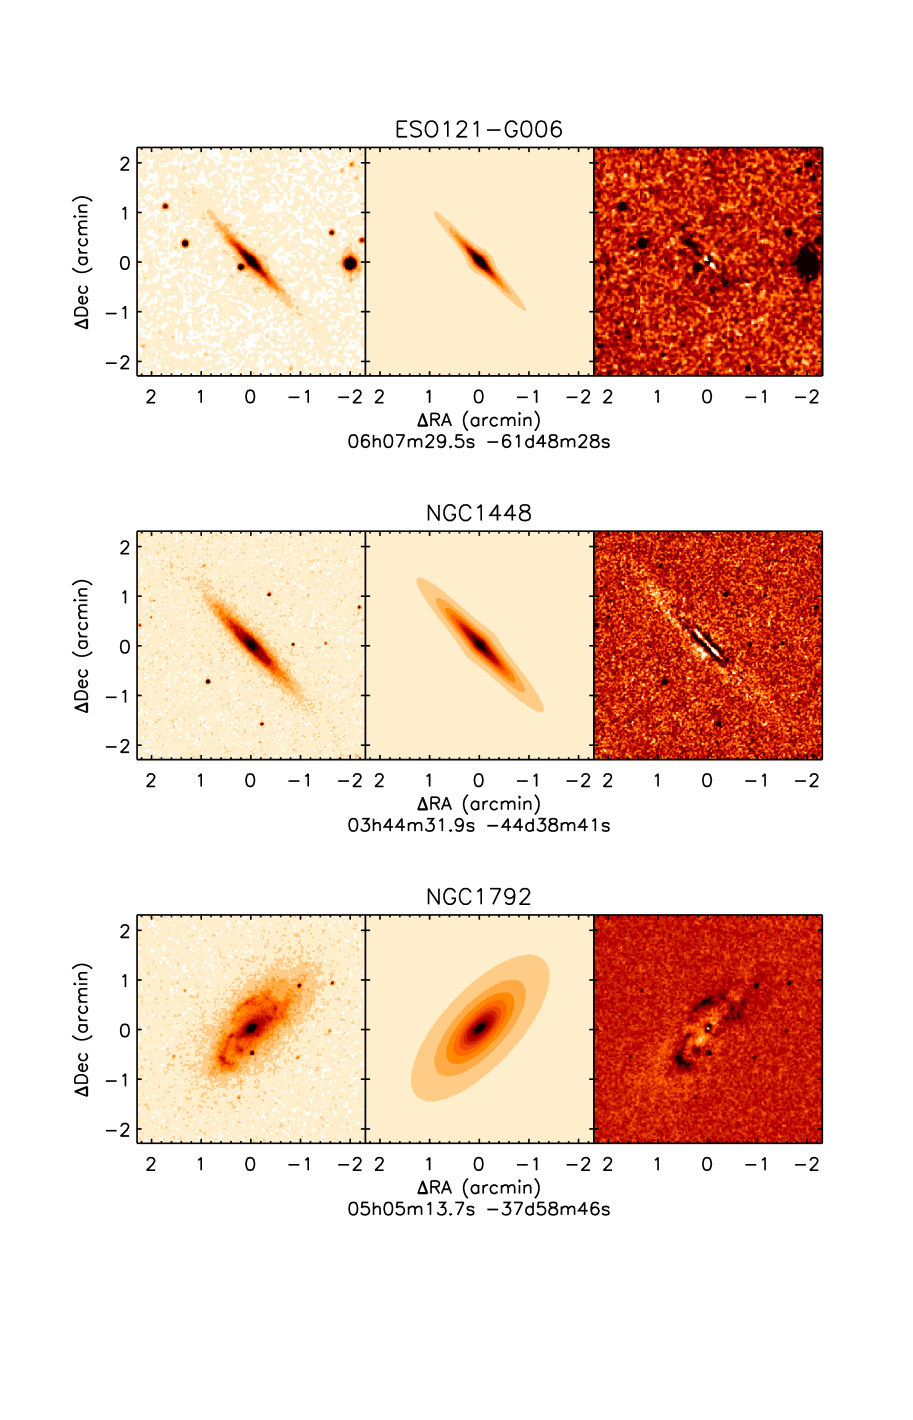
Three of the AGNs within our sample (ESO121-G006, NGC 1448 and NGC 1792) currently lack archival direct or indirect SMBH mass constraints. Hence, for these three objects, we follow the formalism of Marconi & Hunt (2003; hereafter, MH03) and use 2MASS -band imaging and galfit, the two-dimensional imaging analysis software of Peng et al. (2002), to constrain the bulge luminosities and therefore, for these three AGNs.
Near-IR (0.9–) emission is a strong tracer of stellar mass and is less susceptible to the effects of dust/gas extinction than optical emission. As a result of this, the K-band () is shown to provide the strongest correlation of all near-IR bands between the luminosity of the bulge and (MH03).
For the bulge-disc decomposition image analysis, we have obtained archival K-band imaging for ESO 121-G006, NGC 1448 and NGC 1792. These images were retrieved from the Two Micron All-Sky Survey (2MASS) extended source catalogue and consist of pre-mosaicked (1 arcsecond per pixel resolution) all-sky atlas images. The K-band images of the three galaxies were modeled with a central point spread function (PSF) and a constant sky background contribution, whilst the bulge and host-galaxy components were modeled using variations of the Sersic profile:
| (2) |
where is the effective radius of the profile, is the surface brightness at the effective radius, is the power-law (Sersic) index, and is coupled to such that half of the total flux of the object is within the effective radius. We employ two special forms of the Sersic profile in our galfit modeling, the exponential () and the de Vaucouleurs () profiles, which are classically used to model galactic discs and bulges, respectively.
Häussler et al. (2007) have shown that the reliability of the fitting parameters produced by galfit are strongly dependent on the initial estimates. galfit will, in general, fail to find the overall global chi-squared () minimum to the fit if the initial estimates are poorly constrained. Thus, to reduce this systematic effect, and aid the fitting routine, we use a simplified 1-dimensional fit to produce initial estimates of the fitting parameters. A 1-dimensional surface-brightness slice of the K-band image was taken across the major axis of each of the galaxies. A surface brightness profile extending from the nucleus was produced by averaging the two semi-major axes from the slice, and removing the measured background flux. Few spiral galaxies are found to host bulges with true de Vaucouleurs profiles, thus a global reduction process was used to simultaneously fit a generalised Sersic profile and a fixed () exponential disc to the 1-d surface brightness profile. From these, we calculate Sersic and disc radii, as well as the Sersic index of the bulge. Combining the 1-d parameter estimates with the total K-band magnitude from the 2MASS Large Galaxy Atlas (Jarrett et al., 2003), we generate an appropriate set of constraints and initial parameters to be input to galfit.
Using the derived parameter estimates, galfit is used to fit a generalised 2-d Sersic profile with an exponential disc to the K-band image. To again aid the galfit reduction analysis, particular attention is paid to simulating accurate PSFs for the 2MASS images using known standard stars (J. R. Lucey private communication).666A detailed discussion of galfit problems caused by poor PSF modeling can be found in Bentz et al. (2009) Results of this bulge/disc reduction for the three objects are presented in Fig. 1 and column 11 of Table 1.
We have directly tested our robust galfit method using the late-type galaxies (i.e., S0 or later) presented in the dataset of MH03 and find close agreement ( dex). We do note however, that we find a systematic offset of a factor in bulge luminosity for the AGNs in MH03 that are hosted in low-inclination angle late-type galaxies, which is likely to be caused by galfit over-estimating the contribution of the bulge to the total flux of the galaxy. Indeed, when directly comparing a sample of reverberation mapped X-ray detected AGNs to estimations using the MH03 formalism, Vasudevan et al. (2009) find similar results. However, the three galaxies fitted in our sample are all moderately to highly-inclined and thus this systematic effect will be negligible.
In Fig. 1 we show the three galfit produced image cubes obtained following our bulge/disc fitting routines. Within each of the residual (observed – model) images it is clear that the bulge is well fitted by a Sersic profile. The edge-on galaxy ESO121-G006 is well fit by an exponential disc combined with a Sersic profile, with no distinguishing residual features. The residual of NGC 1448 highlights the existence of its spiral arms and shows the presence of a truncated disc combined with a possible bar structure which our simplified modeling technique is incapable of fitting; however, the bulge fit does not appear to be compromised. Indeed, our derived estimations for ESO121-G006 and NGC 1448 are consistent with the upper limits obtained from stellar mass-to-light ratio analyses (Ratnam & Salucci, 2000). The residual image of the moderately inclined galaxy, NGC 1792, contains strong spiral arms as well as a point-like nuclear source. We note that due to the inclination angle of this source, the derived may be systematically over-estimated by a factor of (see above). Thus, our derived Eddington rate for NGC 1792, presented in §5.1, should be considered a lower limit.
From the obtained K-band bulge magnitudes (column 11, Table 1) we calculate bulge luminosities (). Using the well established to bulge K-band luminosity relation of MH03 (hereafter, –),
| (3) |
we calculate for ESO 121-G006, NGC 1448 and NGC 1792. The 1- uncertainties associated with the values are assessed by combining in quadrature the bulge magnitude errors as calculated by galfit with the intrinsic dispersion observed in the –LK,bul relation. The resultant estimates and 1- uncertainties are provided in column 12 of Table 1.
4 Bolometric Corrections
To determine the relative mass accretion rates, and hence the average growth times of SMBHs in the local Universe we require relatively accurate estimates of the bolometric luminosities of the AGNs () in our sample. We use two methods to estimate : 1) a direct approach using the best available measured hard X-ray (2–10 keV) luminosities, and 2) a well-constrained –[OIV] luminosity relation to infer the intrinsic luminosity of the AGN (e.g., Dasyra et al. 2008; Meléndez et al. 2008, hereafter, M08).
4.1 Hard X-ray Luminosity as a Tracer of the Bolometric Luminosity of an AGN
High quality hard X-ray spectral analyses arguably provide the most unambiguous method for measuring the intrinsic luminosity of an AGN since: 1) X-rays are relatively unaffected by dust extinction; 2) intrinsic absorption can be directly constrained from high S/N data; 3) star-formation contamination is often found to be negligible. We therefore divide our sample into two categories based on the quality and energy range of their available published X-ray data: 1) AGNs with high S/N X-ray spectra where has been accurately constrained and/or AGNs with keV constraints where the observed X-ray emission will only be strongly absorbed for heavily Compton-thick () sources (8 AGNs); and 2) those AGNs with no or low S/N X-ray data, i.e., where there are insufficient counts to accurately determine and the X-ray flux could have large contributions from star-formation (9 AGNs). Hence, we specifically do not estimate for those AGNs with measurements using Chandra that also have no further hard X-ray spectral constraints ( keV) due to the limited band-pass of the instrument at (0.5–8 keV).
For the AGNs in our sample currently with either high S/N spectroscopy or keV constraints, we estimate using the Eddington ratio independent AGN bolometric corrections outlined in Equation 21 of Marconi et al. (2004). We note that Vasudevan & Fabian (2009) have suggested that the bolometric correction factor () may be a function of the Eddington ratio of a considered source. Values of –30 are considered to be relatively low bolometric corrections and are generally found in AGNs with (e.g., Vasudevan & Fabian 2009; Vasudevan et al. 2010). For the sample of X-ray detected AGNs considered here, we calculate similarly consistent values of –30, and thus conclude that the Eddington ratio is unlikely to be dominating the bolometric corrections adopted here from Marconi et al. (2004).
For further consistency, all archival X-ray luminosities were adjusted to the distances adopted in column 2 of Table 1. Final adopted measurements, estimated from , and archival references for are given in columns 6, 7 and 9 of Table 1, respectively.
4.2 [OIV] Luminosity as a Tracer of the Bolometric Luminosity of an AGN
For those galaxies in the sample without good-quality hard X-ray constraints we require an additional approach to estimate the intrinsic luminosity of the AGN, and hence the relative mass-accretion rate. Here we build-upon an estimation which relies on the AGN-produced [OIV] luminosities () for the AGNs in our sample (e.g., Dasyra et al. 2008; M08).
Based on the simplest Unified Model of AGN (Antonucci, 1993), the hot dust within the predicted torus, close to the central engine, reprocesses absorbed UV, optical and X-ray emission into mid-IR emission. Hence, AGN emission detected at IR wavelengths is likely to be isotropic and independent of viewing angle. As discussed in §2, the detection of high-ionisation [NeV] emission (97.1 eV) coincident with the nucleus of a galaxy is considered a robust indicator of AGN activity (e.g., Armus et al. 2006; GA09). Complimentary to this, GA09 find that [NeV] emission is also well correlated with [OIV] emission (54.9 eV) with an intrinsic scatter of only 0.24 dex. As [NeV] emission, and thus [OIV] emission, do not suffer from significant star-formation contamination and are both comparatively extinction-free, they may be used as relatively clean proxies for the bolometric luminosity of the AGNs presented here ().777We note that since star-formation can also produce [OIV] emission, the [NeV]–[OIV] relation may be unreliable for sources with exceedingly high star-formation rates (e.g., Ultra Luminous Infrared Galaxies with ; ULIRGs). However, there are no ULIRGs within the sample considered here. Indeed, for a sample of 35 well-studied optically unobscured AGNs, Dasyra et al. (2008) show that both [NeV] and [OIV] emission are well correlated with the luminosity of the 5100 Å optical continuum, and hence with an intrinsic scatter of 0.46 and 0.47 dex, respectively. However, the relation of Dasyra et al. (2008) is derived from AGNs with (), and hence we test whether it may be reliably extrapolated to the more modest luminosity AGNs considered here (log-average ).
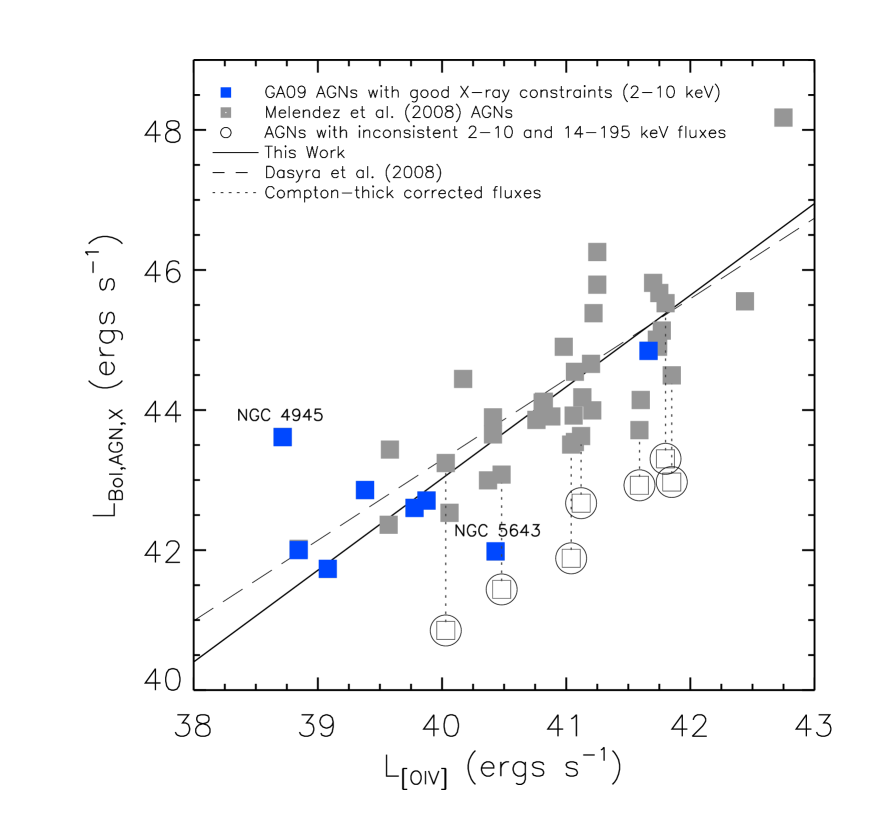
We combine our robustly adopted from 2-10 keV flux measurements with the X-ray catalogue of nearby () Seyfert galaxies in the Swift-BAT survey which have published [OIV] luminosities in M08. The catalogue of sources in M08 contain 2–10 keV luminosities obtained primarily from ASCA data, 14-195 keV luminosities from the Swift-BAT survey and [OIV] luminosities from Spitzer-IRS spectroscopy. Combining the M08 sample with our 8 AGNs with high-quality X-ray constraints, the range covered in is –. For consistency, we convert the M08 2–10 keV luminosities to using the same bolometric corrections adopted in §4.1. In Fig. 2 we plot versus for the M08 sample and the 8 AGNs in our GA09 sample with good-quality hard X-ray constraints (grey filled squares and blue filled squares, respectively).
| Common | log() | log() | C-thick | Ref. |
| Name | () | () | AGN? | |
| (1) | (2) | (3) | (4) | (5) |
| Circinus | 40.58 | 42.04 | 1 | |
| Mrk 3 | 41.95 | 43.20 | 2 | |
| NGC 1365 | 40.99 | 42.40 | 3 | |
| NGC 2992 | 41.69 | 42.50 | 4 | |
| NGC 3079 | 40.02 | 42.18 | 5 | |
| NGC 4388 | 41.91 | 42.57 | 6 | |
| NGC 6240 | 42.23 | 44.00 | 7 |
NOTES: (1) Common galaxy name. (2) Logarithm of 2–10 keV luminosity adopted by M08. (3) Logarithm of absorption corrected 2–10 keV luminosity adopted in this work from individual studies (2–10 keV luminosities were adjusted using our adopted distances). (4) Is the AGN a Compton thick source? (5) Reference for adopted measurement.
Seven of the AGNs in M08 were found to have unusually low 2–10 keV luminosities when compared to the quoted 14-195 keV luminosities, which are highlighted with open circles in Fig. 2 and are shown in Table 2. Using high-quality X-ray spectral analyses, in the literature we find that five of these AGNs are identified as Compton thick AGNs (see column 4 of Table 2). This additional obscuration does not appear to have been accounted for in the adopted value of M08, and therefore we have chosen to select measurements of from the literature, which now give good agreement with 14–195 keV luminosities (see columns 2, 3 and 5 of Table 2; dotted-lines in Fig. 2). The other two AGNs (NGC 2992 and 4388) in M08 with inconsistent 2–10 and 14–195 keV fluxes are found to be highly variable (Beckmann et al. 2007 and Elvis et al. 2004, respectively).
With the inclusion of the obscuration-corrected 2–10 keV luminosities to infer , we find a strong correlation between and which is characterised by the equation:
| (4) |
with an intrinsic scatter in the data of dex. We find good agreement with the Dasyra et al. (2008) relation (dashed-line) in the region – (i.e., where the Dasyra et al. (2008) relation is well sampled). However, for we show that the Dasyra et al. (2008) relation will over estimate by typically dex.
In Fig. 2, we highlight two AGNs from the Mpc sample (NGC 4945 and 5643) which appear to be significant outliers of the observed correlation. NGC 5643 possibly harbours a variable central source. From the detection of strong Fe K emission, Maiolino et al. (1998) suggest from using BeppoSAX data that NGC 5643 is possibly Compton thick (N); however, Guainazzi et al. (2004) find using XMM-Newton data, that it may be Compton thin with N–. Thus, from current available data, the true intrinsic luminosity of the AGN is highly uncertain. Here we conservatively adopt the Compton thin value of Guainazzi et al. (2004); however, we note that if we use the value of Maiolino et al. (1998), then NGC 5643 would lie on our derived relationship. NGC 4945, by contrast, has observations using Ginga, ASCA, OSSE, the Rossi X-ray Timing Explorer, BeppoSAX, Suzaku and most recently Swift-BAT (Iwasawa et al. 1993, Tanaka et al. 1994, Done et al. 1996, Madejski et al. 2000, Guainazzi et al. 2000, Itoh et al. 2008 and Tueller et al. 2008, respectively) all of which provide excellent and consistent spectral constraints over a wide X-ray band (1–200 keV) showing that the central source is Compton thick (), with – and an observed intrinsic variability of a factor . Here we adopt the luminosity from the most recent observation by Swift, . On the basis of our mid-IR constraints, it would therefore appear that NGC 4945 is under-luminous in [OIV] flux by a factor of (see Table 1 and Fig. 2). We suggest this deficit in observed [OIV] flux is unlikely to be due to host galaxy extinction; the required absorption to account for a factor of flux difference is mags ( assuming typical dust-to-gas ratios; using ). Another possible explanation is a temporary decoupling of the X-ray emitting and narrow-line regions (i.e., the highly-luminous state of NGC 4945 may be a somewhat recent event). Given the spatial difference (and hence, the light-travel time) between the two emission regions: pc and 1–10 pc, respectively, the photoionisation of the narrow-line region, and thus the observed [OIV] emission, may take years to respond to the changes in the X-ray emitting region. We therefore suggest that the intrinsic scatter in the observed [OIV]– relation may be significantly reduced if it was possible to account for variability in the central region of all of the AGNs. Indeed, we find the average dispersion decreases to dex if we remove NGC 4945 from our analysis.
Using Equation 4 and from GA09 (column 5 of Table 1), we estimate (column 7 of Table 1) for those AGNs in our sample currently without good hard X-ray measurements. We use these estimates to assess the relative mass accretion rates () of the SMBHs in our Mpc sample.
5 Results and Discussion
From a volume-limited sample of 64 bolometrically luminous galaxies to Mpc ( percent complete) GA09 unambiguously identified seventeen ( per cent) sources to be hosting AGN activity in galaxies with , using [NeV] emission as a robust AGN indicator. Using the SMBH mass and AGN bolometric luminosity estimates derived here, we discuss the relative mass accretion rates of these seventeen AGNs and use them to derive the average present-day growth times of SMBHs in the very nearby Universe. Furthermore, we evaluate the unique contribution that our new optically unidentified AGNs make to the space density of active SMBHs in the local Universe, which have until now been previously derived from large-scale optical surveys (e.g., H04; Greene & Ho 2007).
5.1 Derived AGN Properties and Relative Mass Accretion Rates
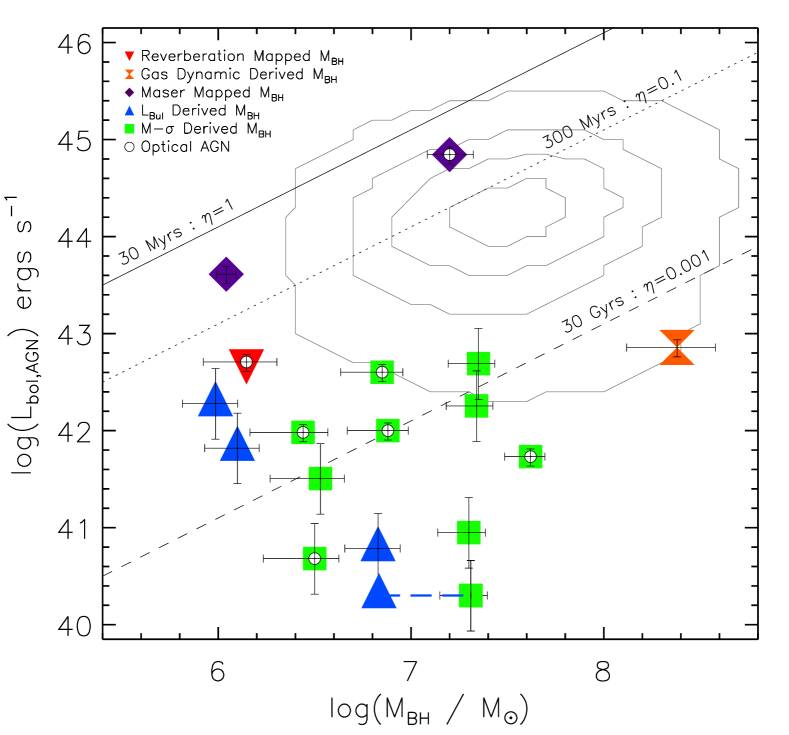
In Fig. 3, we plot against our adopted estimates (the associated 1- errors for measurements are described in section 3) for the 17 AGNs in our volume-limited sample. is inferred from either accurate intrinsic high-quality hard X-ray (2–10 keV) constraints (where available) or AGN-produced [OIV] emission (see §4.1 and 4.2). The 1- errors for the sources with hard X-ray constraints are the result of combining the uncertainty in the measurement with that of the mean spread in the bolometric correction factor employed from Marconi et al. (2004). For those AGNs with derived from , the error is derived from the uncertainty in as quoted in GA09 combined in quadrature with the intrinsic scatter of the empirical [OIV]– relation (equation 4).
Seven objects within the sample have been classified as optical AGNs from previous surveys (see GA09 and Table 1) using typical optical emission-line diagnostics (e.g., the Baldwin-Phillips-Terlevich diagnostic diagrams; Baldwin et al. 1981); however, all have detected [NeV] emission, and thus are unambiguously identified to host AGNs at mid-IR wavelengths (GA09).888We note that NGC 3627 is ambiguously classified as T2/S2 from the optical spectroscopy presented in Ho et al. (1997a), and thus may host an active central source. However, Roberts et al. (2001) suggest from its optical emission-line ratios that NGC 3627 is most likely a LINER/HII composite. We find that with the exception of NGC 5128 (Centaurus A), our sample is dominated by AGNs with SMBHs in the mass range – (median of ). Due to the irregular structure of one of the galaxies in the sample (NGC 5195), is poorly determined; in Fig. 3 we plot estimates from both the M- and –LK,bul relations (connected blue-dashed line).
We find the AGNs in our sample are spread over a wide range of bolometric luminosities, –. To assess the relative mass-accretion rates of the sample (), we over-plot lines of constant Eddington ratios (; derived following Rees 1984) and their associated mass-doubling times ( Gyrs, respectively). Given the large range in bolometric luminosities, it is not surprising that the AGNs in the sample are found to be accreting at rates covering over 5 orders of magnitude (–1). With the exception of a few AGNs, the observed range in Eddington ratios is found to be roughly consistent with those found by H04 for active galaxies (solid contours in Fig. 3).
As our work is not limited by the spectral resolution of the SDSS (i.e., with a limit of ), we show in Fig. 3 that significant accretion, (i.e., radiatively efficient accretion systems; e.g., thin discs) occurs onto SMBHs with –. The majority of these low-mass, rapidly-accreting SMBHs are hosted in late-type, disc-dominated spiral galaxies (Sc–Sd). By contrast, it is generally assumed that gas-rich late-type spirals are preferentially inactive galaxies and that a large bulge may be a necessary component for the existence of a SMBH, and thus a luminous AGN. Furthermore, of the four AGNs within the sample with SMBHs consistent with , we find that three sources are not identified as AGNs in sensitive optical surveys. This indicates that significant SMBH accretion may be missed by statistically-large optical surveys such as H04 even if the spectral resolution was sufficient to identify SMBHs down to .
For the subset of our AGN sample which host SMBHs with , we find that many of the optically unidentified AGNs are accreting at relatively low Eddington ratios (), and are unlikely to make a significant additional contribution to the present-day growth of SMBHs. However, these same AGNs may form part of a separate, underlying population of radiatively inefficient accretion systems such as advection dominated accretion flows (ADAFs; e.g., Narayan & Yi 1994) or those which contain optically-thick slim-discs. Further spectral analysis of the X-ray data may distinguish between these particular accretion systems, but is beyond the scope of these analyses (see Goulding et al. in preparation).
5.2 The Present-Day Growth of SMBHs
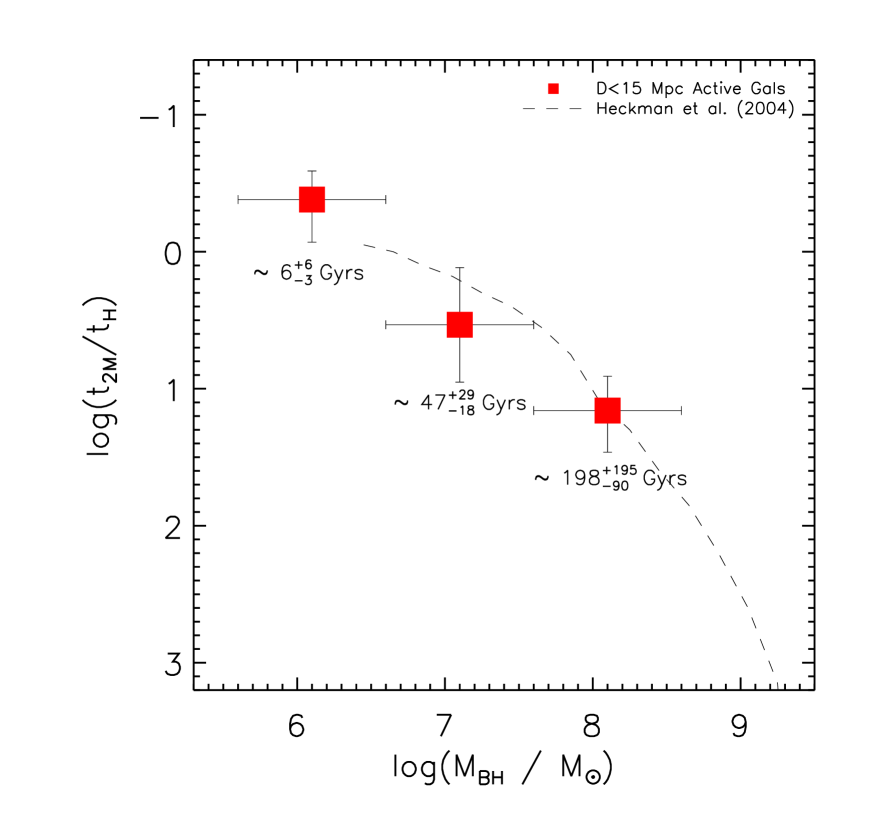
Using the relative mass accretion rates estimated for our sample (Fig. 3), we can infer the volume-averaged growth time of SMBHs in the local Universe. Assuming a mean Kerr spin parameter () for our sample of (e.g., Treister & Urry 2006; Hopkins et al. 2007), i.e., an accretion efficiency () of , the characteristic mass doubling time () of a SMBH accreting matter at the Eddington limit is Myrs (Rees 1984). Under the further assumption that , and hence , does not vary significantly for changes in (King et al., 2008), we assess the present-day growth rate of SMBHs.999We note that the spin variation and spin directionality of SMBHs in AGNs is currently an ongoing area of research, and a consensus between groups has yet to be reached for an average value of the Kerr spin parameter; for example see Brenneman & Reynolds (2006), King et al. (2008) and Fabian et al. (2009). Following H04, we calculate and extend to lower masses () the integrated growth of SMBHs. Growth time errors are calculated from the log-normal standard deviations of the sample. We note here that we also include the optically unidentified AGNs which would not be detected in the SDSS.
In Fig. 4, we find that the mean growth time for low-mass SMBHs () is Gyrs, which is consistent with these AGNs growing on time-scales similar to that of the age of the Universe. Our results are found to be broadly consistent with a simple extrapolation of the growth times calculated by H04 to (dashed-line in Fig. 4). Thus, the AGNs hosting SMBHs in the mass range –, which are dominated by optically unidentified AGNs (see Fig. 3), are acquiring a significant proportion of their mass in the present-day, and are amongst the most rapidly growing SMBHs in the local Universe. Furthermore, we find our derived growth times of SMBHs with are in good agreement with those presented in H04, with mean growth times of and Gyrs for AGNs with –3) and (3–, respectively.101010We note that our sample contains only one galaxy with (NGC 5128) and thus may not be representative for high systems.
5.3 Space-Density of AGNs in the local Universe
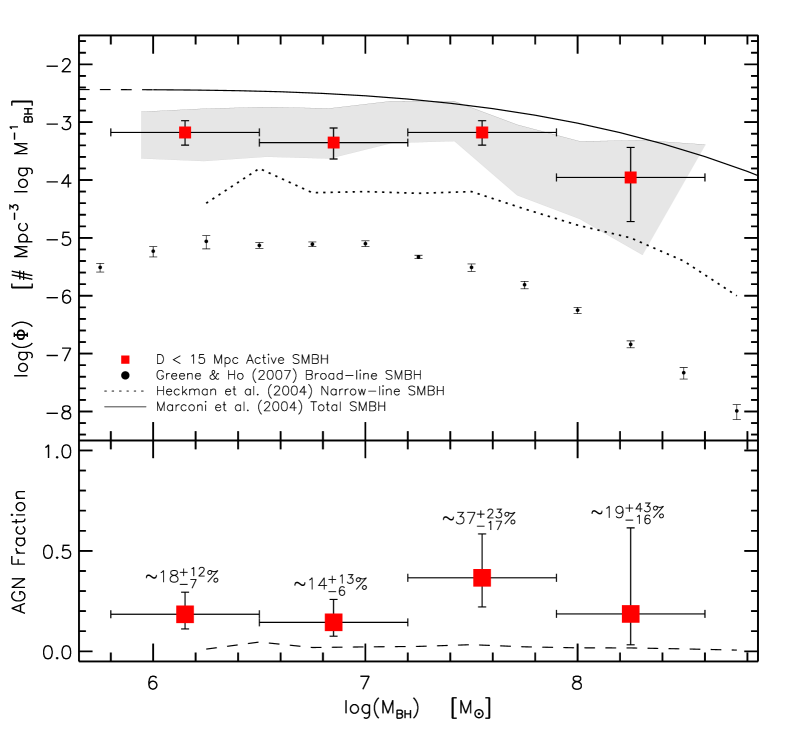
An accurate active SMBH mass function, especially for lower mass SMBHs (), is crucial for extending our understanding of the role played by accretion in the growth of SMBHs across cosmic time. In this section we calculate the space density of active SMBHs for our sample and compare it to complimentary optical studies of local narrow-line (NL; H04) and broad-line (BL; Greene & Ho 2007) AGNs, and the total mass function of local SMBHs by Marconi et al. (2004).
Following Greene & Ho (2007), in the top panel of Fig. 5 we plot the volume-weighted space density, against in mass bins of 0.5 dex. The volume, , encompassed by the GA09 sample to Mpc is Mpc3.111111The RBGS includes all IR-bright galaxies detected by IRAS with Jy at . As we note in §2, given the luminosity limit imposed in our volume-limited survey (), we do not include the dwarf like systems which are likely to host the very smallest SMBHs (). With an adjustment for the distance model adopted in this work, an examination of the Palomar survey (Ho et al., 1997a) shows there are possibly three optical Seyferts (NGC 185; NGC 1058; NGC 4395) with which are not included in our sample due to our lower luminosity limit. However, we also note that NGC 185 has since been re-classified as an HII galaxy (Ho & Ulvestad, 2001).
The derived volume-weighted space density for our active SMBHs (filled squares), which is dominated by NL-AGNs, is found to be significantly greater (a factor of ) than the SMBH density of BL-AGNs (filled circles) presented in Greene & Ho (2007) in the mass region –. The significant increase in active SMBH density when compared to the BL-AGN density of Greene & Ho (2007) is partially to be expected due to the greater relative sensitivity of our Spitzer-IRS observations coupled with the greater abundance of observed Seyfert 2 to Seyfert 1 galaxies identified in the local Universe. However, this still may not be a good indicator of the intrinsic Seyfert 1:Seyfert 2 ratio. Tommasin et al. (2010) find in a large sample of 81 Seyfert galaxies that only six sources do not contain significant [NeV] emission in their mid-IR spectroscopy, the majority of which are Seyfert 1s. It is likely that the identification of low equivalent-width emission lines (such as [NeV] or [OIV]) in BL-AGNs is further complicated by a strong IR continuum emission which dominates the mid-IR regime. Hence, it is possible that by requiring the detection of [NeV] to infer AGN status, we may be rejecting broad-line objects, and thus finding a lower Seyfert 1:Seyfert 2 ratio than is representative in the local Universe.
In comparison to the active SMBH mass function containing the optically identified NL-AGNs of H04 (dotted line), we also find a significantly larger space-density of SMBHs. We find that the space-density of active SMBHs identified in the mid-IR is roughly constant in the mass region – with a value of . This space-density of AGNs is a factor of greater than that estimated by H04 over the same range. Since we find only two of the 17 AGNs in our sample are sufficiently luminous/unobscured to be detected in the SDSS survey, we determine that this is consistent with our results. We further suggest that the space density derived here may still be a lower-limit for the number of NL-AGNs in the local Universe. A further examination of the (distance-model adjusted) Palomar survey suggests that at least four further NL-AGNs are not included in our volume-limited survey. Of these, two (NGC 3486; NGC 4565) lack high-resolution Spitzer-IRS spectroscopy of the central region (as noted in Table 2 of GA09), one (NGC 3031; ) lies fractionally below our luminosity limit for this survey, and NGC 4258 is not included in the RBGS due to its extremely large angular size.
Whilst the main focus of this paper is to compare SMBH statistics derived from mid-IR and optical detection techniques, it is prudent to note that the majority of AGN space densities calculated at higher redshifts are typically derived from sources detected in wide-field X-ray surveys. Hence, we now establish whether our mid-IR active space density may be missing a significant fraction of X-ray detected AGNs. Recently, a comparison between high-resolution Spitzer-IRS spectroscopy and X-ray detected AGNs, was made by Dudik et al. (2009) for a large sample of optically classified LINERS. Dudik et al. (2009) reported inconsistencies between [NeV] non-detections and the presence of hard X-ray nuclear emission in a subset of their sample. However, they conclude that the limited sensitivity of their mid-IR observations may be driving their observed result. Using the relations between high-ionisation mid-IR emission and hard X-ray luminosity (M08; GA09; Goulding et al. in preparation), we suggest that a detected [NeV] luminosity of in an AGN (i.e., the limiting luminosity in Dudik et al. 2009) would be equivalent to a hard X-ray luminosity of ; indeed, almost all of the X-ray detected AGNs which lack significant [NeV] emission in Dudik et al. (2009) are below this threshold. We thus conclude that with sufficiently sensitive high-resolution mid-IR spectroscopy, there is currently no conclusive evidence to suggest that X-ray detected Type-2 AGNs lack significant [NeV] emission in the mid-IR. Hence, with the exception of some Seyfert 1 galaxies (as discussed previously), it is unlikely that our derived mid-IR space density lacks significant numbers of X-ray detected AGNs with [NeV] emission below our sensitivity limit.
Given our comparatively small volume to that considered by using the SDSS (e.g., Greene & Ho 2007; H04), we further validate our derived space density of active SMBHs by robustly testing our results to find if: 1) our sample is over-dense, and thus strongly subject to cosmic variance; or 2) given the modest errors associated with our estimations, the derived space-density is strongly subject to scattering of objects in our defined binning structure. We discuss these analyses in the Appendix. Briefly, we find that our sample is broadly representative of galaxies to , and further show that even in our most pessimistic case, we find an increase in our derived space-density of at least a factor of (maximum increase by a factor of ) at over the optical NL space-density of H04.
5.4 The volume-weighted local AGN fraction
The ratio of the space densities of the active SMBH to total SMBH mass function (i.e., the volume-weighted local active SMBH fraction) is shown in the lower panel of Fig. 5. We calculate an overall active SMBH fraction of percent for SMBHs of – down to our [NeV] completeness limit (). We find that this fraction is consistent with being constant throughout this range. However, given our detection sensitivity limit, we are unable to probe lower Eddington ratios for AGNs hosting smaller SMBHs. Instead, we consider the effect of the AGN fraction for a fixed value of Eddington ratio (e.g., ; i.e., thin-disc accretion systems) and find tentative evidence that the AGN fraction ( and percent) may increase with decreasing SMBH mass (– and – bins, respectively).
For the lowest-mass SMBHs (–), we estimate an overall non-negligible volume-weighted AGN fraction of percent, potentially showing that a considerable proportion of small bulge (and pseudo-bulge) galaxies (i.e., late-type spiral galaxies; Sc–Sd) host AGN activity. It has been previously suggested by H04 and Greene & Ho (2007) that the AGN fraction may peak at –. However, with the inclusion of the additional low-mass optically unidentified AGNs (see Fig. 3), we find that the AGN fractions are consistent with remaining constant or even increasing for .
As noted in §5.3, the space-density of AGNs, and hence the local AGN fraction derived in this work, may only be a lower-limit given the nature of our volume-limited survey which by definition does not include IR-faint systems. To improve upon these current source statistics, a larger sample of late-type spiral galaxies would be required to investigate our findings further. With the greater sensitivity and resolving power proposed for the next generation of space-based mid-IR spectrographs, for example the Space Infrared Telescope for Cosmology and Astrophysics (SPICA)121212See http://www.ir.isas.jaxa.jp/SPICA/ and the mid-IR instrument (MIRI) on-board the James Webb Space Telescope (JWST)131313See http://www.roe.ac.uk/uktac/consortium/miri/, surveys such as these can be continued and extended to study more distant (i.e., greater volumes) and heavily obscured AGNs.
6 Conclusions
We have presented the mean growth times and volume-weighted space density of active SMBHs in the local Universe. Our sample of 17 AGNs was derived from a sensitive volume-limited mid-IR spectral survey of all IR bright galaxies to Mpc carried out using the NASA Spitzer Space Telescope (see GA09 for further details on the sample selection). The most accurate SMBH masses available for the objects are compiled from a variety of sources. For the three AGNs without published estimates, we use a bulge/disc decomposition method to determine the bulge luminosity and hence a SMBH mass (see section 3). Our main findings are the following:
-
(1).
Using combined mid-IR emission line and high-quality hard X-ray constraints, we have derived accurate measurements of the intrinsic luminosities of our sample of AGNs (see section 4). In conjunction with the well-established SMBH measurements from previous studies and our own estimates from our aforementioned bulge/disc decomposition method, we have assessed the relative mass accretion rates of our sample. Due to our high sensitivity and the ability to probe low SMBH masses, we find that significant mass accretion () occurs onto SMBHs with , the majority of which would not be detected in even the most sensitive optical surveys. See section 5.1.
-
(2).
Using our derived relative mass accretion rates for the sample and assuming a typical accretion efficiency of , we assessed the characteristic mean mass doubling times () for AGNs in the very nearby Universe. For AGNs hosting SMBHs with – we find consistent growth times (–198 Gyrs) with those of the NL-AGNs identified in the SDSS (H04). However, we also find that SMBHs with (i.e., below the spectral resolution limit of the SDSS), are amongst the most rapidly growing SMBHs in the local Universe, with present-day growth times consistent with (and possibly less than) the current age of the Universe ( Gyrs). See section 5.2.
-
(3).
To assess the incidence of this population of low mass, rapidly growing SMBHs, we constructed a local space density function of active SMBHs. We find that active SMBHs may be at least a factor more common than previously identified in NL-AGN surveys using SDSS data. Furthermore, we estimate a non-negligible space density for low mass SMBHs () of which is consistent with the space density of more massive active SMBHs (; i.e., those previously determined to be the most rapidly accreting population of SMBHs). See section 5.3
-
(4).
Using a local total SMBH mass function (Marconi et al. 2004), we estimate a mean volume-weighted local AGN fraction of percent, which remains relatively constant in the mass range –. However, when only considering the SMBHs with (i.e., radiatively efficient accretion systems), we find tentative evidence for an increasing AGN fraction ( and percent) with decreasing SMBH mass (for – and –, respectively). See section 5.4
Acknowledgments
We thank the referee for a considered report which significantly improved the paper. We also thank the Science & Technologies Facilities Council (ADG; BDL), the Royal Society (DMA), the Leverhulme Trust (DMA; JRM) and the Einstein Postdoctoral Fellowship (grant number PF9-00064; BDL) for funding. We would like to thank A. Edge, J. Geach, J. Greene, J. Lucey, M. Norris, I. Smail and V. Wild for useful conversations. The authors acknowledge the use of the GALFIT program of Peng et al. This research has made use of the NASA/IPAC Extra-galactic Database (NED) and the NASA Spitzer Space Telescope which are operated by the Jet Propulsion Laboratory, California Institute of Technology, under contract with the National Aeronautics and Space Administration. This publication also makes use of data from the 2MASS Extended Mission Ancillary Products, a project collaboration between The University of Massachusetts and the Infrared Processing and Analysis Center (JPL/ Caltech).
References
- Allen et al. (2008) Allen M. G., Groves B. A., Dopita M. A., Sutherland R. S., Kewley L. J., 2008, ApJS, 178, 20
- Alonso-Herrero et al. (2008) Alonso-Herrero A., Pérez-González P. G., Rieke G. H., Alexander D. M., Rigby J. R., Papovich C., Donley J. L., Rigopoulou D., 2008, ApJ, 677, 127
- Antonucci (1993) Antonucci R., 1993, ARA&A, 31, 473
- Armus et al. (2006) Armus L., Bernard-Salas J., Spoon H. W. W., Marshall J. A., Charmandaris V., et al. 2006, ApJ, 640, 204
- Awaki et al. (2008) Awaki H., et al. 2008, PASJ, 60, 293
- Baldwin et al. (1981) Baldwin J. A., Phillips M. M., Terlevich R., 1981, PASP, 93, 5
- Barth et al. (2005) Barth A. J., Greene J. E., Ho L. C., 2005, ApJ, 619, L151
- Barth et al. (2002) Barth A. J., Ho L. C., Sargent W. L. W., 2002, AJ, 124, 2607
- Barth et al. (2009) Barth A. J., Strigari L. E., Bentz M. C., Greene J. E., Ho L. C., 2009, ApJ, 690, 1031
- Beckmann et al. (2007) Beckmann V., Barthelmy S. D., Courvoisier T. J.-L., Gehrels N., Soldi S., Tueller J., Wendt G., 2007, A&A, 475, 827
- Benson et al. (2007) Benson A. J., Džanović D., Frenk C. S., Sharples R., 2007, MNRAS, 379, 841
- Bentz et al. (2009) Bentz M. C., Peterson B. M., Netzer H., Pogge R. W., Vestergaard M., 2009, ApJ, 697, 160
- Bentz et al. (2009) Bentz M. C., Peterson B. M., Pogge R. W., Vestergaard M., 2009, ApJ, 694, L166
- Bird et al. (2007) Bird A. J., et al. 2007, ApJS, 170, 175
- Blandford & McKee (1982) Blandford R. D., McKee C. F., 1982, ApJ, 255, 419
- Brenneman & Reynolds (2006) Brenneman L. W., Reynolds C. S., 2006, ApJ, 652, 1028
- Buchanan et al. (2006) Buchanan C. L., Gallimore J. F., O’Dea C. P., Baum S. A., Axon D. J., Robinson A., Elitzur M., Elvis M., 2006, AJ, 132, 401
- Cappi et al. (2006) Cappi M., et al. 2006, A&A, 446, 459
- Cowie et al. (2003) Cowie L. L., Barger A. J., Bautz M. W., Brandt W. N., Garmire G. P., 2003, ApJ, 584, L57
- Dadina (2007) Dadina M., 2007, A&A, 461, 1209
- Dale et al. (2009) Dale D. A., Smith J. D. T., et al. 2009, ApJ, 693, 1821
- Dasyra et al. (2008) Dasyra K. M., Ho L. C., Armus L., Ogle P., Helou G., Peterson B. M., Lutz D., Netzer H., Sturm E., 2008, ApJ, 674, L9
- de Vaucouleurs et al. (1991) de Vaucouleurs G., de Vaucouleurs A., Corwin Jr. H. G., Buta R. J., Paturel G., Fouque P., 1991, Third Reference Catalogue of Bright Galaxies. Volume 1-3, XII, 2069 pp. 7 figs.. Springer-Verlag Berlin Heidelberg New York
- Deo et al. (2007) Deo R. P., Crenshaw D. M., Kraemer S. B., Dietrich M., Elitzur M., Teplitz H., Turner T. J., 2007, ApJ, 671, 124
- Done et al. (1996) Done C., Madejski G. M., Smith D. A., 1996, ApJ, 463, L63+
- Dudik et al. (2009) Dudik R. P., Satyapal S., Marcu D., 2009, ApJ, 691, 1501
- Elvis et al. (2004) Elvis M., Risaliti G., Nicastro F., Miller J. M., Fiore F., Puccetti S., 2004, ApJ, 615, L25
- Fabian et al. (2009) Fabian A. C., Zoghbi A., Ross R. R., Uttley P., Gallo L. C., et al. 2009, Nature, 459, 540
- Ferrarese & Merritt (2000) Ferrarese L., Merritt D., 2000, ApJ, 539, L9
- Fukazawa et al. (2001) Fukazawa Y., Iyomoto N., Kubota A., Matsumoto Y., Makishima K., 2001, A&A, 374, 73
- Garcia-Rissmann et al. (2005) Garcia-Rissmann A., Vega L. R., Asari N. V., Cid Fernandes R., Schmitt H., González Delgado R. M., Storchi-Bergmann T., 2005, MNRAS, 359, 765
- Gebhardt et al. (2000) Gebhardt K., et al. 2000, ApJ, 539, L13
- Goulding & Alexander (2009) Goulding A. D., Alexander D. M., 2009, MNRAS, 398, 1165
- Greene & Ho (2006) Greene J. E., Ho L. C., 2006, ApJ, 641, L21
- Greene & Ho (2007) Greene J. E., Ho L. C., 2007, ApJ, 667, 131
- Greenhill et al. (1996) Greenhill L. J., Gwinn C. R., Antonucci R., Barvainis R., 1996, ApJ, 472, L21+
- Greenhill et al. (1997) Greenhill L. J., Moran J. M., Herrnstein J. R., 1997, ApJ, 481, L23+
- Guainazzi et al. (2000) Guainazzi M., Matt G., Brandt W. N., Antonelli L. A., Barr P., Bassani L., 2000, A&A, 356, 463
- Guainazzi et al. (2004) Guainazzi M., Rodriguez-Pascual P., Fabian A. C., Iwasawa K., Matt G., 2004, MNRAS, 355, 297
- Hao et al. (2009) Hao L., Wu Y., Charmandaris V., Spoon H. W. W., Bernard-Salas J., Devost D., Lebouteiller V., Houck J. R., 2009, ApJ, 704, 1159
- Hasinger et al. (2005) Hasinger G., Miyaji T., Schmidt M., 2005, A&A, 441, 417
- Häussler et al. (2007) Häussler B., McIntosh D. H., Barden M., Bell E. F., Rix H.-W., et al 2007, ApJS, 172, 615
- Heckman et al. (2004) Heckman T. M., Kauffmann G., Brinchmann J., Charlot S., Tremonti C., White S. D. M., 2004, ApJ, 613, 109
- Ho et al. (1997a) Ho L. C., Filippenko A. V., Sargent W. L. W., 1997a, ApJS, 112, 315
- Ho et al. (1997b) Ho L. C., Filippenko A. V., Sargent W. L. W., 1997b, ApJ, 487, 568
- Ho et al. (2009) Ho L. C., Greene J. E., Filippenko A. V., Sargent W. L. W., 2009, ApJS, 183, 1
- Ho & Ulvestad (2001) Ho L. C., Ulvestad J. S., 2001, ApJS, 133, 77
- Hopkins et al. (2007) Hopkins P. F., Richards G. T., Hernquist L., 2007, ApJ, 654, 731
- Israel (1998) Israel F. P., 1998, A&AR, 8, 237
- Itoh et al. (2008) Itoh T., Done C., Makishima K., Madejski G., et al. 2008, PASJ, 60, 251
- Iwasawa et al. (1993) Iwasawa K., Koyama K., Awaki H., Kunieda H., Makishima K., Tsuru T., Ohashi T., Nakai N., 1993, ApJ, 409, 155
- Iyomoto et al. (2001) Iyomoto N., Fukazawa Y., Nakai N., Ishihara Y., 2001, ApJ, 561, L69
- Jarrett et al. (2003) Jarrett T. H., Chester T., Cutri R., Schneider S. E., Huchra J. P., 2003, AJ, 125, 525
- Kauffmann et al. (2003) Kauffmann G., Heckman T. M., Tremonti C., et al. 2003, MNRAS, 346, 1055
- King et al. (2008) King A. R., Pringle J. E., Hofmann J. A., 2008, MNRAS, 385, 1621
- Kormendy & Kennicutt (2004) Kormendy J., Kennicutt Jr. R. C., 2004, ARA&A, 42, 603
- Kormendy & Richstone (1995) Kormendy J., Richstone D., 1995, ARA&A, 33, 581
- Madejski et al. (2000) Madejski G., Życki P., Done C., Valinia A., Blanco P., Rothschild R., Turek B., 2000, ApJ, 535, L87
- Magorrian et al. (1998) Magorrian J., Tremaine S., Richstone D., Bender R., Bower G., Dressler A., Faber S. M., Gebhardt K., Green R., Grillmair C., Kormendy J., Lauer T., 1998, AJ, 115, 2285
- Maiolino et al. (1998) Maiolino R., Salvati M., Bassani L., Dadina M., della Ceca R., Matt G., Risaliti G., Zamorani G., 1998, A&A, 338, 781
- Marconi et al. (2001) Marconi A., Capetti A., Axon D. J., Koekemoer A., Macchetto D., Schreier E. J., 2001, ApJ, 549, 915
- Marconi et al. (2004) Marconi A., Risaliti G., Gilli R., Hunt L. K., Maiolino R., Salvati M., 2004, MNRAS, 351, 169
- Matsumoto et al. (2004) Matsumoto C., Nava A., Maddox L. A., Leighly K. M., Grupe D., Awaki H., Ueno S., 2004, ApJ, 617, 930
- Matt et al. (1997) Matt G., et al. 1997, A&A, 325, L13
- McLure & Dunlop (2004) McLure R. J., Dunlop J. S., 2004, MNRAS, 352, 1390
- Meléndez et al. (2008) Meléndez M., Kraemer S. B., Armentrout B. K., Deo R. P., Crenshaw D. M., Schmitt H. R., Mushotzky R. F., Tueller J., Markwardt C. B., Winter L., 2008, ApJ, 682, 94
- Mould et al. (2000) Mould J. R., Huchra J. P., et al. 2000, ApJ, 529, 786
- Narayan & Yi (1994) Narayan R., Yi I., 1994, ApJ, 428, L13
- Nelson et al. (2004) Nelson C. H., Green R. F., Bower G., Gebhardt K., Weistrop D., 2004, ApJ, 615, 652
- Onken et al. (2004) Onken C. A., Ferrarese L., Merritt D., Peterson B. M., Pogge R. W., Vestergaard M., Wandel A., 2004, ApJ, 615, 645
- Onken et al. (2003) Onken C. A., Peterson B. M., Dietrich M., Robinson A., Salamanca I. M., 2003, ApJ, 585, 121
- Peng et al. (2002) Peng C. Y., Ho L. C., Impey C. D., Rix H.-W., 2002, AJ, 124, 266
- Peterson & Wandel (1999) Peterson B. M., Wandel A., 1999, ApJ, 521, L95
- Pounds et al. (2004) Pounds K. A., Reeves J. N., King A. R., Page K. L., 2004, MNRAS, 350, 10
- Ratnam & Salucci (2000) Ratnam C., Salucci P., 2000, New Astronomy, 5, 427
- Rees (1984) Rees M. J., 1984, ARA&A, 22, 471
- Risaliti et al. (2009) Risaliti G., Salvati M., Elvis M., Fabbiano G., Baldi A., Bianchi S., Braito V., Guainazzi M., Matt G., Miniutti G., Reeves J., Soria R., Zezas A., 2009, MNRAS, 393, L1
- Roberts et al. (2001) Roberts T. P., Schurch N. J., Warwick R. S., 2001, MNRAS, 324, 737
- Sanders et al. (2003) Sanders D. B., Mazzarella J. M., Kim D.-C., Surace J. A., Soifer B. T., 2003, AJ, 126, 1607
- Satyapal et al. (2008) Satyapal S., Vega D., Dudik R. P., Abel N. P., Heckman T., 2008, ApJ, 677, 926
- Satyapal et al. (2007) Satyapal S., Vega D., Heckman T., O’Halloran B., Dudik R., 2007, ApJ, 663, L9
- Schaerer & Stasińska (1999) Schaerer D., Stasińska G., 1999, A&A, 345, L17
- Shirai et al. (2008) Shirai H., Fukazawa Y., Sasada M., Ohno M., Yonetoku D., Yokota S., Fujimoto R., Murakami T., Terashima Y., Awaki H., Ikeda S., Ozawa M., Tsuru T. G., 2008, PASJ, 60, 263
- Soltan (1982) Soltan A., 1982, MNRAS, 200, 115
- Tanaka et al. (1994) Tanaka Y., Inoue H., Holt S. S., 1994, PASJ, 46, L37
- Tommasin et al. (2010) Tommasin S., Spinoglio L., Malkan M. A., Fazio G., 2010, ApJ, 709, 1257
- Treister & Urry (2006) Treister E., Urry C. M., 2006, ApJ, 652, L79
- Tremaine et al. (2002) Tremaine S., Gebhardt K., Bender R., Bower G., Dressler A., Faber S. M., Filippenko A. V., Green R., Grillmair C., Ho L. C., Kormendy J., Lauer T. R., Magorrian J., Pinkney J., Richstone D., 2002, ApJ, 574, 740
- Tueller et al. (2008) Tueller J., Mushotzky R. F., Barthelmy S., Cannizzo J. K., Gehrels N., Markwardt C. B., Skinner G. K., Winter L. M., 2008, ApJ, 681, 113
- Ueda et al. (2003) Ueda Y., Akiyama M., Ohta K., Miyaji T., 2003, ApJ, 598, 886
- Valdes et al. (2004) Valdes F., Gupta R., Rose J. A., Singh H. P., Bell D. J., 2004, ApJS, 152, 251
- Vasudevan & Fabian (2009) Vasudevan R. V., Fabian A. C., 2009, MNRAS, 392, 1124
- Vasudevan et al. (2010) Vasudevan R. V., Fabian A. C., Gandhi P., Winter L. M., Mushotzky R. F., 2010, MNRAS, 402, 1081
- Vasudevan et al. (2009) Vasudevan R. V., Mushotzky R. F., Winter L. M., Fabian A. C., 2009, MNRAS, pp 1234–+
- Vignati et al. (1999) Vignati P., et al. 1999, A&A, 349, L57
- Wandel (1999) Wandel A., 1999, ApJ, 519, L39
- Wandel et al. (1999) Wandel A., Peterson B. M., Malkan M. A., 1999, ApJ, 526, 579
- Weedman et al. (2005) Weedman D. W., Hao L., Higdon S. J. U., Devost D., Wu Y., Charmandaris V., Brandl B., Bass E., Houck J. R., 2005, ApJ, 633, 706
- Whittle (1992) Whittle M., 1992, ApJS, 79, 49
- Winter et al. (2009) Winter L. M., Mushotzky R. F., Reynolds C. S., Tueller J., 2009, ApJ, 690, 1322
- Yang et al. (2009) Yang Y., Wilson A. S., Matt G., Terashima Y., Greenhill L. J., 2009, ApJ, 691, 131
- Yaqoob et al. (2007) Yaqoob T., et al. 2007, PASJ, 59, 283
- York et al. (2000) York D. G., Adelman J., Anderson Jr. J. E., Anderson S. F., et al 2000, AJ, 120, 1579
Appendix A Validation of derived space-density of active SMBHs
As the space-density of active SMBHs derived in this work is significantly larger than that found in previous studies, in this section we attempt to validate our results by discussing possible limitations and additional sources of error which may exist in these analyses: 1) whilst the sensitivity of the data used in this survey is high, the volume considered is relatively small compared to that of the SDSS, thus our results may be subject to cosmic variance; 2) given the modest errors associated with the estimates, the adopted binning structure is likely to be subjective and thus degenerate towards objects scattering between the defined bins. Under these assumptions, in §A1 we investigate whether the sample is indeed representative of the local Universe and in §A2 we discuss the construction of a Monte Carlo simulation to assess the effect of our adopted binning.
A.1 Is our sample representative of the local Universe?
Given the large incidence of AGNs within our sample it is possible that the volume considered in our sample is over-dense compared to other regions in the local Universe. The construction of the original sample of 64 bolometrically luminous galaxies in GA09 was designed to be complete down to the flux-limit of the Revised Bright Galaxy Sample. This imposed a distance constraint of Mpc (see Fig. 1 of GA09), and hence did not include the Virgo cluster at Mpc, and thus our sample does not incorporate known local over-densities; however, this volume may not be representative of the Universe at large.
To robustly test our considered volume ( Mpc3), we constructed a total SMBH space density function for all galaxies to Mpc and compared this to the local total (active+inactive) SMBH mass function of Marconi et al. (2004) derived from the luminosity function of local galaxies. Given the large co-moving volume () considered in Marconi et al. (2004), their derived SMBH mass function is unlikely to suffer from significant cosmic variance.
Our total SMBH mass function was formulated using all galaxies identified in the NASA/IPAC Extra-galactic Database (NED) to Mpc with a total K-band luminosity of . The luminosity threshold is designed to include all galaxies which could potentially host a SMBH with using the – relation. This conservative lower limit assumes that (i.e., that all galaxies in the sample have an early-type galaxy classification). In reality, the majority of the sources identified in NED to Mpc are late-type galaxies (i.e., ), and therefore the limit is likely to be . To Mpc, we identify 105 galaxies which potentially host a SMBH with . To estimate in each of these galaxies, we relate the associated Hubble-type from the Third Reference Catalogue of Bright Galaxies (de Vaucouleurs et al., 1991) to a mean bulge/disc ratio (e.g., Benson et al. 2007) and establish an individual bulge luminosity based on galaxy-type and . We convert the estimated bulge luminosity to using the – relation and construct a total SMBH mass function. Whilst this rather crude estimation carries large associated errors, we still find very good agreement (a mean variance of 0.1 dex) with the SMBH mass function of Marconi et al. (2004) throughout the mass range –. Thus, to first-order, our volume-limited sample does not appear to be over-dense and/or subject to strong cosmic variance, and hence, is broadly representative of the typical field-galaxy population in the local Universe.
We further validate this conclusion by estimating the active SMBH mass function for those AGNs which are sufficiently optically bright to be included in H04. Under this assumption, the derived space densities of active SMBHs for this sample and that of H04 should be comparable if our sample is indeed representative of a field-galaxy population. We find that using the H04 detection limit inferred from Fig. 3, our new estimated space density is consistent with H04 () throughout the mass range considered here (–), although there are still considerable uncertainties given the small number statistics inherent with our sample.
A.2 Monte Carlo Analysis of binning
We have established that our sample and the estimate of the SMBH mass density (both from active and inactive galaxies) do not appear to be subject to over-densities caused by cosmic variance. We therefore now investigate the effect of small-number statistics on our results which are inherent in relatively small samples such as this.
We show in §3 that accurate estimates of for our sample of AGNs from a homogeneous method is difficult to achieve. Thus, our adopted values of are derived from a variety of methodologies. In Fig. 5, the AGNs in the sample are placed into equal bins of with width 0.5 dex. However, this binning process does not allow for the error inherent to each individual measurement. Hence, some objects may scatter out of one defined bin and into another. The bin width we employ in our relatively modest sample (64 objects) may therefore be subjective and requires testing. Here we use a Monte Carlo analysis to assess the effect of the scattering of AGNs into different bins on the derived space density of active SMBHs in the local Universe ().
Our Monte Carlo analysis calculates by selecting a random set of SMBH masses from gaussian probability distributions constructed using our adopted masses and their associated 1- errors given in column 12 of Table 1. The binning structure was designed to incorporate at least one object in each bin from 250,000 realisations of the simulation across the considered mass range of the sample (–). We impose the upper mass limit as we have only one high-mass AGN (NGC 5128; ) in the sample. Thus, we determine that given our sample distribution the maximum number of equal width bins to be nine (i.e., equal bin sizes of 0.33 dex with object). Hence, we use our simulation to conservatively assess the maximum error on our calculated space density of active SMBHs.
The error shown in Fig. 5 (shaded region) is the standard deviation of the 250,000 simulations in our volume-limited sample combined in quadrature with the Poisson error determined from the number counts in our real sample. We found 250,000 realisations to be sufficient, since at this level the maximum variation in the standard deviation over multiple runs was less than .
We find that the mean spread in the derived value of from our volume-limited sample is dex, and as predicted appears to be subject to some scattering of . However, using our conservative error analyses, we show that the space density of active SMBHs found from our sample is consistently greater than that found for optical narrow-line AGNs (H04) with . Thus, to first-order, we find a significant increase (of a minimum factor of and a maximum of ) in the space density of active SMBHs in the local Universe in the mass range –. For our errors increase significantly due to very limited source statistics (see §4.1). We thus conclude that while this survey is subject to the scattering of objects through the bins, even in our most pessimistic case, we still find a significant increase in the space density of active SMBHs in the local Universe compared to that found in large-scale optical NL AGN studies.