Star-formation in the central kpc of the starburst/LINER galaxy NGC 1614
Abstract
Aims. The aim is to investigate the star-formation and LINER (Low Ionization Nuclear Emission Line Region) activity within the central kiloparsec of the galaxy NGC 1614. In this paper the radio continuum morphology, which provides a tracer of both nuclear and star-formation activity, and the distribution and dynamics of the cold molecular and atomic gas feeding this activity, are studied. In particular, the nature of an R300 pc nuclear ring of star-formation and its relationship to the LINER activity in NGC 1614 is addressed.
Methods. A high angular resolution, multi-wavelength study of the LINER galaxy NGC 1614 has been performed. Deep observations of the CO 1-0 spectral line were performed using the Owens Valley Radio Observatory (OVRO). These data have been complemented by extensive multi-frequency radio continuum and Hi absorption observations using the Very Large Array (VLA) and Multi-Element Radio Linked Interferometer Network (MERLIN).
Results. Toward the center of NGC 1614, we have detected a ring of radio continuum emission with a radius of 300 pc. This ring is coincident with previous radio and Pa observations. The dynamical mass of the ring based on Hi absorption is . The peak of the integrated CO 1-0 emission is shifted by 1′′ to the north-west of the ring center. An upper limit to the molecular gas mass in the ring region is . Inside the ring, there is a north to south elongated 1.4 GHz radio continuum feature, with a nuclear peak. This peak is also seen in the 5 GHz radio continuum and in the CO.
Conclusions. We suggest that the pc star forming ring represents the radius of a dynamical resonance - as an alternative to the scenario that the starburst is propagating outwards from the center into a molecular ring. The ring-like appearance is probably part of a spiral structure. Substantial amounts of molecular gas have passed the radius of the ring and reached the nuclear region. The nuclear peak seen in 5 GHz radio continuum and CO is likely related to previous star formation, where all molecular gas was not consumed. The LINER-like optical spectrum observed in NGC 1614 may be due to nuclear starburst activity, and not to an Active Galactic Nucleus (AGN). Although the presence of an AGN cannot be excluded.
Key Words.:
galaxies: evolution — galaxies: individual: NGC 1614 — galaxies: starburst — galaxies: active — radio lines: ISM — ISM: molecules — ISM: atoms1 Introduction
NGC 1614 is a luminous infrared galaxy (LIRG) at a distance of 64 Mpc (for =75 ). The galaxy is barred and interacting (morphologically classified as type SB(s)c pec) and its nuclear optical spectrum shows both starburst and LINER (Low Ionization Nuclear Emission Line Region) activity. Although there is still no single consensus to what is powering the emission in LINERs, nuclear starburst or AGN (Active Galactic Nucleus) activity are two major candidates (e.g. Ho 1999; Terashima et al. 2000; Alonso-Herrero et al. 2000). Bar-driven inflow of gas in galaxies has been suggested to trigger nuclear starbursts as well as feeding AGNs (e.g. Simkin, Su & Schwarz 1980; Scoville et al. 1985). However, the radial inflow of gas along the bar may be slowed down at certain radii, often associated with inner Lindblad resonances (ILR) (Combes 1988; Shlosman, Frank & Begelman 1989).
Previous studies of NGC 1614 include e.g. an optical, near-infrared, radio continuum and hi study by Neff et al. (1990). They suggested that the spectacular structure with tidal tails or plumes is the result of an earlier interaction with another galaxy of comparatively modest mass and impact velocity. Alonso-Herrero et al. (2001), hereafter AH2001, have investigated NGC 1614, in the optical and near-infrared. They detected a starburst nucleus of about 45 pc in diameter based on deep CO stellar absorption. The nucleus is surrounded by a 600 pc diameter ring of current star formation, which is revealed in Pa line emission. Just outside the star forming ring, a dust ring is indicated by its extinction shadow in . Neither Neff et al. (1990) nor AH2001 find any indication of an AGN. Scoville et al. (1989) used the Owens Valley Radio Observatory (OVRO), which contained three elements at that time, to map NGC 1614 in CO 1–0 at a resolution of . They found an unresolved CO-concentration with a mass of M⊙.
We have used OVRO to study the distribution and dynamics of the molecular gas at resolution. We have also studied the morphology of the 1.4 GHz radio continuum as well as the distribution and dynamics of the neutral gas via Hi in absorption at arcsecond resolution, using the Very Large Array (VLA). To study the morphology of the nuclear radio continuum, we used the Multi Element Radio Linked Interferometer Network (MERLIN) and obtained maps at higher (0.5 arcsecond) resolution, at 1.4 GHz and 5 GHz. The purpose of the studies was to provide information about the feeding and nature of the central activity giving rise to the LINER like spectrum in NGC 1614. In particular, we would like to address the question whether the LINER activity is due to an AGN or to a nuclear starburst.
2 Observations and data reduction
2.1 Owens Valley Radio Observatory
The OVRO mm interferometer was used to map NGC 1614 in CO 1–0 in the inner ( kpc). The array consists of six 10.4 m telescopes and was used in the equatorial and high resolution configuration. These observations were carried out in February 1996. The NRAO’s aips software package was used to deconvolve the images. We used data from both configurations together to produce maps with high sensitivity and image fidelity, and data from the high resolution configuration only to produce maps with high angular resolution. The resulting low and high resolution synthesized beams were and . The primary beam diameter was . The digital correlator was centered at 113.4 GHz (4800 ) and was configured to cover 448 MHz (1200 ), with 8 MHz (22 ) resolution. Typical system temperatures were 400 K.
2.2 Very Large Array
NGC 1614 was observed at 1.4 GHz with the VLA in the A-configuration in April 2006. The observations were interspersed with regular observations of the nearby phase calibrator 0423–013. The flux calibrator was 3C 286. The observations were centered on 1398 MHz, which corresponds to a velocity of 4778 . A two-IF mode was used, with a band width of 6.25 MHz per IF. The IFs were parallel in frequency, which resulted in a total frequency coverage of 6.25 MHz (1360 ). Each IF consisted of 32 channels with a bandwidth of 96 kHz, which corresponds to a velocity resolution of 21.3 . The data were edited and calibrated with aips standard procedures. The calibrated data were Fourier transformed to produce spectral line data cubes with two different weightings. The line free channels were combined to form continuum images, which were then subtracted from the spectral line data. The continuum images and the continuum subtracted spectral line data were separately deconvolved with the aips task apcln, and were then recombined to form the deconvolved spectral line data cubes. Two different weighting schemes were applied to the data in order to obtain maximum sensitivity and angular resolution. For maximum sensitivity, natural weighting was applied, which resulted in a synthesized beam of . For maximum angular resolution, a more uniform weighting (robustness parameter ) was applied. The resulting synthesized beam was . Further analysis such as presenting cleaned contoured continuum images, absorption spectra and moment maps were done with standard aips tasks.
In order to provide complementary high resolution radio continuum imaging of the central region of NGC 1614, data at 5 and 8.4 GHz was obtained from the VLA archive and re-imaged. These short snapshot data were observed on 27th July 1999 in the VLA’s highest resolution A-configuration. Each data-set was was calibrated using standard data reduction techniques, including phase referencing using a nearby calibrator, within the aips packages. The flux density scale of these observations was calibrated with respect to 3C 286 using the Baars et al. (1977) scale.
2.3 Multi Element Radio Linked Interferometer
MERLIN was used in August 2005 to observe NGC 1614 at 1420 MHz. The observations were interspersed with regular observations of the nearby phase calibrator 0436–089. 3C 286 was used as the primary calibrator and 0552+398 as the secondary. They were both observed at the beginning and end of the observing run. Dual bands of circular polarization were recorded over a total bandwidth of 8 MHz, which was correlated into 64 channels width a bandwidth of 125 kHz each, which equals a velocity resolution of 26 km s-1. Initial editing and calibration of the data was done at Jodrell Bank in September 2005 using the local MERLIN dprogs software. These data were read into aips and further calibration was done using the MERLIN pipeline, which included several cycles of self calibration on the phase calibrator. Our target source was not itself suitable for self calibration, following the constraints given in the MERLIN handbook, so the phase corrections derived from the phase calibrator were applied to our target source in the MERLIN pipeline. The calibrated uv data-set was Fourier transformed with no deconvolution initially applied. The line free channels were combined to produce continuum images which were used to subtract the continuum contribution in the spectral line cubes. The continuum images and the continuum subtracted spectral line data cubes were separately deconvolved with the aips task apcln, and were then recombined to form the deconvolved line data. The rather low declination of this source resulted in an elongated synthesized beam of .
In addition to the 1420 MHz MERLIN data, MERLIN observations at 4994 MHz were also obtained. These data consist of two full track observations of NGC 1614, made on 24th April and 19th May 2000. In each case observations of NGC 1614 were interspersed with scans of the phase reference source 0436–089, with additional observations of standard point source and flux density calibration sources at either end of the observing run. In total NGC 1614 was observed for 12 hr over the two observing dates. Both of these observations were independently calibrated and imaged using standard routines before the data were combined for final imaging of the target.
MERLIN has a shortest baseline spacing of 11 km. As a consequence 5 GHz observations with MERLIN are insensitive to diffuse radio structures larger than 1 arcsec. In order to restore these missing short spacing data, our MERLIN 5 GHz data were combined within the uv plane with the calibrated VLA A-configuration snapshot data (see Sect. 2.2), applying appropriate weightings to each data set according to their sensitivity. The resulting combined data set was then deconvolved and imaged to provide maps both sensitive to the large diffuse radio emission and with an angular resolution intermediate between the individual MERLIN and VLA images.
| Parameter | Value |
|---|---|
| CO-peak (J2000) | |
| Radio-peak (J2000) | |
| Optical peak (J2000)a | |
| Morphological type | SB(s)c pec |
| Systemic velocity | 4778 |
| Distanceb | 64 Mpc |
| Spatial scale | 1′′ = 310 pc |
| Inclinationc | |
| L⊙ | |
| Adopted conversion factor | (K )-1 |
| Adopted velocity convention | Optical heliocentric |
a): Neff et al., 1990
b): For =75
c): For the R= P ring, Alonso-Herrero et al., 2001
d): Alonso-Herrero et al., 2001
3 Results
3.1 The OVRO CO
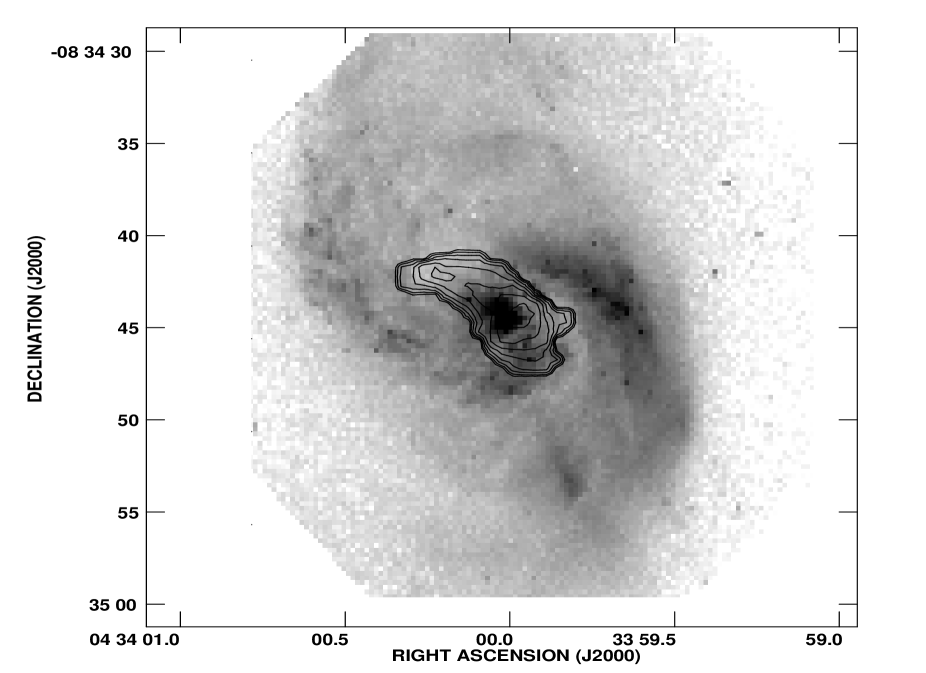
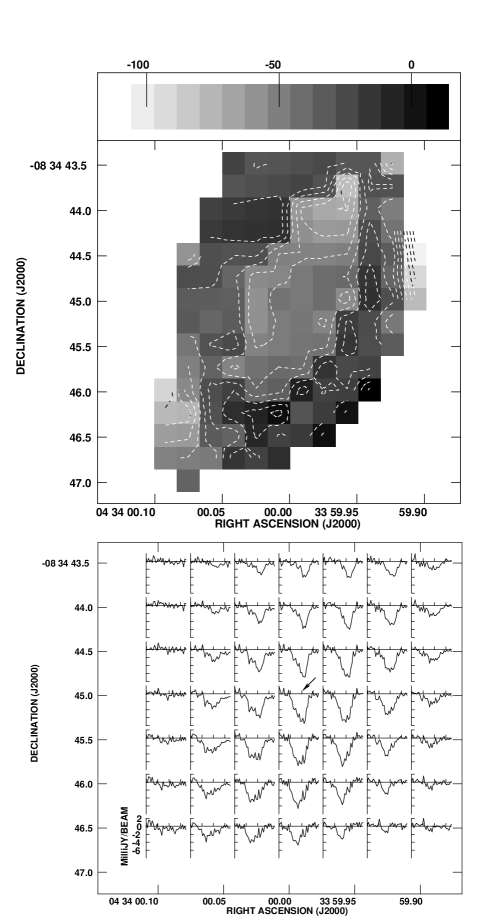
Figure 1 shows the high resolution integrated intensity contours overlayed on an F606W WFPC2 (optical) HST (Hubble Space Telescope) image. The optical peak position has a positional uncertainty of less than (Neff et al., 1990) and we estimate that the astrometrical alignment between the optical and CO is better than . The same CO integrated intensity map is also shown in Fig. 2 (left panel). The CO is centrally peaked, with an extension to the northeast, with CO at lower integrated intensity. A secondary peak is detected at (1 kpc) to the northeast.
The maximum integrated intensity is 34 Jy , in a beam of . With a standard CO to H2 conversion factor (see table 1), this corresponds to a molecular mass of M⊙ in the central beam. The projected surface density is 2600 M⊙ in the central beam. The deprojected surface density is 1600 M⊙ for the adopted inclination of 51∘.
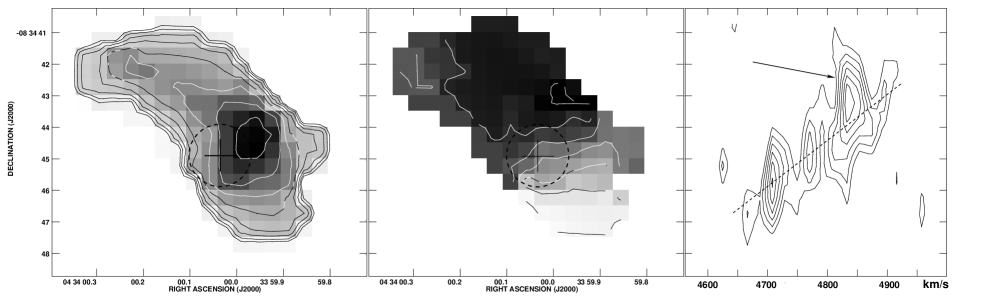
The high resolution velocity field map is shown in Fig. 2 (middle panel). The velocity contours are perpendicular to the main axis of the central CO structure, with velocities ranging from 4675 to 4825 . On a linear scale, the observed velocity gradient in the central corresponds to 140 per kpc. In the extension to the northeast, the velocity contours are more irregular, probably due to an additional kinematical component in this region. In Fig. 1, this feature is spatially consistent with a crossing dust lane.
The position velocity diagram, along the north to south direction, is shown in Fig. 2 (right panel). The position velocity diagram is averaged over a slit, centered on the peak of the integrated intensity. Three peaks are resolved. The two strongest peaks occur to the north and south of the center. The third peak, which is weaker, occur toward the center of the CO integrated intensity.
The low resolution CO data do not show any additional features as compared to the high resolution maps, but have higher sensitivity. The total flux recovered is 80 Jy , which corresponds to a molecular mass of M⊙. NGC 1614 was previously observed with OVRO (Scoville et al., 1989) at lower resolution (), where a total of 103 Jy was detected.
The global star formation rate (SFR) is related to () and is given by Kennicutt (1998) as SFR= M⊙ yr-1. This relation indicates an SFR of 52 M⊙ yr-1 in NGC 1614. The star formation efficiency, SFE, is given by SFE= and is (in the unit ). This is in good agreement with the expected value of 100 for interacting galaxies, given by e.g. Young et al. (1989); Planesas et al. (1997).
3.2 The VLA and MERLIN Radio Continuum
Figure 3 shows the VLA robustly weighted 1.4 GHz radio continuum map. The synthesized beam is . The total flux density recovered is 130 mJy and the noise level is 0.32 mJy beam-1. The maximum flux in one beam is 29 mJy. In a naturally weighted 1.4 GHz radio continuum map (with a synthesized beam of ), we recover a total flux density of 140 mJy.
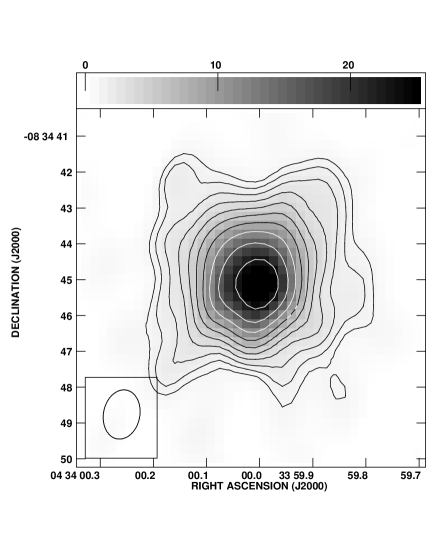
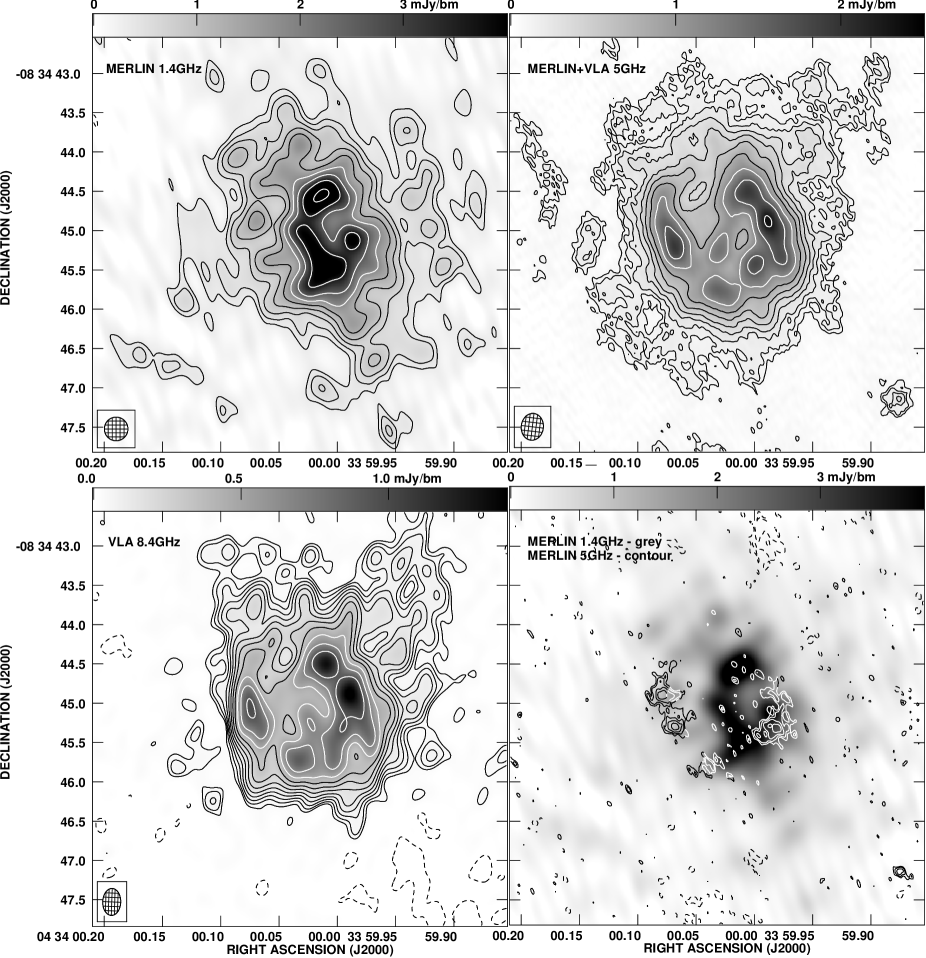
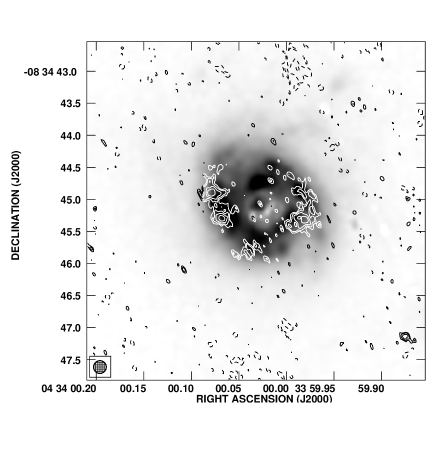
Figure 4 shows the MERLIN 1.4 GHz and 5 GHz radio continuum of the central region of NGC 1614, as well as archival VLA 5 GHz and 8.4 GHz radio continuum of the same region. Figure 5 shows the MERLIN 5 GHz radio continuum overlayed on a Pa map111Based on observations made with the NASA/ESA Hubble Space Telescope, obtained from the data archive at the Space Telescope Science Institute. STScI is operated by the Association of Universities for Research in Astronomy, Inc. under NASA contract NAS 5-26555 made with archival data from the Hubble Space Telescope, HST..
The Pa (the greyscale in Fig. 5) traces out a ring-like, patchy structure with a radius of (310 pc). This has previously been reported by AH2001. Inside of this ring, the Pa intensity is lower, except at the center, where there is a Pa peak. We have spatially aligned this peak with the position of the central peak of the 5 GHz MERLIN radio continuum (the contours in Fig. 5).
The MERLIN 5 GHz map, the combined MERLIN and VLA 5 GHz map and the VLA 8.4 GHz map all trace out the same ring-like structure as the Pa (see Fig. 4). We have chosen to refer to this structure as the star forming ring. The combined MERLIN and VLA 5 GHz map (upper right panel, Fig. 4) coincides remarkably well in space with the Pa, around the whole circumference of the star forming ring. In the MERLIN map alone (Fig. 5 and lower right panel in Fig. 4), some of the emission is resolved out, and mainly the eastern and western parts of the star forming ring are detected. It is also detected in the VLA 8.4 GHz map (lower left panel, Fig. 4).
The MERLIN 1.4 GHz map (Fig. 4, upper left panel) reveals a north to south bar like structure, with several peaks resolved. The two brightest peaks occur (310 pc) from the center, on the star forming ring toward the north and south respectively. The southern peak is spatially extended to the north, toward the center. The third peak occurs toward the west, in the Pa ring.
There is an unresolved peak at the center of the star forming ring, visible in most of our radio continuum maps. In particular, the peak is isolated in the MERLIN 5 GHz map, and tentatively present in all maps.
3.3 The VLA Hi Absorption
We have detected Hi in absorption in the central of NGC 1614. Figure 6 (lower panel) shows spectra from the VLA continuum subtracted spectral line data cube. Hi spectra from the MERLIN data (not shown) are consistent in width and optical depth with the VLA spectra, but are not used for the analysis or moment maps due to low signal to noise ratio.
The separation between individual spectra in Fig. 6 is in both RA and dec. The absolute depth of the absorption does not only depend on the column density of foreground Hi, but also on the flux density of the background radio continuum. Hence the absorption is deeper in the central spectra, and no absorption is detected outside a radius of in the east to west direction. To the north and south (not shown in this map) there are tentative detections out to a radius of .
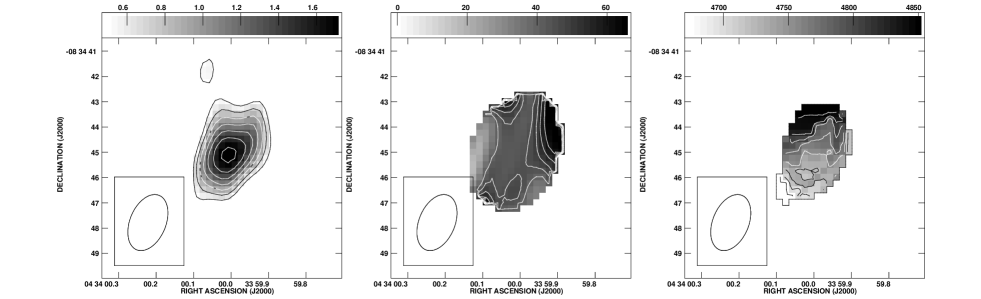
The moment maps of the Hi data are shown in Fig. 7. The left panel is the integrated absorption. Its peak occurs close to the radio continuum peak ( but is not a true measure of the Hi distribution). The middle panel shows the integrated opacity (). This map has been blanked outside of the region where the radio continuum flux density is less than 10 mJy beam-1, since the noise in this map increases dramatically where there is little or no radio continuum. The integrated opacity is a measure of the foreground absorbing Hi, and there is a clear east to west gradient in this map.
The column density of absorbing atomic hydrogen, , has been calculated at several positions using the equation
where is the spin (excitation) temperature, and is the integrated opacity (from Fig. 7) in . can be reasonably assumed to be 100 K (Maloney, Hollenbach & Thielens, 1996), although it should be noted that the value of is dependent on the physical conditions of the gas.
The maximum column density occur to the west and northwest of the radio continuum peak, where the peak opacity is and the velocity width is 200 . These values result in a column density approaching . East of the radio continuum peak, the column density is approximately 50% lower.
The right panel of Fig. 7 shows the velocity field. There is a clear north to south velocity gradient, where the southern end is approaching and the northern end receeding, similar to what is seen in CO.
3.4 Dynamical results with gal
We used the velocity of the OVRO CO data to fit a solid body rotation curve to the inner with the aips task gal. For solid body rotation, the inclination and rotational velocity can not both be fitted with gal, since they are directly dependent on each other. We therefore kept the inclination fixed at , which is the inclination of the star forming ring (AH2001). The dynamical center was kept fixed at the CO-peak (see Table 1). The fit gave a rotation of 40 per arcsecond (130 per kpc), which we used to calculate a dynamical mass within a radius of (1240 pc). We used the Keplerian relation
where is in and in pc. This resulted in a dynamical mass of , which has to be taken as an estimate since we can not rule out the presence of non-circular orbits. The ratio of dynamical mass over molecular mass detected in the integrated intensity map is .
The residual velocity field, after the fitted rotation curve was subtracted, was also calculated with gal. The residual velocities range from to 50, and the zero point in the residual field occur toward the dynamical center.
The velocity field derived from the naturally weighted VLA continuum subtracted spectral line data cube is shown in Fig. 7 (right panel). The main north to south rotation is clearly seen, but also a deviation in the velocity field in the northern half of the galaxy. As seen in Fig. 6 (lower panel), there are broad absorption line wings in several spectra. In order to isolate the main rotation from additional kinematical components, we used the aips task gal to fit a solid body rotation curve to only the deepest, narrow absorption components. We used a cut off level of mJy per beam to derive a main velocity field. We fitted a rotation curve, which was then subtracted from the original velocity field (Fig. 7, right panel). The fitted solid body rotation was 210 per kpc, and the residual of the velocity field is shown in Fig. 6 (upper panel). The observed residuals are all blueshifted, with 100 over most of the fitted area (the central ).
4 Discussion
4.1 Large scale molecular distribution and dynamics
The integrated intensity and velocity field of the OVRO CO data is shown in Fig. 2 (left and middle panel). To the northeast, there is a CO extension, and the gradient in the velocity field falls, as compared to the gradient in the center. We believe that this extension is caused by a separate, foreground gas component, associated with a dust lane, which can be seen in Fig. 1 (the lighter region northeast of the nucleus). This component is likely not to be in the same plane as the spiral arms visible in the same figure. For further discussion of this feature see Sect. 4.8.
The position velocity diagram of the same data (Fig. 2, right panel) also shows an additional, blueshifted component which is associated with the foreground dust lane. The dotted line in the position velocity diagram was interpolated between the southern and central peaks (not contaminated by the dust lane) and then extrapolated to the north. The additional component is marked in the figure. We conclude that the bulk of the CO is associated with a symmetric, slightly elongated bar like structure, and that there is a second CO component associated with a foreground dust lane to the northeast. The CO-contours in Fig. 1 also shows an extension to the west of the main CO peak. This extension is consistent with also being associated with the same foreground dust lane, which crosses the galaxy from the northeast to the southwest.
Note that the CO peak is offset from the radio continuum peak (and also the starburst ring) by 1′′ to the north-west (Fig. 2). This is consistent both with the east-west extinction seen by AH2001 and the east-west gradient in opacity in atomic hydrogen in absorption found in this paper in Sect. 3.3. This suggests that the extinction shadow found by AH2001 is not a part of a complete ring but actually represents a true lopsidedness in gas and dust around the center.
4.2 The atomic gas – column densities and dynamics
As described in Sect. 3.3 and seen in the integrated opacity map (Fig. 7, middle panel), the maximum column density of absorbing Hi does not occur toward the radio continuum peak. To the contrary, the highest opacity occur at the edges of the integrated opacity map. This effect is better seen in the major axis position velocity diagram of the opacity (Fig. 8), which clearly shows two separate opacity peaks, to the north and south respectively. The position velocity diagram is blanked where the background VLA radio continuum flux density is less than 10 mJy beam-1, which spatially corresponds to 500 pc to the north and south of the radio continuum peak. The peak opacities occur close to the edges of the position velocity diagram, i.e. at 400 pc. This is consistent with, or slightly larger than, the radius of the star forming ring described in Sect. 3.2, and we conclude that most of the absorbing Hi is associated with the outer parts of this ring. The northern and southern peaks are also seen in the integrated opacity map (Fig. 7, middle panel), which also shows a clear east to west opacity gradient, with a peak to the northwest. This peak is spatially consistent with the western end of the dust lane (the light region northwest of the CO-peak in Fig. 1) and is consistent with the extension seen in the CO-contours in this region.
In Sect. 3.4, we isolated the main Hi rotation, and showed that the residual Hi velocity field is all blueshifted (Fig. 6), with velocities of 100 over most of the fitted area (the central ). We interpret this as a large outflow, or super wind, associated with the past and current star formation. Superwinds are found in almost all infrared-luminous galaxies (Rupke et al. 2005). For an inclination of , our observations correspond to a deprojected wind velocity of 160 . This is in good agreement with the average outflow velocity of the ionized gas in LIRGs of 170 (Lehnert & Heckman, 1996).
4.3 The central radio continuum – a nuclear ring or spiral
In Sect. 3.2, we described a star forming ring with a radius of (310 pc), seen in the MERLIN and VLA radio continuum and in the Pa archival data. (Fig. 4 & 5). It has been detected previously in the Pa, by AH2001, and with the VLA at lower resolution by Hummel et al. (1987) and Neff et al. (1990).
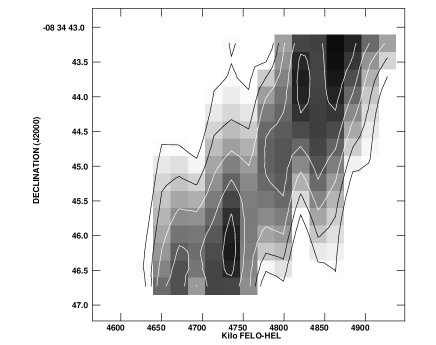
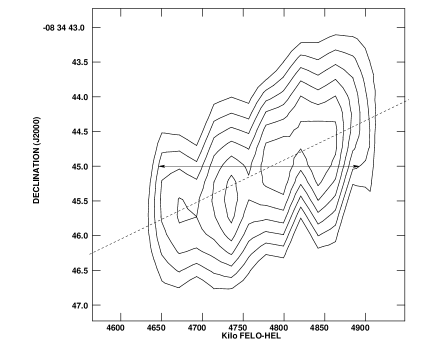
The molecular mass in the central OVRO CO beam () is M⊙, using the conversion factor in Table 1. This mass can be used as an upper limit to the molecular mass associated with the star forming ring. This is a conservative upper limit since most of the CO peak appears not associated with the ring itself, but resides 1′′ to the north-west of it. To make a mass budget for the ring, we have estimated the dynamical mass in the central . The highest possible spatial resolution was needed, and we used the VLA Hi absorption data (with a synthesized beam of ). Three peaks are resolved in the position velocity diagram (Fig. 9), and we estimated a projected velocity gradient in the ring of 170 arcsec-1, based on the slope of the dotted line in Fig. 9. A more conservative estimate would be to use the central line width at 50% of the maximum absorption in the position velocity diagram (the arrow in Fig. 9), which is 240 , and would give a projected velocity gradient in the ring of 120 arcsec-1 . For these two velocity gradients and an inclination of 51∘, using the Keplerian relation.
where is in and in pc, we derive a dynamical mass range of (conservative) to in the central .
This is a factor of higher than the value calculated by AH2001. They reported that the molecular gas mass, as calculated with a standard CO to H2 conversion factor, would clearly exceed the dynamical mass of the star forming ring. The higher angular resolution of our OVRO data, as compared to previous observations by Scoville et al. (1989), has better isolated the CO in the star forming ring, and provides a molecular gas mass estimate of . This, and our higher dynamical mass, allows a mass budget including all of the molecular gas detected in the central OVRO beam.
Note that the CO peak is offset from the radio continuum peak by about 1′′ suggesting that most of the molecular mass in the CO peak is not associated with the star forming ring. This further enforces the conclusion that there is no direct conflict between the estimated molecular mass and the dynamical mass of the ring.
4.4 Is there a bar in NGC 1614?
The origin of the star forming ring can either be a nuclear starburst, that has consumed most of the gas in the inner , and is progressing outwards, or it can have dynamical origin, possibly associated with an inner Lindblad resonance (ILR), where the gas would pile up (Combes 1988a; Shlosman et al. 1989). NGC 1614 has previously been described as a textbook example of a propagating starburst that started in the nucleus of a late-type, large spiral galaxy, has grown outward to a radius of pc, and is potentially still growing into a circumnuclear ring of molecular material just outside this radius (AH2001).
We suggest that, instead of being the result of a starburst spreading outward from the center, the star forming ring represents the radius of a dynamical resonance. The ring-like appearance may be part of a spiral structure, extending from the nuclear region, inside of the ring, out to the spiral arms visible in the F606W WFPC2 HST image (Fig. 1).
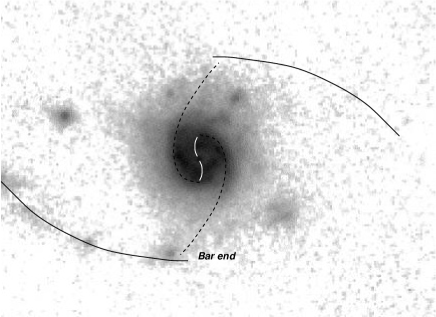
This scenario is shown in Fig. 10, where the greyscale is the Pa emission and the different dynamical features are marked with arcs. The outer black arcs represent the main spiral arms, which are clearly visible in the F606W WFPC2 HST image and Pa images (Fig. 5 & 10). The dashed arcs represent the continuation of the main spiral arms toward the center, probably associated with the leading edge of a bar. We believe that the gas flows along the leading edge of the bar, and piles up at the radius of the star forming ring.
Inside the ring, there may be a dynamically decoupled bar, in the north to south direction, which connects to the nucleus (the white arcs in Fig. 10). The gas mass fraction in the central is well over 10% which is the required lower limit (Hunt et al., 2008) for an inner bar to decouple from the outer bar. The north-south feature in the 1.4 GHz MERLIN map (Fig. 4) may represent such an inner, decoupled bar.
The ring formed at the resonance acts as a barrier preventing further mass inflow, but Shlosman solved this by forming inner bars that may connect with the outer bar, i.e. nested bars (e.g. Shlosman 2003). A problem in our interpretation may then be that the nested bar forms after the ring formation and thus the activity in the center should therefore be younger than the activity in the ring. However, there are at least two arguments that counter this. Gas may flow to the nucleus before the ring is fully formed where it can feed an AGN or a starburst. The nuclear activity may not be triggered immediately but is dependent on gas build-up times and dynamics. Furthermore, the star formation in the ring itself may well be episodic and the ring could go through several bursts.
Sarzi et al. (2007) discuss the formation of rings in systems both with and without strong kpc-scale bars. The morphology of the resonant nuclear rings in their sample is almost identical to the ring of NGC 1614 complete with a nuclear AGN and/or starburst. Sarzi et al. discuss how the formation of such rings may, instead of being caused by strong bars, originate due to a weak oval distortion or the tidal effects of a companion (e.g. Combes 1988b, Buta et al. 1995). Knapen et al. (2004) find a nuclear ring in NGC 278 triggered by the non-axisymmetric potential induced by a recent minor merger.
Finding dynamically induced starbursts in interacting galaxies is not unusual (e.g. Jogee et al. 2002; Keto, Ho & Lo 2005; ) where rings and inner spirals/bars are associated with the locations of resonances. A prominent and well studied example is the nearby starburst galaxy M 82 which exhibits a molecular ring with a radius of 200 pc as seen in CO 1–0 (Walter, Weiss & Scoville 2002). This ring has also been studied in the highly excited CO 6–5 gas (Seaquist, Lee & Moriarty-Schieven 2006) where it appears to be dynamically associated with the transfer of gas from orbits in the large scale bar to perpendicular inner orbits.
4.4.1 Evidence for a barred potential
Work by Chapelon et al. (1999) (C99) adresses the issues of starbursts in barred spiral galaxies. C99 claim that NGC 1614 is a barred galaxy with a bar PA of 37∘, a bar length a of 5′′ and a deprojected a/b ratio of 0.23. C99 based their conclusions on optical CCD images and it is interesting to note that this PA is similar to that for the crossing dust lane and CO distribution.
Limits on the parameters of a possible bar in NGC 1614 can be put on the onset of the prominent two-armed spiral structure. Defining where the arms actually start is not straight forward - but an estimate from the HST image suggests 7′′ as a projected limit. The prominent dust lane crossing just north of the central regions of NGC 1614 makes it difficult to judge the stellar structure and backbone of the galaxy in the visible band. We therefore investigated a 2.2 micron K-band image with 0.3 arcsecond resolution (from Calzetti 1997). The K-band image reveals that between a radius of 1.1 and 0.4 kpc there is an apparent oval distortion of a/b axis ratio of 0.66 (and PA of 0 degrees) dropping to unity at radius 0.4 kpc. This is roughly where the nuclear ring commences. There is thus either a weak north-south bar with projected length 2.2 kpc, or there is a warp in the inner kpc. Warps can occur in interacting systems. One example is the warped gas of NGC 3718 (Krips et al., 2005). One difference here is then that the dust lane of NGC 1614 would be at an angle to the warp - and not part of the warped structure - as it is in NGC 3718. If there is a warp in NGC 1614 it would have to be gentle (because of the high axis ratio) but still happen rather quickly (from 1.1 to 0.4 kpc). Thus, instead of a bar with PA 37∘ suggested by C99 we propose a north-south bar based on the K-band image.
The CO velocity field suggests an S-shaped distortion in the iso-velocity contours. This is typical of barred galaxies - but may also be the results of a warp (or ouflows or other non-circular motions). The CO morphology is strongly affected by the crossing dust lane but is consistent with a north-south structure. It is important to note that the CO peak and distribution is offset from that of the starburst ring. The CO peak is located 1′′ north-west of the radio continuum peak (and center of the radio continuum ring). This is to some degree caused by the crossing dust structure - but not entirely. There is also a compact feature at =4870 that helps to shift the integrated CO peak to the north-west. This could be the result of orbit crowding, but higher resolution observations are necessary to determine the inner CO dynamics of NGC 1614. It is furthermore interesting to note that in both the CO and Hi velocity field the velocity contours make a twist at the location of the starburst ring resulting in a local PA of 30-40 degrees (see Fig. 2). Such a PA is consistent with the shape of the P ring morphology. Again, high resolution CO data are necessary to determine both the CO morphology and dynamics across the ring and in the surrounding structure.
4.5 Nuclear radio continuum morphology and star formation
Figure 4 (lower right panel) shows the 1.4 GHz MERLIN in greyscale and the 5 GHz MERLIN in contours. The star forming ring is clearly seen in the 5 GHz data, while the nuclear region is better shown in the 1.4 GHz data, which has one of its peaks close to the center of the star forming ring.
The strongest 1.4 GHz peak (the northern one) is 5.5 mJy in a circular beam of . This can be converted to a source temperature of 53 000 K. This is an upper limit for the central peak, at this resolution, and is consistent with a scenario of a cluster of SNRs in the ring. However, an AGN can not be ruled out based on source temperature at this resolution, but higher resolution is needed.
NGC 1614 has been observed with Very Long Baseline Interferometry (VLBI) by Corbett et al. (2002), who did not find any unresolved radio core. Hill et al. (2001) used long-baseline interferometry with The Australia Telescope and reported that less than 0.9% of the flux density at 2.3 GHz is associated with an unresolved radio core.
In Fig. 4 the 1.4 GHz continuum is more centrally peaked as compared to the 5 GHz continuum, which instead shows a ring with a radius of . We interpret this as that the 1.4 GHz continuum is mostly related to supernova remnants, and traces old star formation, while the 5 GHz and 8.4 GHz continuum is more related to free-free emission from HII-regions, and thereby traces current star formation. The ages of the starbursts can be estimated using the spectral index, , (assuming S) as calculated between the 1.4 GHz and 5 GHz maps (the upper panels in Fig. 4) toward the relevant areas (e.g. Hirashita & Hunt, 2006). Toward the center the spectral index is , which indicates clearly synchrotron dominated emission and an age of the starburst exceeding 10 Myr. Although the fidelity of the MERLIN 1.4 GHz map is poor, the spectral index in the star forming ring is significantly different and is , which indicates thermal emission and a starburst age of 5 Myr.
We conclude that our radio continuum observations are in good agreement with the notion of an old nuclear starburst, and younger starbursts in a pc ring.
4.6 Is there an AGN?
We see no direct evidence of an AGN in our data. However, the presence of an AGN can not be ruled out, and is not in direct contradiction with our observations. The middle peak in the MERLIN 1.4 GHz (and in the MERLIN + VLA 5 GHz) radio continuum appears close to the center of the star forming ring, and could be associated with an AGN. Observations at higher angular resolution and sensitivity are needed to resolve this issue, although neither Hill et al.(2001) nor Corbett et al. (2002) found any clear indications of an AGN (see sect. 4.5).
Risaliti et al. (2000) report on an X-ray nucleus obscured by a Compton thick column of gas ( ), based on the power law of the X-ray continuum. However, low signal to noise measurement of a power law continuum is difficult to interpret, and X-ray binaries have power law energy distributions that can mimic an AGN (e.g. Ebisawa et al., 2008). Wilson et al. (2008) have observed NGC 1614 with the submillimeter array (SMA) and suggests a nuclear non thermal component based on ratio of submillimeter fluxes. However, the non thermal component could be associated with either an AGN or with SNRs.
The central peak in our CO position-velocity diagram (Fig. 2, right panel) could be associated with a nuclear, Compton thick region, obscuring an AGN. We have calculated the largest possible radius of a Compton thick region ( ) with a spherical geometry. We assumed that at most 30% of the flux (corresponding to M⊙) in the position-velocity diagram (the central peak) could be associated with such a region. The largest possible radius, with would then be 140 pc (), and it would not be resolved in in our CO data. Higher angular resolution would be needed to resolve the Compton thick region. However, based on the lack of obvious signs of an AGN, we conclude that the LINER-like optical spectrum of NGC 1614 is probably related to nuclear starburst activity, and not to an AGN.
Alonso-Herrero et al. (2000) has described a scenario where a LINER-like optical spectrum would be the consequence of the shock-heating by supernovae of the surrounding gas after a burst of star formation. This would typically occur 10–15 Myr after the onset of the starburst. NGC 1614 is likely an example of this scenario, where the nuclear (45 pc) starburst has been reported to have an age 10 Myr (AH2001). The outflow, or super wind, described in Sect. 4.2 may also be related to the shock fronts giving rise to the LINER-like spectrum. A similar scenario was suggested to cause the LINER-like spectrum in the LINER galaxy NGC 5218 (Olsson et al., 2007).
4.7 Feeding of the central region
In the position velocity diagram of the CO-data (Fig. 2, right panel), three peaks are resolved. The southern and northern peaks (associated with the star forming ring) are stronger than the central peak. We estimate that 25% of the gas mass in the central beam (corresponding to M⊙) is associated with the central peak. This suggests that there has been a substantial inflow of gas to smaller radii than the star forming ring at in NGC 1614.
Based on the large scale optical and Hi morphology, with a tidal tail and plumes, we speculate that the tidal interaction has triggered the formation of a bar where the gas has been transported along the leading edge and piled up in the star forming ring. An inner bar has decoupled dynamically at this radius, and allowed the gas to flow toward the center. Star formation has occurred in this dynamically decoupled bar, and can be seen in the 1.4 GHz MERLIN map (Fig. 4). Inflow occuring before the formation of the ring, and the continued inflow along a decoupled bar after the ring formation, has triggered and maintained the nuclear activity of NGC 1614.
4.8 The nature of the crossing dust lane and the interaction
Prominent dust lanes in merging galaxies are not uncommon and have a variety of properties. One example is the dust lane of the NGC 4194 merger (e.g. Aalto and Hüttemeister 2000). Just like the NGC 1614 dust lane, it is a minor axis dust lane crossing the galaxy at an angle to the velocity field.
In the NGC 4194 merger it is speculated that the dust lane is feeding the central region with H2 for star formation from the outer regions of the merger. A similar scenario is possible for NGC 1614 and should be studied at higher resolution. It is interesting to speculate whether the minor axis dust lane is part of an inner polar ring structure.
In a numerical simulation study of minor- or intermediate mergers, Bournaud et al. (2005) found that the gas brought in by the disturbing companion galaxy is generally found at large radii in the merger remnant. The gas is returning to the system from tidal tails and often forms rings – polar, inclined or equatorial – that will appear as dust lanes when seen edge-on.
The CO emission we identify as associated with the fore-ground dust lane is blueshifted with respect to the expected rotational velocity at the same position in the plane of the galaxy. This is consistent with it not being in the same plane, but does not constitute evidence. Alternatively the dust lane acts as a gaseous bar, inclined to the K-band stellar bar, along which gas is being funneled to the center. This interpretation is not consistent with the CO velocity field however. Higher resolution molecular observations are necessary to distinguish between the polar ring/gas bar scenario and to investigate how the gas is flowing towards the nucleus.
Both a polar ring and a bar can be triggered by the interaction just like the tidal features of NGC 1614. Neff et al. (1990) suggest that an intruding companion is located 10′′ to the south-west of the center of NGC 1614. Peculiar H velocities and an alignment of the jet-like optical tail suggests this. An inspection of the HST WFPC2 F606W image does indeed reveal a drawn-out feature here pointing in the direction of the tail. We find no molecular counterpart to this object, but this is hardly surprising if it has already been stripped of its gas content and only has its nucleus left. The feature also appears in the K-band image. AH2001 suggest that there is evidence of the nucleus of a companion approximately 1′′ north-east of the nucleus in their B-band image. There is no hint of this companion in the K-band image - and no evidence of a particular disturbance in our CO or HI velocity field here, although the spatial resolution needs to be higher to be certain.
5 Conclusions
-
1.
We detect of molecular gas within a north to south slightly elongated bar like structure with a size of kpc.
-
2.
The north to south rotation of the central kpc molecular gas is consistent with an inclined disc / bar that follows the expected rotational direction based on the assumption of trailing spiral arms.
-
3.
There is a molecular extension to the northeast, associated with a crossing dust lane.
-
4.
The molecular gas in the central kpc is double peaked, with peaks at pc. There is a third, central peak at lower integrated intensities, probably associated with a nuclear starburst/AGN.
-
5.
We have detected a MERLIN and VLA 5 GHz radio continuum ring with a radius of 300 pc. This ring is coincident with previous radio continuum and Pa observations. We conclude that the radio continuum ring originates in recent star formation. The CO peak intensity is shifted 1′′ to the north-west of the center of the starburst ring.
-
6.
The MERLIN 1.4 GHz radio continuum is triple peaked, with a peak separation of (300 pc). The brightest peaks occur in the northern and southern part of the star forming ring with a radius of 300 pc. The other peak, which is almost as bright, occur inside the star forming ring, close to its center. The brightness temperature of maximum 53 000 K of the peaks are consistent with a cluster of supernova remnants, although an AGN can not be ruled out for the peak close to the center.
-
7.
The position velocity diagram of the Hi-absorption was used to calculate a dynamical mass of in the central (300 pc). An upper limit to the molecular gas mass in the same region is . This gives a gas mass fraction of or less in the central (300 pc).
-
8.
A solid body rotation curve was fitted to the Hi-absorption velocity field, out to a radius of (600 pc). The residuals are blueshifted over all of the fitted area. We interpret this as an outflow or a superwind, with a deprojected velocity of 160 .
-
9.
We suggest that gas may flow to the nucleus along a dynamically decoupled bar inside the star forming ring (or spiral), which we see tentative evidence for in the 1.4 GHz MERLIN map. The existence of such a bar should be investigated with CO observations and higher angular resolution.
-
10.
The LINER like spectrum is likely related to the shock fronts associated with either the large scale super wind, or with shock fronts on smaller scales related to supernova remnants from previous bursts of star formation. We conclude that the LINER activity observed in NGC 1614 is probably due to starburst activity, and not to AGN-activity.
Acknowledgements.
We gratefully acknowledge use of the NRAO Very Large Array (VLA), the Owens Valley Radio Observatory (OVRO), the Multi-Element Radio Linked Interferometer Network (MERLIN), their associated data archives and the Hubble Space telescope (HST) data archive. We thank Waykin Ariyasoonthorn for his help with the OVRO CO data reduction. We thank Rainer Beck and Alessandro Romeo for useful discussions regarding the interpretation of the radio continuum results. This research has made use of the NASA/IPAC Extragalactic Database (NED) which is operated by the Jet Propulsion Laboratory, California Institute of Technology, under contract with the National Aeronautics and Space Administration. Parts of this work was supported by the EU Marie Curie Training Site programme under contract no. HPMT-CT-2000-00069 (JTRA).References
- (1) Aalto and Hüttemeister, 2000, A&A, 362, 42
- (2) Alonso-Herrero, A., Rieke, M.J., Rieke, G.H., Shields, J. C., 2000, ApJ, 530, 688
- (3) Alonso-Herrero, A., Engelbracht, C. W., Rieke, M. J., Rieke, G. H., Quillen, A. C., 2001, ApJ, 546, 952 (AH2001)
- (4) Baars, J. W. M., Genzel, R., Pauliny-Toth, I. I. K., Witzel, A., 1977, A&A, 61, 99
- (5) Bournaud, F., Jog, C. J., Combes, F., 2005, A&A, 437, 69
- (6) Buta R., van Driel W., Braine J., Combes F., Wakamatsu K., Sofue Y.,Tomita A., 1995, ApJ, 450, 593
- (7) Calzetti, D., 1997, AJ, 113, 162
- (8) Chapelon, S., Contini, T., Davoust, E., 1999, A&A, 345, 81 (C99)
- (9) Combes, F., 1988a, in Galactic and Extragalactic Star Formation, eds. Pudritz, R. E., Fich, M., 475
- (10) Combes F., 1988b, in Molecular Clouds in the Milky Way and External Galaxies, eds, Dickman R. L., Snell R. L., Young J. S., Springer-Verlag, Berlin , p. 441
- (11) Corbett, E. A., Norris, R. P., Heisler, C. A., Dopita, M. A., Appleton, P., Struck, C., Murphy, T., Marston, A., Charmandaris, V., Kewley, L., Zezas, A. L., 2002, ApJ, 564, 650
- (12) Ho, L.C., 1999, Advances in Space Research, 23, 813
- (13) Ebisawa, K., Yamauchi, S., Tanaka, Y., Koyama, K., Ezoe, Y., Bamba, A., Kokubun, M., Hyodo, Y., Tsujimoto, M., Takahashi, H., 2008, PASJ, 60, 223
- (14) Hill, T. L., Heisler, C. A., Norris, R. P. Reynolds, J. E., Hunstead, R. W., 2001, ApJ, 121, 128
- (15) Hirashita, H., Hunt, L. K., 2006, A&A, 460, 67
- (16) Hummel, E., van der Hulst, J. M., Keel, W. C., Kennicutt, Jr., R. C., 1987, A&AS, 70, 517
- (17) Hunt, L. K., Combes, F., García-Burillo, S., Schinnerer, E., Krips, M., Baker, A. J., Boone, F., Eckart, A., Léon, S., Neri, R., Tacconi, L. J., 2008, A&A, 482, 133
- (18) Jogee, S., Shlosman, I., Laine, S., Englmaier, P., Knapen, J. H., Scoville, N., Wilson, C. D., 2002, ApJ, 575, 156
- (19) Kenney, J. D. P., Wilson, C. D., Scoville, N. Z., Devereux, N. A., Young, J. S., 1992, ApJ, 395, 79
- (20) Kennicut, Jr., R. C., 1998, ApJ, 498, 541
- (21) Keto, E. Ho, L. C., Lo, K. Y., 2005, ApJ, 635, 1062
- (22) Knapen J. H., Whyte L. F., de Blok W. J. G., van der Hulst J. M., 2004, A&A, 423, 481
- (23) Krips, M., et al., 2005, A&A, 442, 479
- (24) Lehnert, M. D., & Heckman, T. M., 1996, ApJ, 462, 651
- (25) Maloney, P.R., Hollenbach, D.J., & Thielens, A.G.G.M, 1996, ApJ, 466, 561M
- (26) Neff, S. G., Hutchings, J. B., Standord, S. A., Unger, S. W., 1990, ApJ, 99, 1088
- (27) Olsson, E., Aalto, S., Thomasson, M., Beswick, R., Hüttemeister, S., 2007, A&A, 473, 389
- (28) Planesas, P., Colina, L., P\a’erez-Olea, D., 1997, A&A, 325, 81
- (29) Risaliti, G., Gilli, R., Maiolino, R., Salvati, M., 2000, A&A, 357, 13
- (30) Rupke, D. S., Veilleux, S., Sanders, D. B., 2005, ApJ, 160, 115
- (31) Sarzi, M., Allard, E. L., Knapen, J. H., Mazzuca, L. M., 2007, MNRAS, 380, 949
- (32) Shlosman, I., 2003, in Active Galactic Nuclei: from Central Engine to Host Galaxy, ASP Conference Series, Vol. 290, eds. S. Collins, F. Combes, I. Shlosman, p. 427
- (33) Scoville, N. Z., Sanders, D. B., Sargent, A. I., Soifer, B. T., Tinney, C. G., 1989, ApJ, 345, 25
- (34) Scoville, N. Z., Soifer, B. T., Neugebauer, G., Matthews, K., Young, J. S., Yerka, J., 1895, ApJ, 289, 129
- (35) Seaquist, E. R., Lee, S. W., Moriarty-Schieven, G. H., 2006, ApJ, 638, 148
- (36) Shlosman, I., Frank, J., Begelman, M. C., 1989, Nature, 338, 45
- (37) Simkin, S. M., Su, H. J., Schwarz, M. P., 1980, ApJ, 237, 404
- (38) Terashima, Y,. Ho, L. C., Ptak, A. F., Mushotzky, R. F., Serlemitsos, P. J., Yaqoob, T., Kunieda, H., 2000, ApJ, 533, 729
- (39) Theureau, G., Bottinelli, L., Coudreau-Durand, N., Gouguenheim, L., Hallet, N., Loulergue, M., Paturel, G., Teerikorpi, P., 1998, A&AS, 130, 333
- (40) Walter, F., Weiss, A., Scoville, N., 2002, ApJ, 580, 21
- (41) Wilson, C. D., Petitpas, G. R., Iono, D., et al. 2008, ApJS, 178, 189
- (42) Young, J.S., Xie, S., Kenney, J.D.P., Rice, W.L., 1989, ApJS, 70,699