Oxygen isotopic ratios in cool R Coronae Borealis stars
Abstract
We investigate the relationship between R Coronae Borealis (RCB) stars and hydrogen-deficient carbon (HdC) stars by measuring precise 16O/18O ratios for five cool RCB stars. The 16O/18O ratios are derived by spectrum synthesis from high-resolution (R50,000) K-band spectra. Lower limits to the 16O/17O and 14N/15N ratios as well as Na and S abundances (when possible) are also given. RCB stars in our sample generally display less 18O than HdC stars - the derived 16O/18O ratios range from 3 to 20. The only exception is the RCB star WX CrA, which seems to be a HdC-like star with 16O/18O=0.3. Our result of a higher 16O/18O ratio for the RCB stars must be accounted for by a theory of the formation and evolution of HdC and RCB stars. We speculate that a late dredge-up of products of He-burning, principally 12C and 16O, may convert a 18O-rich HdC star into a 18O-poor RCB star as the H-deficient star begins its final evolution from a cool supergiant to the top of the white dwarf cooling track.
1 Introduction
The R Coronae Borealis (RCB) stars and their likely cousins the hydrogen-deficient carbon (HdC) stars and the extreme helium (EHe) stars have long posed a puzzle as to their origins in terms of stellar evolution. Two leading scenarios have survived decades of theoretical and observational scrutiny. In one, the H-deficient supergiant is formed from the merger of a He white dwarf (WD) with a C-O white dwarf (Webbink 1984; Iben & Tutukov 1984; Saio & Jeffery 2002). This path is widely referred to as the double-degenerate (DD) scenario. In the other, these H-deficient stars result from a final, post-AGB helium shell flash in the central star of a planetary nebula. The final flash may transform the star on the WD cooling track into a H-deficient supergiant; this the so-called “born-again” scenario is discussed by Herwig (2001) and Blöcker (2001) and often labeled the FF scenario. Open questions remaining include: Is the DD or the FF scenario the dominant mechanism? If both are operative, how does one distinguish a product of the DD from one of the FF scenario?
Elemental and isotopic abundances of C, N, and O are potentially powerful agents for testing the different evolutionary scenarios proposed. Previous studies of the CNO abundances support production of the RCBs and the EHes by the DD scenario (Pandey et al. 2006). A dramatic advance was made by Clayton et al.’s (2005, 2007) discovery from medium-resolution infrared spectra of the CO 2.3 m bands that 18O was very abundant for some cool RCBs and HdCs. Exploratory calculations led Clayton et al. (2007) to propose that 18O was synthesised from 14N during the merger in the DD scenario. Extraordinary conditions are required for the FF scenario to lead to abundant 18O.
More recently, we analyzed high-resolution (R=50,000) spectra of a few narrow windows in the K band of the five known HdC stars and a few RCB stars (García-Hernández et al. 2009). In these spectra, the CO spectrum is resolved and application of spectrum synthesis enables a more precise estimate of the 16O/18O ratio to be obtained. Our recent analysis generally confirmed reports by Clayton and colleagues from R=5,900 (or lower resolution) spectra. We confirm that the 16O/18O ratio is less than unity for those HdC stars (3 of the known 5) exhibiting CO lines in their spectra. However, 16O/18O=16 was obtained for the cool RCB star SAps; the other RCB stars in our sample were too warm to display CO molecular lines in their spectra. Our result 16O/18O=16 for S Aps contrasts with Clayton et al. ’s ratio of 4. Our spectra show the gain in information resulting from the ability at the higher resolution to distinguish clearly different CO isomers. High-resolution spectra are essential to derive reliable and precise oxygen isotopic ratios for these hydrogen-deficient stars.
With S Aps showing a nearly 50-fold difference in the 16O/18O ratio from the analysable HdC stars, the question arises - is a higher ratio characteristic of the RCBs? If so, this presumably provides a clue to understand the evolutionary relationship between HdC and RCB stars. Unfortunately, no new information may be drawn about the oxygen isotopic ratio in HdC stars until more HdC stars are discovered, but there are several RCBs with CO bands of a suitable strength not yet observed at high resolution. The example of S Aps shows that RCBs should be reobserved at higher resolution before drawing conclusions about the HdC-RCB connection. Therefore, we have extended high-resolution K-band observations to another five cool RCB stars in order to establish the range of the 16O/18O ratio among RCBs (Clayton et al.’s range from the 6 RCBs was 1 to 12). Section 2 describes the high-resolution infrared spectroscopic observations and gives an overview of the observed spectra. Our abundance analysis and the results obtained are presented in Section 3 and 4, respectively. The derived oxygen isotopic ratios are discussed in the context of the HdC-RCB connection in Section 5. Final conclusions are presented in Section 6.
2 Observations and K-band spectra
Our new sample contains six cool (Teff6250 K) RCB stars plus one HdC star. Five of these stars are observed for the first time at high resolution. The RCB star S Aps and the HdC star HD 173409 were observed in spectral regions not previously covered by us (García-Hernández et al. 2009). High-resolution (R50,000) spectroscopic observations were obtained in the period FebruaryMay 2008 with the PHOENIX spectrograph at Gemini South (Hinkle et al. 2003). We used the 0.34 arcsec slit at grating tilts centered at 2.251, 2.333, 2.349 and 2.365 m. Each one of these wavelength settings provides a spectral coverage of 0.01 m (or 19.5 cm-1). Exposure times ranging from 30 seconds (K=5.4) to 10 minutes (K=8.3) per wavelength band were needed in order to reach a high S/N (100 at the continuum). The spectral regions covered for each star in our sample are listed in Table 1. The observed spectra were reduced to one dimension by using standard tasks in IRAF111The Image Reduction and Analysis Facility software package (IRAF) is distributed by the National Optical Astronomy Observatories, which is operated by the Association of Universities for Research in Astronomy, Inc., under cooperative agreement with the National Science Foundation. and the telluric features were removed with the help of a spectrum of a hot star observed the same night. Standard air wavelengths are given hereafter.
Before attributing an observed spectrum to the stellar photosphere, we determine first if a star displays a significant infrared excess at 2.3 m. For this purpose, we constructed spectral energy distributions (SEDs) of the stars in our sample by using the BVRIJHKL photometry available in the literature and the IRAS flux density at 12 m. In the K band, the flux from RCB stars SV Sge, S Aps222According to ASAS All Star Catalogue (ASAS-3) observations, S Aps was recovering from a weak minimum during our observations., WX CrA and U Aqr is predominantly from the photosphere; an infrared excess from circumstellar dust does not significantly contaminate our infrared spectra. The photospheric spectrum is also dominant for the HdC star HD 173409 with an effective temperature of K. Spectra of V CrA and ES Aql are contaminated by infrared emission from dust.
Inspection of the light curve provided by the American Association of Variable Star Observers (AAVSO)333see http://www.aavso.org/ and the ASAS All Star Catalogue (ASAS-3)444see http://www.astrouw.edu.pl/asas/?page=aasc, shows that V CrA experienced a decline of at least six magnitudes beginning last March 2007. AAVSO measurements are not reported for the period of our observations but the ASAS-3 measurements confirm that V CrA was at minimum during our observations. Certainly, our infrared spectra are featureless. CO and CN lines are expected to be quite strong in V CrA’s photospheric spectrum ( K, Asplund et al. 2000) and, therefore, the observed featureless spectrum is most likely from the circumstellar dust.
ES Aql experienced a strong decline in brightness beginning in November 2007. Fortunately, ES Aql was recovering from minimum light when observed by us; it was about one magnitude below maximum light according to AAVSO and ASAS-3 observations. Although ES Aql’s photospheric spectrum may be partially diluted by emission from circumstellar dust, CO and CN lines are clearly detected in this star with K.
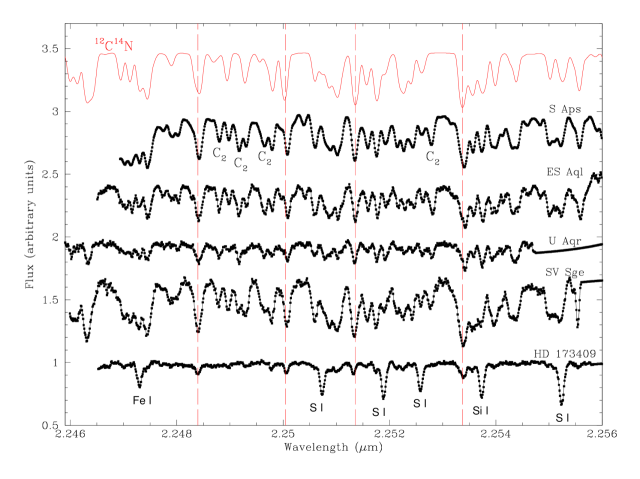
The observed spectral regions were chosen primarily to catch a mix of 12C16O, 12C18O as well as 12C14N lines. The region centered at 2.251 m was selected in order to be able to estimate the N abundance from CN lines. The CN molecule (Red System) contributes in all observed regions but this region is free from contributions from the first-overtone CO bands. In addition, a few lines of the C2 Phillips bands 0-2 and 1-3 together with some S i lines cross this interval. Figure 1 shows the observed spectra around 2.251 m for the stars in our sample.
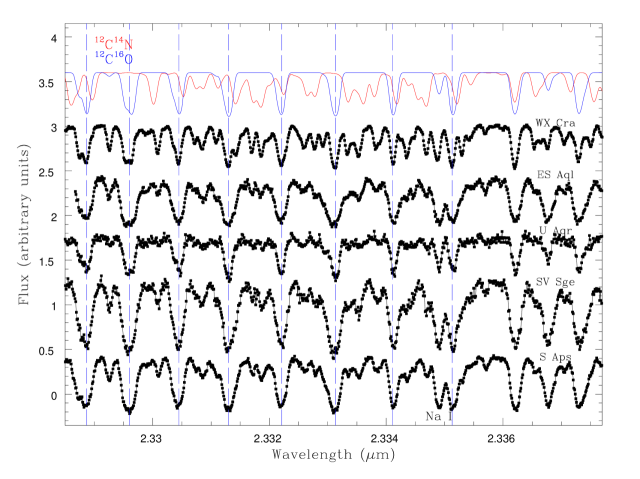
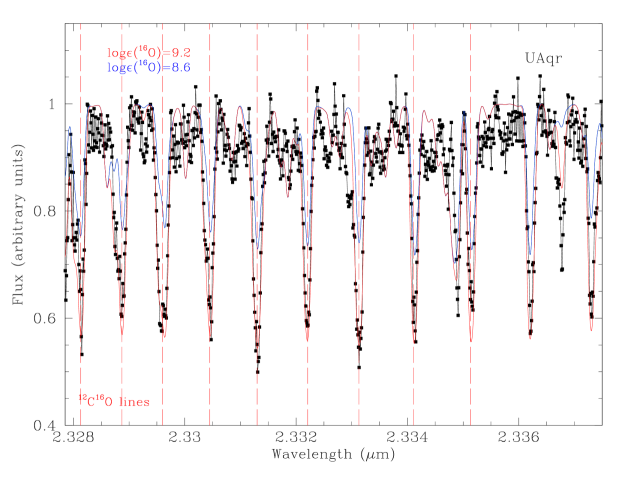
The region centered at 2.333 m provides a selection of P and R lines from the 12C16O 2-0 and 3-1 bands as well as a few weak 12C14N lines and the Na i line at 2.3348 m. The isomer 12C18O is not a contributor to this region. The observed spectra in the latter region are shown in Figure 2.
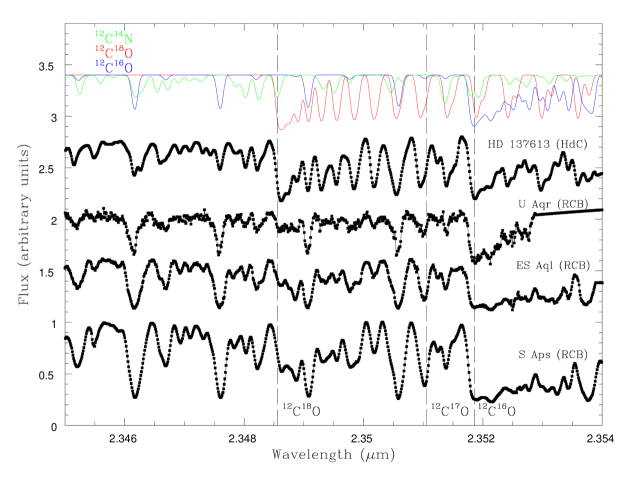
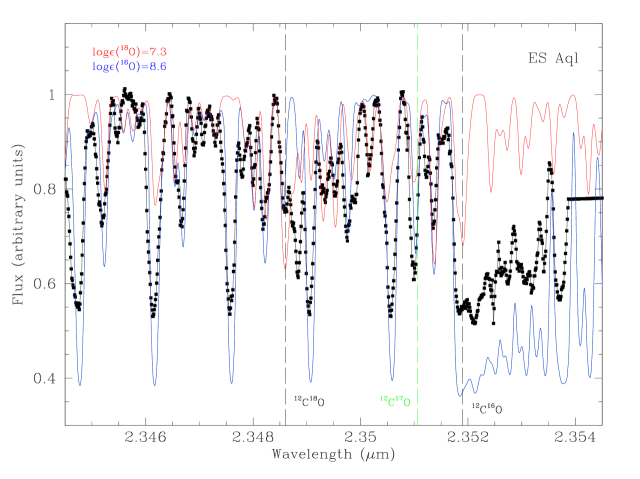
Three stars were also observed in the interval around 2.349 m. This region includes the 2-0 12C18O bandhead and also the 3-1 12C17O and 4-2 12C16O bandheads at 2.351 and 2.352 m, respectively. Figure 3 shows the 2.349 m 12C18O 2-0 band of three cool RCB stars in our sample in comparison with the 18O-rich HdC star HD 137613 (García-Hernández et al. 2009). Note that strong 12C18O lines are seen in the spectrum of the HdC star HD 137613, while these lines are weaker in the cool RCB stars U Aqr, ES Aql and S Aps. Yet, the 4-2 12C16O bandhead (and other 12C16O lines) are stronger in the RCB spectra than in the spectrum of HD 137613.
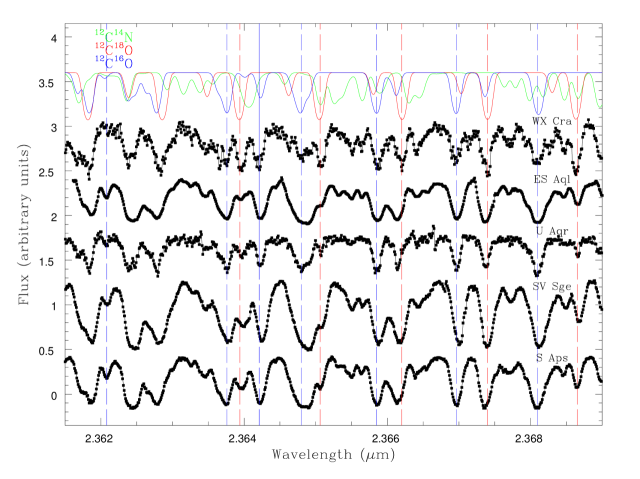
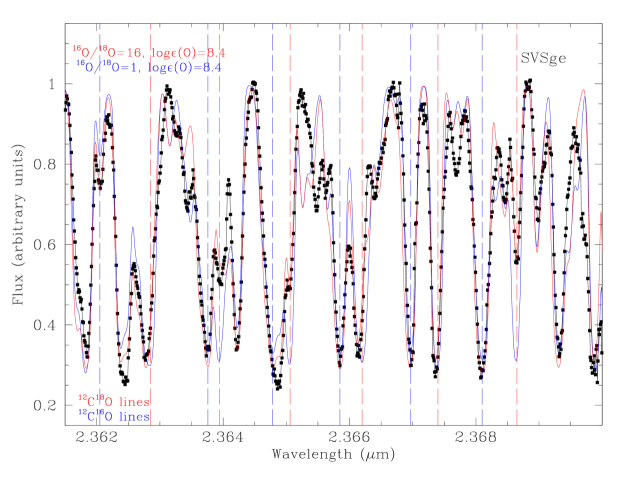
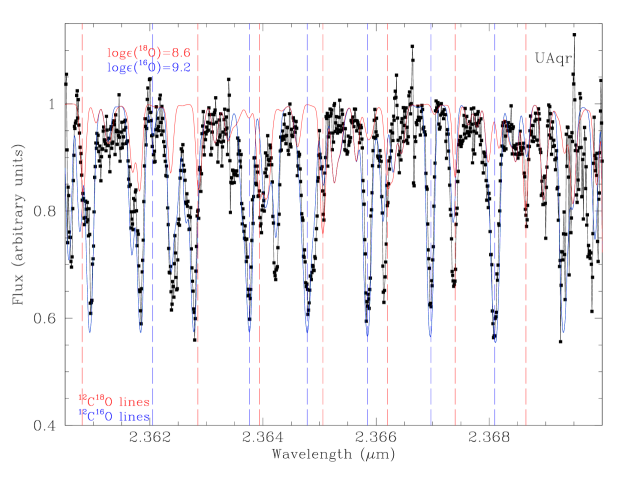
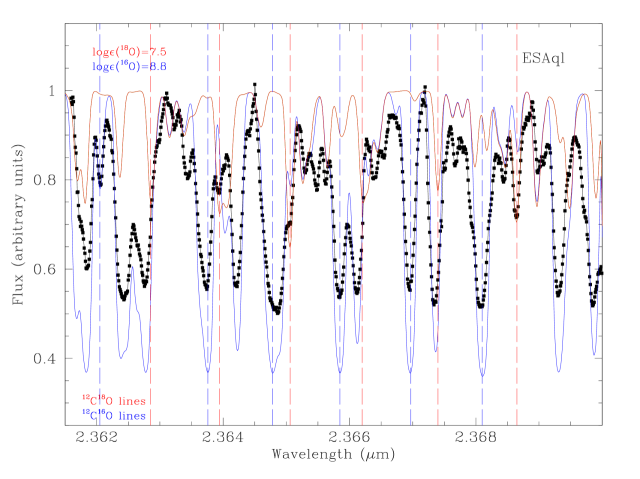
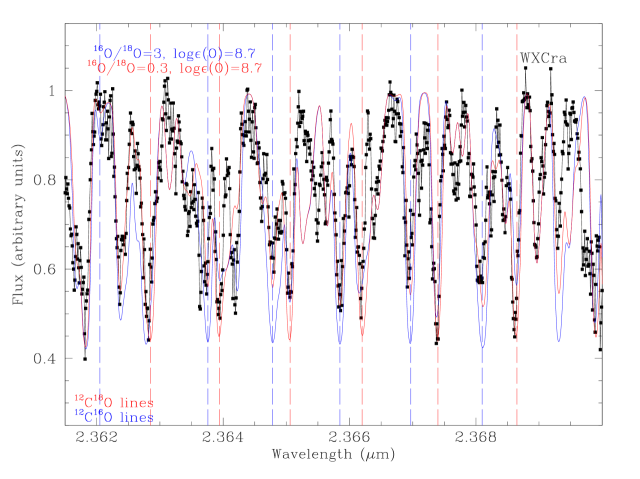
Finally, all stars were observed in the region centered at 2.365 m. This region is well suited to providing an estimate of the 16O/18O ratio because it is longward of the 2-0 12C18O R-branch head at 2.349 m and includes weak and strong 12C16O and 12C18O lines that are cleanly separated at R. There are also 12C14N lines in this region. Figure 4 shows the observed spectra around 2.365 m for the cool RCB stars in our sample. It is clear that the RCB star WX CrA is strongly enriched in 18O because lines of 12C16O and 12C18O are similar in strength, as anticipated from medium-resolution spectra (Clayton et al. 2007). In contrast, the 12C18O lines - especially the cleanest 12C18O line at 2.3686 m is much weaker in the other four RCB stars, suggesting that 18O is less abundant in these stars.
3 Abundance analysis
We derive oxygen isotopic abundances by using spectral synthesis techniques. A detailed description of the adopted abundance analysis procedure as well as the input physics and atomic and molecular linelists has been presented by us (García-Hernández et al. 2009) and will not be repeated here. In short, we have constructed H-deficient spherically symmetric MARCS model atmospheres for the stars in our sample and we considered up-to-date lists of atomic and molecular lines. The most important contributor of lines in our spectral regions are the CO and CN molecules. We consider linelists for all the CO and CN isomers (i.e., 12C16O, 12C17O, 12C18O, 12C14N, 12C15N, etc.).
The MARCS models follow the prescription discussed by Asplund et al. (1997) where the input chemical composition is that of the RCB stars (i.e., log(H)=7.5 and a C/He ratio of 1% by number density555The abundances are normalized to log =12.15 where is the mean atomic weight of element , i.e., log(He)=11.52 and log(C)=9.52, see Asplund et al. (1997).; Rao & Lambert 1994). The only exception with respect to initial composition was U Aqr (see below) for which we have also used a metal-poor model with [Fe/H]=1.0 dex. The TURBOSPECTRUM package (Alvarez & Plez 1998), which is compatible with MARCS, is used to generate the corresponding synthetic spectra.
Apart from the adopted input composition, a microturbulent velocity, surface gravity and effective temperature must be chosen. The warm RCB stars display an average microturbulent velocity of 6.6 km s-1 with no apparent trend with effective temperature (Asplund et al. 2000). Thus, we assumed a microturbulence of 7 km s-1 for all RCB stars. This value provides a fair fit to both the weaker and strong lines of a given species, a necessary condition according to the definition of microturbulence. When a synthetic spectrum computed for a microturbulence of 7 km s-1 is convolved with a Gaussian profile with a width of 6 km s-1 in order to take into account the instrumental profile at R50,000, a good fit is obtained to the line profiles. This suggests that the macroturbulence is small. In addition, a surface gravity of g was assumed in the construction of the model atmospheres for all RCB stars. This is consistent with the gravities found by Asplund et al. (2000) in their optical spectroscopic analysis of the cooler ( 6500 K) RCB stars. Finally, for each star in our sample we chose the effective temperatures listed by Clayton et al. (2007) for their analysis of medium resolution near-infrared spectra (see their Table 2). The adopted are listed in Table 2. It is to be noted that we do not precisely know the effective temperatures of our sample stars and they cannot be derived from our high-resolution spectra. Note also that by selecting the Clayton et al’s temperatures we can compare our derived oxygen isotopic ratios with those obtained from medium-resolution spectra. In any case, our main goal is to determine the 16O/18O oxygen isotopic ratios, and their determination is almost independent of the adopted model parameters, as shown in our previous paper and in Table 2 for SV Sge and U Aqr for which two different models are used for each star. According to our near-infrared and our previous optical spectra SV Sge looks hotter than the 4000 K adopted by Clayton et al. U Aqr according to Bond et al. (1979) from their analysis of a few strong optical lines has a calcium abundance similar to that of HD 182040, i.e., the metallicity is approximately solar. (U Aqr is noted for its remarkably high abundances of light -process abundances - Sr and Zr.) Clayton et al. (2007) adopted K from Asplund et al. (1997). Cottrell & Lawson (1998) suggest U Aqr belongs to the Galactic halo. Then, it might be metal-poor. There is spectroscopic evidence for this and for a lower effective temperature (Rao 2008). Thus, for U Aqr we consider a model with K and a metal-poor ([Fe/H] = -1) model with K.
The corresponding synthetic spectra were compared to the observed ones in order to determine the isotopic ratios for O and N - see García-Hernández et al. (2009) for a detailed description of the procedure employed in the derivation of isotopic abundances in hydrogen-deficient stars. We also list the derived O and N elemental abundances for the assumed input composition (i.e., log(H)=7.5, log(He)=11.52 and log(C)=9.52) together with, when possible, the abundances of the heavier elements Na and S from the Na i line at 2.3348 m666Note that the 2.3348 m Na i line is strongly blended with molecular features, preventing us of measuring a reliable Na abundance in most of the sample stars. and the few S i lines around 2.251 m. It should be noted here that the listed O, N, Na, and S elemental abundances must be considered with caution because they are strongly dependent of the atmospheric parameters (Table 2). The formal error in the total N and O abundances taking into account variations of the atmospheric parameters used in the modeling of hydrogen-deficient stars are estimated to be of the order of 0.30.4 dex (García-Hernández et al. 2009). In addition, the C2 Phillips system lines 0-2 Q(34), 1-3 Q(8) and 1-3 Q(10) (see Fig.1) observed in HdC and cool RCB stars exhibit a ‘carbon problem’, which complicates their use for carbon abundance determinations (García-Hernández et al. 2009 and references therein). Thus, we have to assume the input C abundance (log(C)=9.52) in our abundance analysis, which affects the derived N and O elemental abundances. The uncertainties for the derived Na and S abundances are even higher than those estimated for N and O with a typical value of 0.60.7 dex - especially in these cool RCB stars where the atomic lines are usually blended with the strong CN and CO molecular features across the spectra.
4 Oxygen isotopic ratios
For the RCB stars WX CrA, ES Aql, U Aqr, and SV Sge we are able for the first time to get reliable estimates of the 16O/18O isotopic ratio. The 16O/18O ratio of 16 obtained for the RCB star S Aps was previously known from spectrum synthesis at 2.349 m (García-Hernández et al. 2009). For the RCB star V CrA, the K-band spectra are featureless because they are dominated by emission from circumstellar dust (see Sect. 2) precluding a measurement of the 16O/18O ratio. For the five RCB stars, lower limits to the 16O/17O and 14N/15N ratios from the absence of detectable 12C17O and 12C15N lines are also determined. Unfortunately, we can not give estimates of the 12C/13C ratios because our observations did not cover the 2-0 13C16O bandhead at 2.344 m. Individual 13C16O features are not detectable but this is not surprising given that previous albeit scanty evidence for RCBs is that they have a high 12C/13C ratio. Note that we observed the HdC star HD 173409 around 2.251 m and a lower limit to the 14N/15N ratio as well as the S elemental abundance from the S i lines are also given. Table 2 summarises the derived abundances.
By inspection of Table 2, the 16O/18O ratios (with the sole exception of WX CrA) of these RCB stars differ from those reported by Clayton et al. (2007) from medium-resolution spectra. Clayton et al. (2007) underestimated the 16O/18O ratios for the RCB stars ES Aql, S Aps and SV Sge. This may be because most of the 12C16O lines in these three stars are saturated, not being useful for abundance analysis - we derive the isotopic 16O and 18O abundances from the weaker and cleanest lines in the observed spectra around 2.333 and 2.365 m. This is illustrated in Figure 5 for the RCB star SV Sge. The 16O/18O ratio of 16 is obtained in this star for which Clayton et al. obtained a value of 4. For those stars (e.g., ES Aql, U Aqr and S Aps) with available spectra in the 2.349 and 2.365 m regions, the derived 16O/18O ratios from both regions are in excellent agreement. For the RCB star U Aqr, our 16O/18O estimate of 4 contrasts with the lower limit of 12 estimated by Clayton et al. Synthetic spectra for U Aqr around 2.333 and 2.365 m are shown in Figures 6 and 7, respectively. The 16O/18O ratio of 20 displayed by ES Aql contrasts with Clayton et al.’s estimate of 6 for this star. Figures 8 and 9 show synthetic spectra for this star around the 2-0 12C18O bandhead at 2.349 m and around 2.365 m, respectively. It is to be noted that the 12C16O lines are saturated for this star with 5000 K. In addition, the K-band spectra for ES Aql are partially diluted by circumstellar dust with dilution decreasing between 2008 March and May. This is deduced from the fact that synthetic spectra predict stronger 12C16O lines than observed and the CO lines are stronger in the 2008 May spectrum than in 2008 April. ASAS-3 visual observations show that the star have brightened by about one magnitude between March and May when it was about 0.5 magnitude below maximum light. Although the derived 16O and 18O isotopic abundances differ by about 0.2 dex from analyses of the 2008 March 21 and April 8 spectra, the 16O/18O ratio of 20 remains unchanged (Figures 8 and 9). Finally, the RCB star WX CrA seems to be a HdC-like (18O-rich) star with 16O/18O=0.3 where a value of 1 was provided by Clayton and colleagues. Synthetic and observed spectra around 2.365 m for WX CrA are shown in Figure 10.
The 16O/18O ratios derived from high-resolution spectra are in fair agreement with those derived from medium-resolution spectra when the molecular lines of the different CO isomers are not strongly saturated. This is the case for the 18O-rich HdC stars (García-Hernández et al. 2009) and the RCB star WX CrA. In short, high-resolution spectra are needed in order to derive reliable oxygen isotopic ratios in cool RCB stars with strong CO molecular lines.
In summary, there is a clear difference between the 16O/18O ratios of the HdC and RCBs for those stars for which a measurement is possible. This difference suggested by interpretation of medium-resolution spectra is confirmed and extended by our high-resolution spectra. All (three!) HdCs with CO lines show 18O more abundant than 16O. All but one of the investigated RCBs shows 16O at least ten times more abundant than 18O.777The cool RCB Z UMi has 16O/18O according to Clayton et al. (2007).
5 The HdC-RCB connection
Given the extreme rarity of HdC and RCB stars, it seems reasonable to suppose that they are closely related. Here, we adopt the view that both are products of the DD scenario in which a He white dwarf merges with a C-O white dwarf. The merger inflates the resultant atmosphere around the C-O white dwarf to supergiant dimensions. A hot H-deficient supergiant is created that is expected to evolve rapidly to lower temperatures at approximately constant luminosity. The star is a cool supergiant for about 105 – 106 years before the onset of rapid evolution back to high temperatures and a final descent of the white dwarf cooling track. HdCs and RCBs are to be identified with the cool supergiant phase.
The precise form of the evolutionary track in the H-R diagram may depend on multiple aspects of the merger, e.g., the masses and compositions of the white dwarfs, the rate of mass transfer from the He white dwarf to the C-O white dwarf, and the gravitational and nuclear energy release at the C-O white dwarf. Yet, it is very likely that a supergiant product of a merger spends most of its time as a cool star. If a HdC results, the evolutionary sequence will be HdC RCB EHe. Perhaps, some mergers do not populate the coolest parts of the supergiant track, then the sequence will be RCB EHe. In other words, all HdC may evolve to RCB and EHe stars, but, perhaps, not all RCB and EHe stars were HdC stars. Here, we examine the abundances in light of the assumption that HdC RCB EHe is the common sequence.
It is assumed for the purposes of this discussion that the remarkable high concentration of 18O is created during or shortly after the merger. Although it is plausible that the 18O is synthesized from 14N (Warner 1967), no explanation has yet been provided as to why the 16O/18O ratio takes the low values seen in the HdCs and why surviving 14N seems so slightly depleted. These questions were explored by Clayton et al. (2007) and García-Hernández et al. (2009). Here, we set such matters aside and discuss how the difference in 16O/18O ratios between HdC and RCB stars might be explained.
Abundances derived from the infrared spectra for the HdC and cool RCBs betray some intriguing differences between the two groups of H-deficient stars. Table 3 gives the N, O and 16O and 18O, Na, and S abundances for stars from this and our previous paper. The C abundance is assumed to be the same for all stars (see Table 2). These differences are unlikely to be attributable to systematic differences in atmospheric parameters between the HdC and RCB stars; the differences on average are slight except, perhaps, for the C/He ratio which is an assumed not a derived parameter (see below for our conjecture about this ratio).
The most striking difference between HdC and RCB stars is seen among the estimates of the 16O/18O ratios. The three HdCs for which the ratio is measureable have an isotopic ratio near 0.5. Three of the four RCBs with a measured isotopic ratio have a ratio at least one order of magnitude higher than that seen in the HdCs. The exception is the RCB WX CrA which has an HdC-like ratio. It bears repeating (see Table 2) that the measured 16O/18O ratio is insensitive to the adopted model atmosphere over quite wide variations of the model atmosphere parameters. Furthermore, this HdC-RCB difference is evident from inspection of the spectra.
In order to interpret this clear difference in the 16O/18O ratio between HdC and RCB stars it is helpful to know the contributions from an increase in the 16O and a decrease in the 18O abundance between the two groups of stars. The 16O and 18O abundances are given in Table 3 and shown in Figure 11. One interpretation of the abundances is that the difference in 16O/18O ratios may be partially attributable to decrease in 18O abundances between the 18O-rich HdC stars (and WX CrA) but primarily arises from an increase in the 16O abundance between HdC and RCB stars. (The lower than average 16O and 18O abundances for ES Aql among the RCBs may possibly be due to the uncertain and varying dilution of the spectrum by dust emission.)
Here, we do not attempt to explain the origin of the 18O that is such a remarkable characteristic of the HdC - see Clayton et al. (2007) and our 2009 paper for speculations. In this section, we directly speculate to how the differences in composition between HdC and RCB stars may be related to the dredge-up of nuclear-processed material by the supergiant as it evolves from a HdC to a RCB star. Published calculations bounding the possibilities have yet to be reported. Our speculations draw on the few models presented by Saio & Jeffery (2002) for mergers in which mass transfer is a slow process continuing well into the supergiant phase. In these models, the convective envelope just prior to the rapid evolution back to high temperatures makes a close approach to the He-burning shell. (This close approach may not occur in the case of a merger which results in traces of hydrogen in the accreted material and then the maintenance of a H-burning shell in the supergiant.)
With a close approach to the He-burning shell, the 16O in the envelope may increase. Such an increase is more certain to occur, if after the cessation of He-burning, the convective envelope is able to penetrate to the He-shell/CO-core boundary. Also, the 18O abundance is likely to decrease because it may have been destroyed in the deepest layers; 18O is more prone to destruction than 16O by several orders of magnitude. A few per cent addition of mass from the He-exhausted layers should suffice to increase the 16O abundance by an order of magnitude.
In this scenario, the 12C abundance of the envelope and atmosphere increases too between HdC and RCB stars because the ratio of 12C/16O in the He-exhausted layers is most likely to be greater than one. The He abundance should not be significantly changed by the extension of the deep convective envelope across the He-shell/C-O-core boundary. Thus, the RCBs may have a higher C/He ratio than the HdCs. This may account also for an intriguing difference in Na and S abundances between HdC and RCB stars in Table 3. Both S and Na are about 0.6 dex higher in HdCs than in the RCBs.
Derived abundances are dependent on the assumed C/He ratio. In the infrared He- free-free opacity is the leading contributor of continuous opacity with C as an important electron donor. In our previous paper, we reported that a change in the C/He ratio from 1% to 10% lead to an increase of Na and S abundances by about 0.6 dex. This suggests that decreasing the C/He ratio to about 0.1% will reduce the Na and S abundances to about their levels seen in the RCB stars. Derived abundances for N and O change little with a change in C/He ratio. The C/He ratio of 1% for the HdCs and RCBs is an assumed value. A change of the C/He ratio from 0.1% to 1% to reconcile Na and S abundances in HdC with values for RCBs is possibly consistent with the C/O ratio of material dredged-up from the He-exhausted layers.
Although this scenario offers a scheme for accounting for the lowering of the 16O/18O ratio between HdC and RCB stars and also for the difference in their abundances of Na and S, it augments the challenge in accounting for the compositions of the warm RCBs (and EHes) for which detailed results are available (Asplund et al. 2000; Pandey et al. 2006). If the RCBs are affected by a late dredge-up, one would suppose that the final C/He must vary from star to star on account of the different amounts of mass dredged up and the different C/O ratios. Such a variation would be reflected in star-to-star variations in abundances when all stars are analysed assuming the same C/He ratio. Yet, the abundances of elements heavier than O are quite similar star-to-star across the sample of majority RCBs. The dispersion including the measurement uncertainties is only about 0.2 dex for well observed elements over the sample of 14 warm RCBs.
The challenge in accounting for the uniform compositions was not created by incorporating a late dredge-up into the evolution of these H-deficient supergiants. Its origin surely lies in the DD scenario itself. Mergers of He white dwarfs with C-O white dwarfs spanning a range in masses and previous histories of the white dwarfs might be expected to result in H-deficient stars with quite different C/He ratios and metallicities.
One looks forward to detailed modelling of H-deficient supergiants that will test our conjecture about a late dredge-up of material from He-exhausted layers.
6 Concluding Remarks
Challenges are not a new phenomenon to students of the R Coronae Borealis stars. High-resolution infared spectroscopy promises to provide responses to some of the key challenges regarding the RCBs and their putative relatives the HdC and EHe stars. Here, we suggested an evolutionary link between the HdCs and the RCBs involving the dredge-up of material to the surface. Further exploration of the link is possible. Unfortunately, the list of known HdCs has been exhausted. A few cool RCBs remain to be observed in the K band at high resolution. Of these, the most critical is V CrA. Unfortunately, our observations were obtained when the star was at minimum and infrared emission came from the dust shell and not the stellar photosphere. V CrA is special target because it is one of four known minority RCB stars (Rao & Lambert 1994) and the only one likely to show CO lines. Minority RCBs are distinguished by their high S/Fe and Si/Fe ratios (among other abundance anomalies): V CrA has [Si/Fe] [S/Fe] 2 (Asplund et al. 2000; Rao & Lambert 2008). Additionally, V CrA is rich in 13C with 12C/13C (Rao & Lambert 2008). Among those HdC and RCBs for which the carbon isotopic ratio may be estimated, V CrA is the only known example with a high 13C abundance. What does the combination of anomalous abundance ratios and high 13C abundance imply about the origin of V CrA and minority RCBs? Is their origin a variant of the DD scenario or must another (i.e., the FF) scenario be invoked? Measurement of the oxygen isotopic ratios is potentially a valuable clue to the answers to these questions.
Infrared spectroscopy offers the possibility of probing the carbon problems posed by the RCBs and HdCs - see Asplund et al. (2000) and García-Hernández et al. (2009) - in the failure to account for the strengths of the atomic and molecular carbon lines. From the optical to the infrared, the leading contributor to the continuous opacity depending on the star’s effective temperature may change from the photoionization of neutral carbon to free-free absorption from neutral helium. Full spectral coverage at high spectral resolution from the optical through at least the K band offers a novel opportunity to probe and hopefully to resolve the carbon problems. With their resolution, the chemical compositions of these fascinating H-deficient stars should be on a firmer footing and insights gained into their origins.
References
- (1) Alvarez, R., & Plez, B. 1998, A&A, 330, 1109
- (2) Asplund, M., Gustafsson, B., Kiselman, D. & Eriksson, K. 1997, A&A, 318, 251
- (3) Asplund, M., Gustafsson, B., Rao, N. K., & Lambert, D. L. 1998, A&A, 332, 651
- (4) Asplund, M., Gustafsson, B., Lambert, D. L., & Rao, N. K. 2000, A&A, 353, 287
- Blocker (2001) Blöcker, T. 2001, Ap&SS, 275, 1
- Bond et al. (1979) Bond, H. E., Luck, R. E., & Newman, M. J. 1979, ApJ, 233, 205
- Clayton et al. (2005) Clayton, G. C., Herwig, F., Geballe, T. R., Asplund, M., Tenenbaum, E. D., Engelbracht, C. W., & Gordon, K. D. 2005, ApJ, 623, L141
- Clayton et al. (2007) Clayton, G. C., Geballe, T. R., Herwig, F., Fryer, C., & Asplund, M. 2007, ApJ, 662, 1220
- Cottrell & Lawson (1998) Cottrell, P. L., & Lawson, W. A. 1998, PASA, 15, p.179
- García-Hernández et al. (2009) García-Hernández, D. A., Hinkle, K. H., Lambert, D. L., & Eriksson, K. 2009, ApJ, 696, 1733
- Herwig (2001) Herwig, F. 2001, Ap&SS, 275, 15
- (12) Hinkle, K. H., et al. 2003, Proc. SPIE, 4834, 353
- (13) Iben, I. J., & Tutukov, A. V. 1984, ApJS, 54, 335
- (14) Lawson, W. A., Cottrell, P. L., Kilmartin, P. M., & Gilmore, A. C. 1990, MNRAS, 247, 91
- Pandey et al. (2006) Pandey, G., Lambert, D. L., Jeffery, C. S., & Rao, N. K. 2006, ApJ, 638, 454
- Rao & Lambert (1994) Rao, N. K., & Lambert, D.L. 1994, JApA, 15, 47
- Rao & Lambert (2008) Rao, N. K., & Lambert, D. L. 2008, MNRAS, 384, 477
- Rao (2008) Rao, N. K. 2008, in ASP Conf. Ser. 391, Hydrogen Deficient Stars, ed. K. Werner & T.Rauch (San Francisco: ASP), 25
- Saio & Jeffery (2002) Saio, H., & Jeffery, C. S. 2002, MNRAS, 333, 121
- (20) Warner, B. 1967, MNRAS, 137, 119
- (21) Webbink, R. F. 1984, ApJ, 277, 355
| Star | Spectral ranges observed | Date |
|---|---|---|
| m | ||
| ES Aql | 2.251, 2.332, 2.349, 2.366 | 2008 Apr 8, 2008 Mar 21, 2008 May 13 |
| SV Sge | 2.251, 2.332, 2.366 | 2008 May 13 |
| S Aps | 2.332, 2.366 | 2008 Feb 10 |
| WX CrA | 2.332, 2.366 | 2008 Apr 10, 2008 Mar 20 |
| U Aqr | 2.251, 2.332, 2.349, 2.366 | 2008 May 13 |
| V CrA | 2.251, 2.332, 2.349, 2.366 | 2008 Feb 29, 2008 Mar 20, 2008 Apr 710 |
| HD 173409 | 2.251 | 2008 Mar 21 |
| Star | Teff (K)b | 16O/18Oc | 16O/18O | 16O/17O | 14N/15N | C/N/Od | Na | S |
|---|---|---|---|---|---|---|---|---|
| ES Aqle | 5000 | 6 | 205 | 50 | 10 | 9.5/8.6/8.6 | 6.8 | |
| SV Sge | 4000 | 4 | 164 | 20 | 10 | 9.5/7.7/8.4 | 7.6 | |
| 5000 | 134 | 50 | 10 | 9.5/9.2/9.0 | 7.4 | |||
| S Aps | 5400 | 4 | 164 | 80 | 10 | 9.5/9.2/9.2 | 6.8 | |
| WX CrA | 5300 | 1 | 0.30.1 | 6 | 9.5/9.3/8.7 | 7.3 | ||
| U Aqr | 6000 | 12 | 41 | 50 | 10 | 9.5/9.4/9.3 | 5.4 | 6.5 |
| z=1.0 | 5400 | 31 | 20 | 8 | 9.5/6.8/6.5 | 5.2 | 6.3 | |
| V CrAf | 6250 | |||||||
| HD 173409 | 6100 | 4 | 9.5/9.2/8.7 | 7.0 | 7.6 |
| Star | log(N) | log(O) | log(16O) | log(18O) | log(Na) | log(S) |
|---|---|---|---|---|---|---|
| ES Aql | 8.6 | 8.6 | 8.6 | 7.3 | 6.8 | |
| SV Sge | 7.7 | 8.4 | 8.4 | 7.2 | 7.6 | |
| S Aps | 9.2 | 9.2 | 9.2 | 8.0 | 6.8 | |
| WX CrA | 9.3 | 8.7 | 8.1 | 8.6 | 7.3 | |
| U Aqr | 9.4 | 9.3 | 9.2 | 8.6 | 5.4 | 6.5 |
| HD 137613 | 9.4 | 8.7 | 8.3 | 8.6 | 6.9 | 7.6 |
| HD 175893 | 9.2 | 8.7 | 8.1 | 8.6 | 6.5 | 7.6 |
| HD 182020 | 9.2 | 8.0 | 7.6 | 7.9 | 6.8 | 7.4 |