11email: emmanuel.lellouch@obspm.fr 22institutetext: Université Pierre et Marie Curie, 4 place Jussieu, F-75005 Paris, France; senior member of the Institut Universitaire de France 33institutetext: ACRI-ST, 260, Route du Pin Montard, BP 234, 06904 Sophia-Antipolis Cedex, France 44institutetext: European Space Observatory, Karl-Schwarzschild-Strasse 2, D-85748 Garching bei München, Germany
Detection of CO in Triton’s atmosphere and the nature of surface-atmosphere interactions
Abstract
Aims. Triton possesses a thin atmosphere, primarily composed of nitrogen, sustained by the sublimation of surface ices
Methods. The goal is to determine the composition of Triton’s atmosphere and to constrain the nature of surface-atmosphere interactions.
Results. We perform high-resolution spectroscopic observations in the 2.32-2.37 m range, using CRIRES at the VLT.
Conclusions. From this first spectroscopic detection of Triton’s atmosphere in the infrared, we report (i) the first observation of gaseous methane since its discovery in the ultraviolet by Voyager in 1989 and (ii) the first ever detection of gaseous CO in the satellite. The CO atmospheric abundance is remarkably similar to its surface abundance, and appears to be controlled by a thin, CO-enriched, surface veneer resulting from seasonal transport and/or atmospheric escape. The CH4 partial pressure is several times larger than inferred from Voyager. This confirms that Triton’s atmosphere is seasonally variable and is best interpreted by the warming of CH4-rich icy grains as Triton passed southern summer solstice in 2000. The presence of CO in Triton’s atmosphere also affects its temperature, photochemistry and ionospheric composition. An improved upper limit on CO in Pluto’s atmosphere is also reported.
Key Words.:
Solar system:general ; Infrared: solar system ; Triton1 Introduction
Like Pluto, Neptune’s satellite and probably former Kuiper-Belt object Triton possesses a tenuous, predominantly nitrogen atmosphere, in equilibrium with surface ices mostly composed of N2 and a variety of other species. The most volatile of these species, CH4 and CO, must be present in trace amounts in the atmosphere as well. However, depending on the precise mechanisms of surface-atmosphere interactions, the expected atmospheric abundances vary by orders of magnitude, and except for the detection of CH4 in the UV by Voyager in 1989, observations have been severely lacking. Progress in IR-detector technology makes the remote study of thin and distant atmospheres now possible. Following our observations of methane in Pluto’s atmosphere (Lellouch et al. 2009), we here report on the first spectroscopic detection of Triton’s atmosphere in the infrared.
2 VLT/CRIRES observations and CH4 and CO measurements
Spectroscopic observations of Triton were obtained on July 4, 2009, using the CRIRES infrared echelle spectrograph (Käufl et al. 2004) installed on ESO VLT (European Southern Observatory Very Large Telescope) UT1 (Antu) 8.2 m telescope. We focussed on the regions of the (2-0) band of carbon monoxide and of the + band of methane, covering the 2318-2330, 2334-2345, 2349-2359 and 2363-2373 nm ranges. We used the instrument in adaptive optics mode and with a slit of 0.4”, providing a mean spectral resolution of 60,000, and acquired spectra during 4 hours. A large Doppler shift (-23 km/s) ensured proper separation of the target lines from the telluric absorptions.
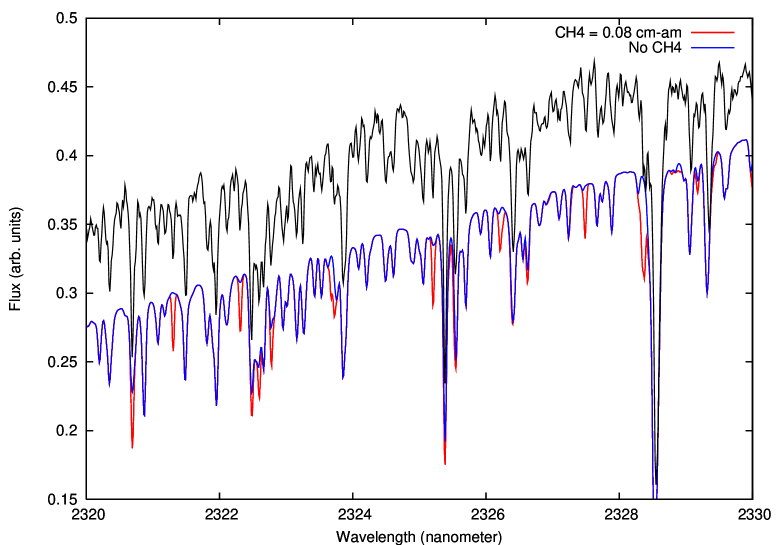
The resulting spectrum shows the detection of many lines due to methane in Triton’s atmosphere, particularly at 2320-2330 nm (Fig. 1). This is the first observation of gaseous methane since its discovery by Voyager (Herbert and Sandel 1991). As for our study of Pluto’s CH4, we constructed a direct line-by-line atmospheric model of Triton, integrated over angles and including solar lines reflected off Triton’s surface as well as the telluric transmission (see details in Lellouch et al. 2009). The spectrum was first modelled by assuming a single-temperature layer, with Triton’s atmospheric methane mean temperature (T) and column density (a) as free parameters. We inferred T=50 K and a = 0.080.03 cm-am (Fig. 2 on-line). The same analysis for Pluto had given T=90 K and a = 0.75 cm-am. This confirms that Pluto’s atmosphere is warmer than Triton’s, as a result of its higher methane abundance.
The error bars on the inferred mean methane temperature are such that it is not possible to constrain the methane vertical distribution. Instead, we used the Voyager-determined thermal structure (temperature vs altitude, Krasnopolsky et al., 1993) and methane vertical profile (Herbert and Sandel 1991, ingress UV occultation profile). The latter shows a decrease of the CH4 mixing ratio with altitude with a scale height of 20 km, due to photolysis. We obtained the same column density as above, indicating a partial pressure of methane of 9.83.7 nbar, i.e. a surface density of (1.90.7) x 1012 cm-3. This appears to be 4 times larger than inferred from Voyager in 1989, adopting the CH4 number densities of Herbert and Sandel (1991) and Strobel and Summers (1995) (4.71011 cm-2, within a factor 1.7, averaging ingress and egress). An even larger enhancement factor (5) is indicated if the Krasnopolsky and Cruikshank (1995) reanalysis of the Voyager UV data, giving CH4 = 3.10.8 1011 cm-3 at the surface, is used. Results are independent on the surface pressure, as collisional broadening is negligible. They clearly demonstrate that the CH4 partial pressure has increased in the last 20 years.
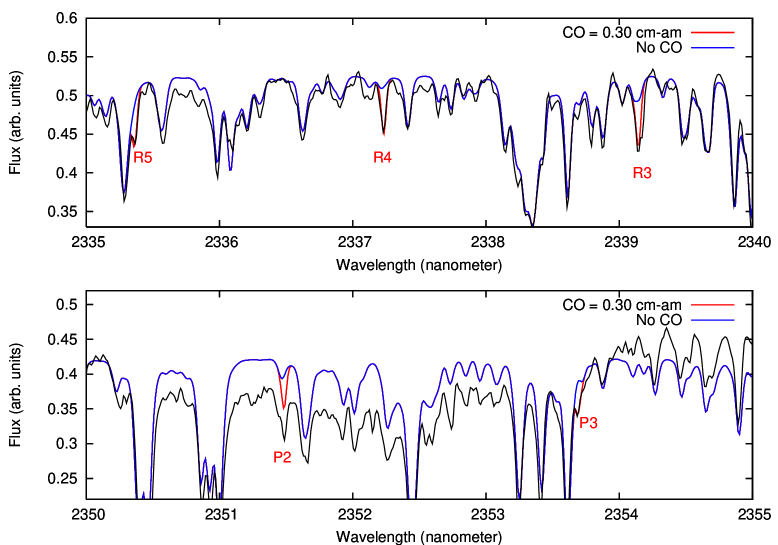
The 2335-2365 nm part of the Triton spectrum (see excerpts in Fig. 3) shows the detection of 8 lines due to the CO(2-0) band (R2-R5, P2, P3, P5 and P8), providing the first detection of CO in its atmosphere. An accurate determination of the CO abundance is particularly difficult, as at infinite spectral resolution, these features are very narrow, saturated Doppler-shaped lines. Nonetheless, assuming a vertically uniform CO distribution, and utilizing the whole set of CO lines (see Fig. 4 on-line), we determine a CO column of 0.30 cm-am, i.e. a CO partial pressure of 24 nbar, within a factor of 3. The column density CO/CH4 ratio is nominally 3.75 (surface partial pressure ratio CO/CH4 2.5), with a factor of 4 uncertainty. Deriving the CO/N2 and CH4/N2 mixing ratio is complicated by the fact that the surface pressure in 2009 is unknown. Stellar occultation results (Olkin et al. 1997, Sicardy et al. 1998, Elliot et al. 1998, 2000a) indicate that the pressure has been doubling in 10 years from the 14 bar value determined by Voyager in 1989 (Gurrola 1995). A reasonable assumption for 2009 is 40 bar, providing CO/N2 610-4 and CH4/N2 2.410-4 at the surface, within factors of 3 and 1.4 respectively. The CO abundance we determine is many times less than previous upper limits (Broadfoot et al. 1989, Young et al. 2001).
2
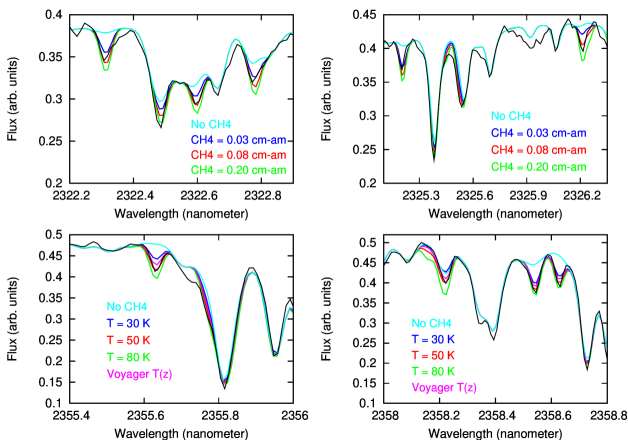
Figure available on-line.
4
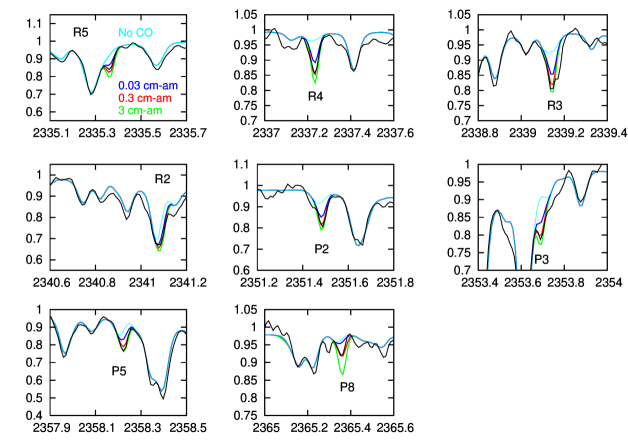
Figure available on-line.
3 Discussion
Near-infrared observations indicate that CO and CH4 are present on Triton’s surface with mixing ratios of 0.05 % and 0.1 % relative to N2, and at least for CH4, mostly in solid solution in N2 (Cruikshank et al. 1993, Quirico et al. 1999, Grundy et al. 2010). In this situation, the expected partial pressure of each species is the product of its solid mole fraction and its pure vapor pressure (Raoult’s law for an ideal mixture). This scenario leads to atmospheric abundances of CO and CH4 that are about 1 and 3 orders of magnitude lower than observed, respectively (Fig. 5). Although Henry’s law may be more applicable than Raoult’s in the case of the N2-CH4 system, this does not reduce the discrepancy by more than a factor of 2-3. This problem has been studied in the case of Pluto’s atmospheric methane, present at the 0.5 % level (Young et al. 1997, Lellouch et al. 2009), i.e. also considerably enriched over its solid solution equilibrium value. The origin of such enhancement is thought to ultimately lie in the seasonal evolution of the N2-dominated solid solution. Preferential sublimation of N2 initially creates a thin surface layer enriched in the less volatile species. Further evolution of this layer may lead either (i) to the formation of chemically pure grains in vertically or geographically segregated deposits (“pure ice” scenario), or (ii) to the establishment of a homogeneous “detailed balancing layer” controlling the surface-atmosphere exchanges. In the “pure ice” case, the atmospheric mixing ratios are in simple proportion of the pure vapor pressures at the relevant ice temperatures (which may be different for different species) and, except for the main species which controls the pressure, of the fractional area covered by each ice. Focussing on the case of CH4 on Pluto, Stansberry et al. (1996) demonstrated that pure CH4 lag deposits (whose existence is proved by observations, see Douté et al. 1999) assume higher temperatures than N2 due to their reduced sublimation cooling and preferential formation in regions of high insolation. Even if covering only a few percent of Pluto’s surface, such patches can explain the observed atmospheric abundance of methane. Alternatively, the “detailed balanced” model (Trafton, 1990; Trafton et al. 1998) predicts that surface-atmosphere exchanges in presence of atmospheric escape and seasonal transport lead to an atmospheric composition reflecting that of the accessible ice reservoir from which it is replenished. When no fractionation (e.g. diffusive) occurs during escape or transport, the atmospheric mixing ratios are identical to those in the volatile reservoir. This is accomplished by the thin surface veneer enriched in the less volatile species, throttling off the N2 sublimation, and in permanent equilibrium with the atmosphere according to Raoult’s law.
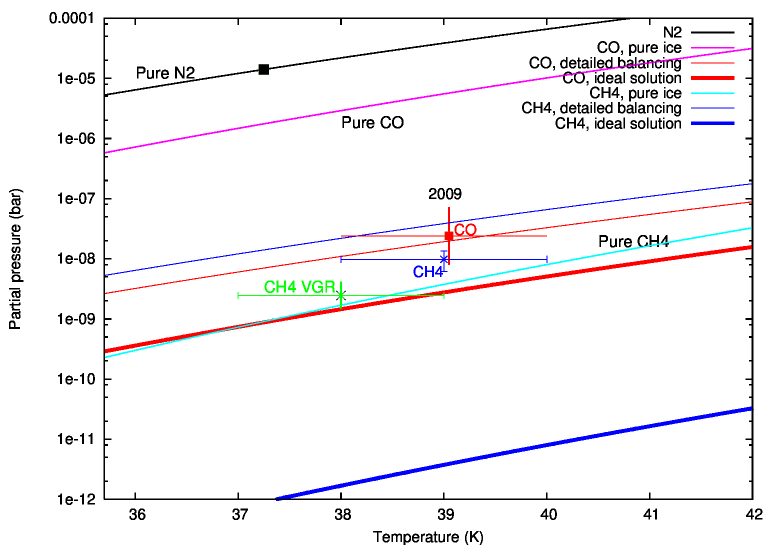
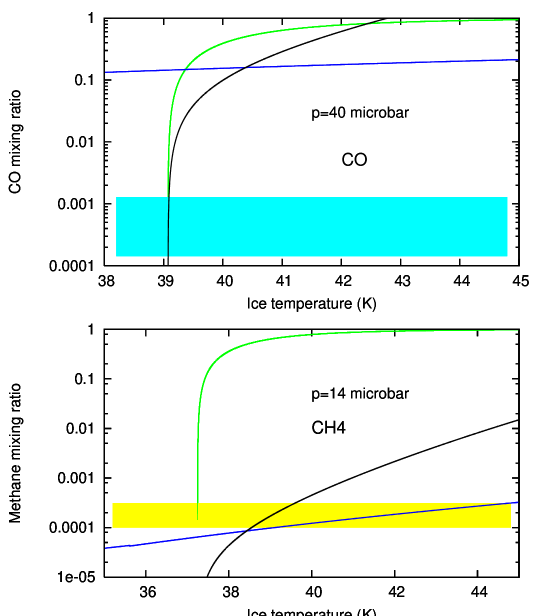
Our observations provide discriminating keys on these scenarios. The case for CO is most straightforward because (i) CO is not subject to diffusive separation from N2 upon escape (ii) as the ratio of its vapor pressure to that of N2 is largely insensitive to temperature in the relevant range (e.g. CO/N2 = 0.112 at 36 K and 0.166 at 41 K), its atmospheric mixing ratio should be roughly seasonally constant. The observed CO abundance is over two orders of magnitude lower than the pure CO vapor pressure (Fig. 5), and one might envisage that the atmospheric CO results from the sublimation of pure CO patches covering 0.4 % of the surface. However, we do not regard this scenario as likely. Although the pure vs isolated form of CO on Triton’s surface has not yet been proven from observations, the miscibility of CO and N2 in solid phase in all proportions and the similarity of their vapor pressures argue for a co-condensation of the two species on Triton’s surface. This is further supported by the strikingly similar longitudinal distribution of the N2 and CO ice bands at Triton (Grundy et al. 2010), strongly suggestive of a spatially constant CO/N2 ice mixing ratio. In addition, even if pure CO patches occurred on Triton’s surface, they would probably not be able to elevate the CO atmospheric abundance along the mechanism envisaged for Pluto methane. This is because CO is not buoyant in N2, restricting the dispersal of CO-rich gas in the background atmosphere and therefore the sublimation rates of the CO patches (Stansberry et al. 1996). Instead, the detailed balancing model provides a physically-expected interpretation to the fact that the atmospheric CO/N2 mixing ratio is consistent with its value in the ice phase (Fig. 5). Based on this scenario, the N2-CO composition of the surface boundary layer (“film”) can be established by simple application of Raoult’s law, providing qCO(film) = qCO(atm)psat(CO) / psat(N2) (Trafton et al. 1998). Adopting again p = 40 bar, our observed qCO(atm) = (2–18) 10-4 indicates qCO(film)= (1.4–12)10-3. Therefore the surface veneer is still dominated by N2 and the presence of CO does not importantly modify the N2 atmospheric pressure, defined by equilibrium at 39.1 K (Fig. 6). Because it may be as thin as a few molecular layers, the surface film may not be visible in the near-IR spectra.
The case for CH4 is more complex. As previously realized (Cruikshank et al. 1993, Yelle et al. 1995, Strobel and Summers 1995, Strobel et al. 1996), the CH4 atmospheric mixing ratio at the surface measured by Voyager (1.810-4) is at least three orders of magnitude larger than expected for ideal mixture. However, we note that it is also smaller, by a factor of 6, than the ice CH4/N2 mixing ratio, and as such does not agree with the detailed balancing model in its simplest form. Unlike CO, CH4 is subject to atmospheric photolysis and mass separation, and its vapor pressure is more temperature-dependent. This probably makes the surface/atmosphere abundance relationship for CH4 complex and seasonally variable. In any case, the phase diagram of N2-CH4 is not obviously consistent with the formation of a CH4-rich solid solution veneer (Stansberry et al., 1996). In fact, explaining the range of observed CH4 atmospheric abundance would require a CH4 mole fraction in the surface film as high as 50-80 % (Fig. 6), well beyond the solubility limit of CH4 in N2 (Prokhvatilov and Yantsevich 1983).The formation of pure CH4 ice grains, decoupled from the mixture and not influencing its sublimation (Stansberry et al. 1996, Spencer et al. 1997), further evolving into a lag deposit, may be a more plausible outcome. Using a Bond albedo of 0.85 (Triton’s polar cap) and an emissivity of 0.7-1, a reasonable subsolar temperature for these pure methane patches is 45-48 K. Applying the Stansberry et al. (1996) Pluto model then indicates that methane patches covering 0.5-1 % of Triton’s surface are sufficient to maintain a 210-4 atmospheric mixing ratio. Although there is no evidence for such patches in Triton’s near-IR spectrum, the methane longitudinal distribution of CH4 ice is different from that of N2, and small areas of CH4-dominated ice, notably near 300∘ longitude, are not inconsistent with observations (Grundy et al. 2010). In contrast, the existence of widespead pure methane ice is ruled out; therefore the emphasized fact that the Voyager-measured methane partial pressure was consistent with vapor pressure equilibrium of pure CH4 ice at 38 K is probably coincidental.
After the Voyager encounter, a variety of seasonal N2 cycle models (see review in Yelle et al. 1995) were explored to attempt explaining Triton’s visual appearance and the then measured surface pressure. These models, which essentially differed in the assumed ice and substrate albedos and thermal inertia, had limited success, leaving unanswered the simple question of where the ice is on Triton. Yet, they made distinctive predictions as to the short-term evolution of Triton’s atmosphere. High thermal inertia models predicted a pressure increase as Triton approached and passed Southern summer solstice in 2000 (Triton subsolar latitude moved from 45.5 S in 1989 to a maximum 50 S in 2000 and 47 S in 2009). This is a consequence of increased insolation on, and attendant sublimation of, the Southern polar cap (Spencer and Moore 1992, Forget et al. 2000). In contrast, “dark frost” models (Hansen and Paige 1992) or low thermal inertia models predicted a pressure decrease from 1980 on, due to the exhaustion of the seasonal southern cap and re-condensation of N2 on the invisible winter pole. The discovery of the pressure increase in the 1990’s, and the persisting signature of N2 and other ices in Triton reflectance spectrum with no obvious temporal evolution (Grundy et al. 2010), strongly argue for the fact that the bright deposits covering most of Triton southern hemisphere are indeed relatively stable seasonal deposits. Our observation that the methane partial pressure has increased by a factor 4 from 1989 to 2009 is qualitatively consistent with the reported pressure increase and the above interpretation. Since the CH4 vapor pressure varies more sharply with temperature than N2, we expect that atmospheric methane is currently increasing more rapidly than pressure, but multi-volatile seasonal models will be needed to fully interpret our results. A direct measurement of Triton’s current pressure is also highly desirable, and could be obtained through a redetermination of the N2 ice temperature from its 2.15 m band (Tryka et al. 1994).
The detection of CO has also implications on Triton’s atmospheric thermal structure, photochemistry, and ionosphere. CO is an important cooling agent through radiation in its rotational lines (Krasnopolsky et al. 1993, Strobel and Summmers 1995, Elliot et al. 2000b). It enriches atmospheric chemistry by introducing additional oxygen species (Krasnopolsky and Cruikshank 1995). Most importantly, it profoundly modifies ionospheric composition by providing a source of C atoms and C+ ions and by suppressing the N+ concentration at the benefit of CO+ and NO+ (see review in Strobel and Summers 1995). Although the error bar on the CO abundance is still large, all previous considerations on the role of CO have now direct observational support.
During the same observing night, we also searched for CO in Pluto’s atmosphere, covering the region of the (3-0) band near 1.57 m. Only an upper limit (1 cm-am) was obtained. For a characteristic surface pressure of 15 bar (Lellouch et al. 2009), this indicates CO/N2 510-3. While improved over previous results (Bockelée-Morvan et al. 2001, Young et al. 2001), this upper limit is still relatively unconstraining when compared to the measured CO ice mole fraction (110-3, Douté et al. 1999). Nonetheless, given the similarity of the two bodies, the above considerations on the surface control of atmospheric CO at Triton should apply to Pluto as well. In 2015, observations with the ALICE and Rex instruments on New Horizons will provide measurements of the surface pressure and CH4 and CO abundance in Pluto’s atmosphere. We anticipate that CO will be measured at a uniform ratio of 0.001 and that the methane mixing ratio will show horizontal variability associated with local time and methane patch distribution.
Acknowledgements.
This work is based on observations performed at the European Southern Observatory (ESO), proposal 383.C-0609. We thank F. Forget, B. Schmitt, and L. Trafton for illuminating discussions.References
- (1) Broadfoot, L. et al. 1989, Science,246, 1459
- (2) Bockelée-Morvan, D. et al., 2001, A&A 377, 343
- (3) Cruikshank, D.P. et al. 1993, Science, 261, 742
- (4) Douté, S. et al. 1999, Icarus, 142, 421
- (5) Elliot, J. L. et al. 1998, Nature 393, 765
- (6) Elliot, J. L. et al. 2000a, Icarus, 148, 347
- (7) Elliot, J. L. et al. 2000b, Icarus, 143, 425
- (8) Forget, F, et al., 2000, Bull. Amer. Astron. Soc., 32, 45.01.
- (9) Fray, N. & Schmitt, B., 2010, Planet. Space. Sci., in press.
- (10) Grundy W. M. et al. 2010, Icarus, in press.
- (11) Gurrola, E.M., 1995, Ph.D. thesis, Stanford University, Palo Alto.
- (12) Hansen, C.A. & Paige, D.A., 1992, Icarus 99, 273
- (13) Herbert, F;, & Sandel, B.R., 1991, JGR, 96, 19241
- (14) Käufl, H.U. et al. 2004, SPIE, 5492, 1218
- (15) Krasnopolsky, V.A., et al. R.J., 1993, JGR 98, 3065
- (16) Krasnopolsky, V.A., & Cruikshank, D.P., 1995, JGR 100, 21271
- (17) Lellouch, E. et al., 2009, A & A, 495, L17
- (18) Olkin, C.B. et al. 1997, Icarus, 129, 178
- (19) Prokhvatilov, A. I.& Yantsevich, L.D. 1983, Sov. J. Low Temp. Phys. 9, 94,
- (20) Quirico, E., et al. 1999, Icarus 139, 159
- (21) Sicardy, B. et al. 1998, Bull. Amer. Astron. Soc., 30, 49.02.
- (22) Spencer, J.R. & Moore, J. M. 1992, Icarus 99, 261
- (23) Spencer, J.R., et al. 1997, in Pluto and Charon, eds. S.A. Stern & D.J. Tholen (The University of Arizona Press), 435
- (24) Stansberry, J.A. et al. 1996, Planet. Space Sci. 44, 1051
- (25) Strobel, D.F. & Summers, M.E. 1995, in Neptune and Triton, ed. D.P. Cruikshank (The University of Arizona Press), 1107
- (26) Strobel, D.F., Zhu, X. & Summers, M.E. 1996, Icarus, 120, 266
- (27) Trafton, L.M., 1990, Ap J, 359, 512
- (28) Trafton, L.M, Matson, D.L.& Stansberry J.A. 1998, in Solar System Ices, eds. B. Schmitt, C. de Bergh, and M. Festou (Kluwer Academic Publishers), 773
- (29) Tryka, K. et al. 1994, Icarus, 112, 513
- (30) Yelle, R.V., Lunine, J.I., Pollack, J.B.,& Brown, R.H., 1995, in Neptune and Triton, ed. D.P. Cruikshank (The University of Arizona Press), 1031.
- (31) Young, L.A., et al. 1997, Icarus, 127, 258
- (32) Young, L.A. et al. 2001, Icarus, 153, 148