Properties of Near-Infrared Selected AGN Candidates with 2MASS/ROSAT Catalogues
Abstract
We report on the near-infrared selected AGN candidates extracted from 2MASS/ROSAT catalogues and discuss their properties. First, near-infrared counterparts of a X-ray source in ROSAT catalogues (namely, Bright Source Catalogue (BSC) and Faint Source Catalogue (FSC)) were extracted by positional cross-identification of . Because these counterparts would contain many mis-identifications, we further imposed near-infrared colour selection criteria and extracted reliable AGN candidates (BSC: 5,273, FSC: 10,071). Of 5,273 (10,071) candidates in the BSC (FSC), 2,053 (1,008) are known AGNs. Near-infrared and X-ray properties of candidates show similar properties with known AGNs and are consistent with previous studies. We also searched for counterparts in other wavelengths (that is, optical, near-infrared, and radio), and investigated properties in multiwavelength. No significant difference between known AGNs and unclassified sources could be seen. However, some unclassified sources in the FSC showed slightly different properties compared with known AGNs. Consequently, it is highly probable that we could extract reliable AGN candidates though candidates in the FSC might be spurious.
keywords:
galaxies: active – galaxies: quasars: general – catalogues1 Introduction
Active galactic nuclei (AGNs) are luminous in wide wavelength because of the vast amount of energy produced by accretion onto a central supermassive blackhole. Accordingly, they are observable at nearly entire wavelength despite locating at great distances, and have been searched in various wavelengths: e.g., optical (Schneider et al., 2007; Véron-Cetty & Véron, 2006), infrared (Low et al., 1988, 1989), or radio (Frayer et al., 2004). X-ray emission is especially a characteristic property of AGNs. The vast majority of X-ray sources are AGNs and all classes of AGNs appear in X-ray surveys. There are many studies that collect AGN samples using X-ray data (e.g., Kim & Elvis, 1999; Watanabe et al., 2004; Polletta et al., 2007). Therefore, whether an object is a X-ray source can be a criterion to select AGNs.
Colour selection is a powerful technique in extracting AGN candidates. A classical method is known as the -excess (UVX; Sandage, 1965; Schmidt & Green, 1983; Boyle et al., 1990), which extract bluer quasars. Richards et al. (2002) selected quasars via their nonstellar colours using SDSS photometry. Other selections are such as red quasar survey using optical and near-infrared combined colours (Glikman et al., 2007), or mid-infrared selected AGNs using Spitzer data (Lacy et al., 2004; Stern et al., 2005).
Colour selection using near-infrared photometry has also performed by some previous studies. Cutri et al. (2001, 2002) extracted obscured AGN candidates using the colour selection of . The method using the excess in K-band, proposed by Warren et al. (2000), was used for extracting quasars (Jurek et al., 2008; Maddox et al., 2008; Smail et al., 2008; Nakos et al., 2009). However, these extracted only peculiar AGNs (in the former case) or extracted AGNs using combined with optical photometry (in the latter case). Because the optical light suffers more extinctions than the infrared light and an AGN is surrounded by a dust torus, a selection using optical and near-infrared combined colours may miss AGNs (especially obscured AGNs), because of lack of optical detection. However, Kouzuma & Yamaoka (2010) proposed colour selection criteria to extract AGNs using only near-infrared colours. They demonstrated by both observed and simulated colours that AGNs are differentiated from several types of objects in a - colour-colour diagram (CCD). This enables us to extract AGN candidates using only near-infrared photometry.
In this paper, we first extract bright sources in both near-infrared and X-ray by a cross-identification between the Two Micron All Sky Survey (2MASS) and ROSAT all-sky survey catalogues, and select AGN candidates on the basis of the near-infrared colour selection criteria proposed by Kouzuma & Yamaoka (2010). In addition, we investigate properties of candidates using not only near-infrared and X-ray data but also photometric data at other wavelengths derived by cross-identifications with some catalogues. In Section 2, we introduce the 2MASS and ROSAT. In Section 3, we describe the method to extract AGN candidates (including the criteria of both cross-identification and colour selection) and the results. In Section 4, properties of AGN candidates are investigated by photometric data at near-infrared, X-ray, and other wavelengths.
2 Data
2.1 2MASS
The 2MASS1112MASS web site (http://www.ipac.caltech.edu/2mass/) (Skrutskie et al., 2006) is a project that observed 99.998% of the whole sky at J (1.25 m), H (1.65 m), Ks (2.16 m) bands, at Mt. Hopkins, AZ (in the Northern Hemisphere) and at CTIO, Chile (in the Southern Hemisphere) between 1997 June and 2001 February. The instruments are both highly automated 1.3-m telescopes equipped with three-channel cameras, each channel consisting of a 256 256 array of HgCdTe detectors. The 2MASS obtained 4,121,439 FITS images (pixel size ) with 7.8 s of integration time. The limiting magnitudes (Signal-to-Noise Ratio (S/N)10) are 15.8 (J), 15.1 (H), 14.3 (K) mag at each band. The Point Source Catalogue (PSC) was produced using these images and catalogued 470,992,970 sources. In the 2MASS web site, the images and the PSC are open to the public and are easily available.
2.2 ROSAT
The ROSAT is an X-ray astronomical satellite launched in 1990. During six months soon after the launching, all-sky imaging survey in the energy range of keV was performed with a X-ray reflector equipped with Position Sensitive Proportional Counter (PSPC). A limiting PSPC count-rate is cts s-1. This is the first imaging survey in the X-ray wavelength. The survey has yielded Bright Source Catalogue (BSC) and Faint Source Catalogue (FSC), and they contain 18,806 and 105,926 sources, respectively, with positional error of . Both catalogues have already been open to the public and available on the web. In this paper, we use both BSC and FSC.
3 Extraction of AGN candidates
3.1 Cross-identification
We cross-identified ROSAT catalogues with the 2MASS PSC to extract a near-infrared counterpart for a X-ray source. We set a positional criterion of , that is, we treat as a near-infrared counterpart when a 2MASS source is within of a ROSAT source. As a result of the cross-identification, we extracted 46,205 (217,033) sources. Even though several 2MASS sources may be located within of a ROSAT source, we treated them as counterparts for the X-ray source. Accordingly, in the positional criterion of , many objects are miss-identified due to the difference of angular resolutions. Therefore, we further imposed colour selection criteria to extract reliable counterparts.
3.2 Colour Selection
The difference between positional accuracies causes mis-identification on a cross-identification. Therefore, another criterion is required for accurately extracting a counterpart. Bessell & Brett (1988) presented stellar locus in a near-infrared ()-() CCD. Because most 2MASS sources are galactic normal stars, mis-identified sources should be located around the stellar locus in the near-infrared CCD. Kouzuma & Yamaoka (2010) investigated near-infrared colours of quasars/AGNs and demonstrated that the locus of quasars/AGNs are differentiated from the stellar locus in the near-infrared CCD. They also proposed near-infrared colour selection criteria for extracting AGNs:
| (1) |
| (2) |
We adopted these criteria for extracting reliable AGN candidates from the cross-identified sources. Before the near-infrared colour selection, we extracted the sources having photometric quality flags in the 2MASS PSC superior to B (corresponding to ). Samples were reduced to 27,058 (121,767) sources. We subsequently extracted AGN candidates on the basis of the near-infrared colour selection criteria.
Because most sources with are probably normal stars, we further ruled out such sources (i.e., extracted only sources with ).
3.3 Extracted Candidates
Finally, we have extracted 5,273 (10,701) sources as AGN candidates in the BSC (FSC). To confirm that candidates have been already known, we checked the following AGN catalogues: Véron-Cetty & Véron (2006); Schneider et al. (2007); Anderson et al. (2007); Brinkmann et al. (2000); Wei et al. (1999); Yuan et al. (1998).
Table 1 shows the number of identified sources in each catalogue. Of 5,273 (10,071) candidates, 2,053 (1,008) sources have been already known as AGNs. It is highly probable that remaining 3,220 (9,693) sources are unknown AGNs. Below, we consider the reliability of AGN candidates by investigating properties of them.
| AGN catalogue | BSC | FSC |
| Quasars and Active Galactic Nuclei (12th Ed.) (Véron-Cetty & Véron, 2006) | 1,900 | 871 |
| SDSS-DR5 quasar catalog (Schneider et al., 2007) | 493 | 343 |
| AGN from RASS and SDSS DR5 (Anderson et al., 2007) | 776 | 537 |
| ROSAT-FIRST AGN correlation (Brinkmann et al., 2000) | 171 | 108 |
| RASS AGN sample (Wei et al., 1999) | 110 | 0 |
| ROSAT detected quasars II (Yuan et al., 1998) | 104 | 32 |
| total known sources | 2,053 | 1,008 |
4 Properties of AGN candidates
4.1 Near-Infrared and X-ray Properties
We investigate near-infrared and X-ray properties of the AGN candidates. The zero-magnitudes of near-infrared fluxes at three bands are based on Cohen et al. (2003). The ROSAT PSPC count rate (0.1 – 2.4 keV) of each source was converted to a X-ray flux by assuming that the spectrum is a power-law with an index of .
4.1.1 Photometric Properties
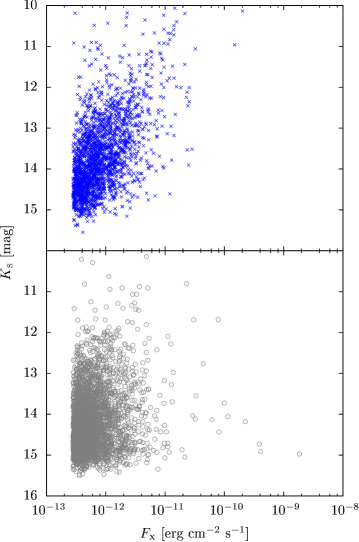
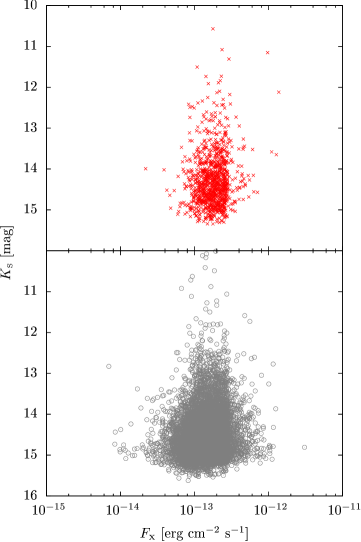
Figure 1 shows the - diagrams. It is known, by previous studies, that there is a correlation between optical magnitude and X-ray flux. For known AGNs in the BSC, there appears to be a correlation between and X-ray flux. The distribution of unclassified sources is similar to that of known AGNs, although a correlation of unclassified sources seems to be weak. Because FSC sources are mainly gathered sources fainter than the count rate of counts s-1, there is a small number of sources in the range of erg cm-2 s-1 (corresponding to 0.05 counts s-1).
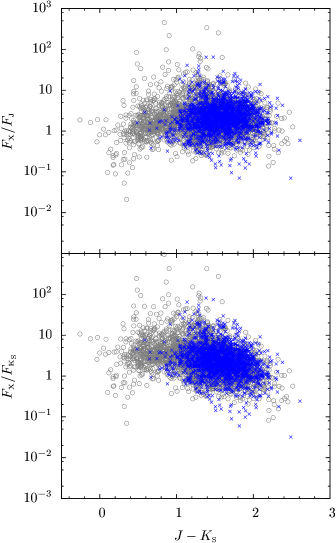
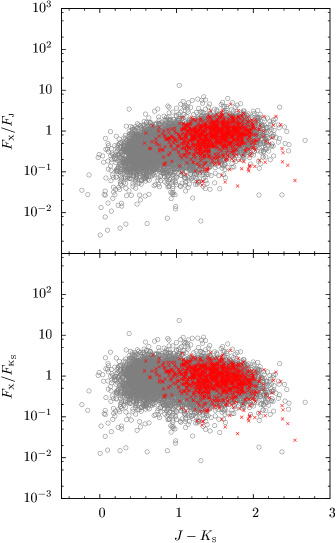
Figure 2 shows the ()- () diagrams. As to candidates in the BSC, is nearly constant though decreases with colour. On the other hand, as to candidates in the FSC, is directly proportional to colour and decreases with colour compared with . A similarity between candidates in the BSC and the FSC is that decreases with colour. This is probably due to extinctions because the light at the J-band suffers extinction than the light at the K band (i.e., should be absorbed than ).
Bernt Haakonsen & Rutledge (2009) reported loci of various types of objects in a ()-() diagram using both 2MASS photometry and X-ray flux in the ROSAT BSC. Their diagram shows that the AGN locus is well separated from those of other types of objects such as normal stars, where almost all of the AGNs have and . The locus of our candidates is consistent with their AGN locus.
Some unclassified sources in the BSC or the FSC have , where few known AGNs are distributed. These sources might be spurious AGNs or other kinds of AGNs (e.g., AGNs having extremely small extinction and low luminosity) that have not been found by previous surveys.
4.1.2 Hardness Ratio
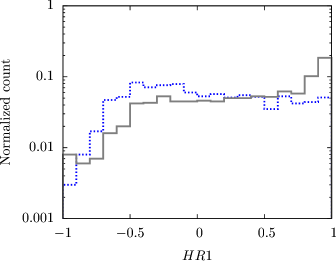
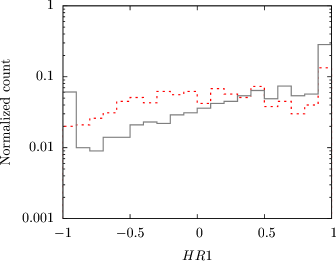
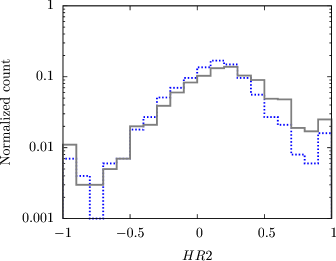
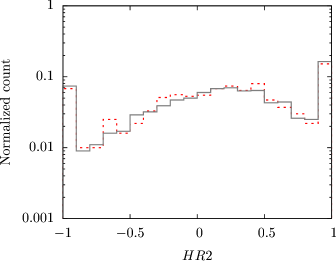
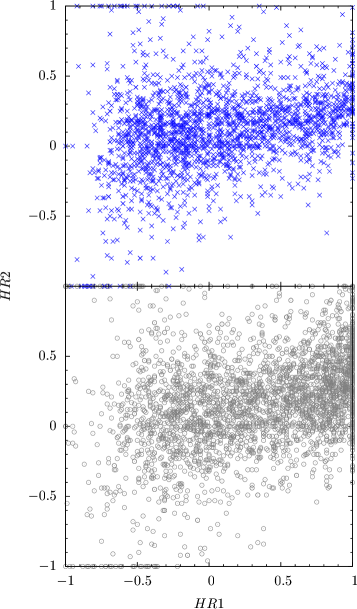
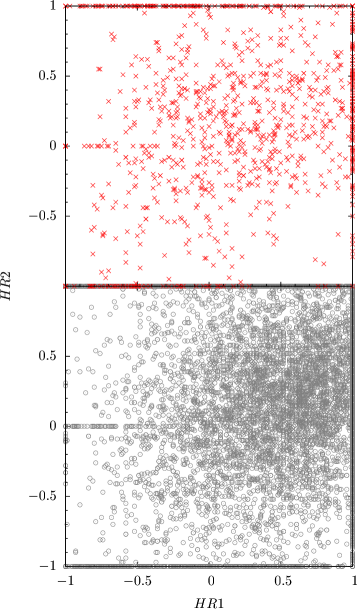
Figure 3 shows histograms of two hardness ratios (HR1 and HR2), where HR1 and HR2 are given using four energy bands, that is, A (Pulse Height Amplitude (PHA) channels 11–41), B (52–201), C (52–90), and D (91–201): HR1=(B-A)/(B+A) and HR2=(D-C)/(D+C), respectively. In the HR1 histogram for the BSC, both known AGNs and unclassified sources show a flat distribution in HR1 and the number of sources decreases in HR1, although the number of unclassified sources is relatively larger in HR1. Voges et al. (1999) presented that X-ray counterparts for AGNs in the catalogue of Veron-Cetty & Veron (1998) show a flat distribution in the range between to . Hence, the HR1 property of these candidates is consistent with Voges et al. (1999). On the other hand, although known AGNs in the FSC have a similar shape in Voges et al. (1999), the number of unclassified sources in the FSC increase towards larger HR1 values (i.e., they are relatively harder as compared to known AGNs). Therefore, some candidates in the FSC might be contaminated by galaxies because Abell clusters of galaxies (ACO) objects tend to have harder than stars and AGNs in their diagrams (Voges et al., 1999). In the HR2 histograms, they have peaks at HR2 and this is also consistent with the HR2 histograms of AGNs in Voges et al. (1999). It should be noted that in the range over HR2 there are relatively large number of unclassified candidates in the BSC than known AGNs (i.e., there are harder samples) though the distributions for known/unknown sources in the FSC are alike.
In Figure 4, HR1 versus HR2 diagrams are shown. Both known AGNs and unclassified sources in the BSC have similar distribution each other, although there are a relatively large number of unclassified sources in HR1 as pointed out the above. Most of them are located in HR1 and HR2 space and show a flat distribution with respect to HR1. Voges et al. (1999) compared distributions among three types of objects (namely, TYCHO stars, ACO objects, and AGNs) and presented that AGNs are found mostly in the central part with HR1 and HR2. The distribution of our samples are very similar to that of Voges et al. (1999). Therefore, our candidates in the BSC is consistent with the property of AGNs in Voges et al. (1999). On the other hand, candidates in the FSC tend to have a dispersion distribution compared to candidates in the BSC. Although errors of hardness ratios affect the distribution, there may be many spurious AGNs in the candidates detected in the FSC.
4.2 Properties of Counterparts
| catalogue | positional | number | |
|---|---|---|---|
| criterion | BSC | FSC | |
| SDSS | 1,857 (624) | 2,028 (1,301) | |
| DENIS | 1,949 (1,443) | 3,902 (3,722) | |
| FIRST | 592 (106) | 381 (159) | |
| NVSS | 534 (190) | 383 (244) |
AGNs are observable in multiwavelength. Accordingly, counterparts at other wavelengths provide us with information about their properties. To find multiwavelength counterparts of AGN candidates, the candidates were positionally cross-identified with the following catalogues: Sloan Digital Sky Survey (SDSS) Photometric Catalog, Release 7 (Adelman-McCarthy et al., 2008; Adelman-McCarthy & et al., 2009), 3rd release of the Deep Near Infrared Survey of the southern sky (DENIS) database (DENIS consortium, 2005), Faint Images of the Radio Sky at Twenty-centimeters (FIRST) Survey Catalog, Version 03Apr11 (White et al., 1997), and 1.4GHz National Radio Astronomy Observatory (NRAO) Very Large Array (VLA) Sky Survey (NVSS; Condon et al., 1998). Table 2 summarizes the number of counterparts in each catalogue.
4.2.1 Optical Properties
Of 1,857 (2,028) SDSS counterparts in the BSC (FSC), 624 (1,301) are unclassified sources. Here, we investigate photometric properties using SDSS photometry.
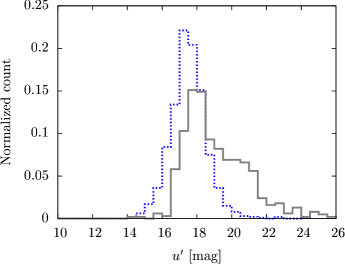
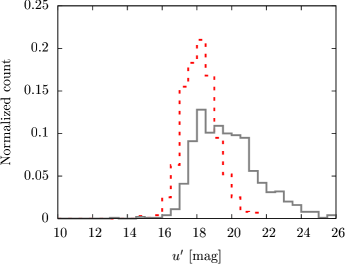
Figure 5 shows histograms of magnitudes in the SDSS catalogue. Unclassified sources are relatively fainter than known AGNs. This is because the search in the near-infrared/X-ray, in which light suffers smaller extinction than in the optical, enables us to detect faint sources in the optical wavelength.
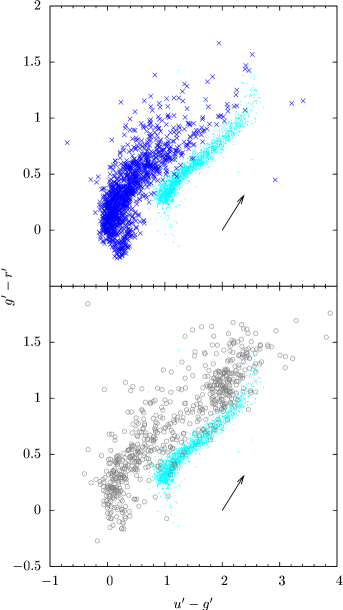
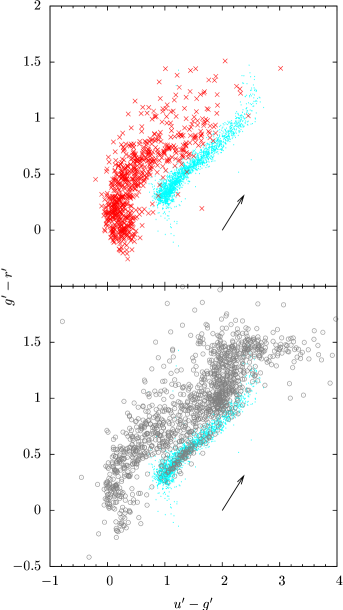
In Figure 6, we plotted candidates on a - CCD. There are several studies investigating stellar locus in a CCD using SDSS photometry (e.g., Fan, 1999; Finlator et al., 2000; Sesar et al., 2006). Their stellar loci are consistent with each other. Anderson et al. (2003, 2007) also investigated distributions of normal stars, AGNs, and quasars in the - CCD, and demonstrated that loci of quasars/AGNs are separated from the stellar locus. The locus of sample stars, taken from the SDSS catalogue, is also shown in Figure 6. The reddening vector is based on Fukugita et al. (2004). Almost all of the known AGNs in both catalogues are clearly separated from the stellar locus. Although most unclassified sources are not located at the stellar locus, some sources are distributed around the stellar locus. It is noticeable for unclassified sources in the FSC. These sources might not be AGNs but normal stars.
We can notice that some unclassified sources are located in (especially, around ), where few known AGNs are distributed. Most of these sources are still differentiated from the stellar locus. These might be highly reddened AGNs or other types of AGNs that are not discovered in SDSS surveys. We note that most of the unclassified sources with are probably newly discovered AGNs.
4.2.2 Near-Infrared Variability

| criterion | BSC | FSC | ||
|---|---|---|---|---|
| known | unclassified | known | unclassified | |
| 98 (19) | 211 (15) | 25 (14) | 256 (7) | |
| 24 (5) | 73 (5) | 10 (6) | 148 (4) | |
| 36 (7) | 62 (4) | 7 (4) | 77 (2) | |
| 11 (2) | 8 (1) | 1 (1) | 16 (0) | |
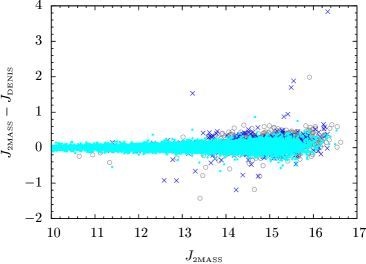
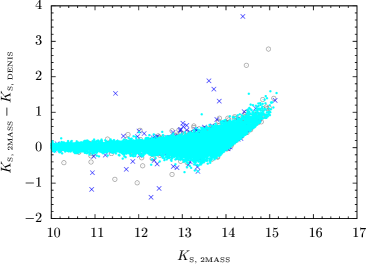
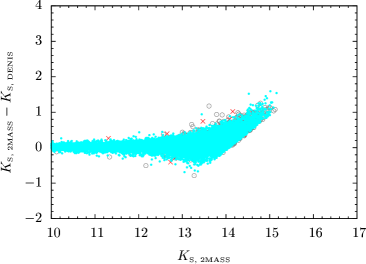
AGNs are known to have variability across wide wavelength ranges from radio to X-ray or -ray (Krolik et al., 1991; Edelson et al., 1996; Giveon et al., 1999). Here, we investigate variability of AGN candidates in the near-infrared wavelength, by comparing magnitudes between 2MASS and DENIS.
Figure 7 shows - and - diagrams, where and , respectively. We also plotted photometric differences of normal stars for referring to typical difference between 2MASS and DENIS photometric systems. Sample stars are taken from area, whose near-infrared colours are consistent with those of normal stars in Bessell & Brett (1988). We note that the sample stars have photometric quality flags in both 2MASS and DENIS catalogues superior to B () and 90, respectively. The DENIS photometry is transformed into the 2MASS photometry on the basis of Carpenter (2001). Standard deviations and for the sample stars are 0.08 and 0.20, respectively. As seen in the diagrams, there are several sources clearly showing variability. Table 3 summarizes the number of candidates showing variability larger than and . In our sample, percentages of candidates with variability in the FSC are relatively smaller than those in the BSC. Faint AGNs at the X-ray possibly show less variability. We note that, practically, there should be more sources with variability because we could compare only double-epoch magnitudes.
4.2.3 Radio Properties
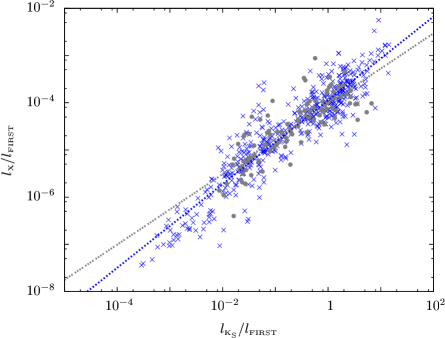
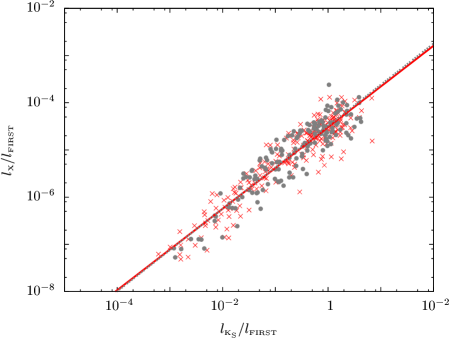
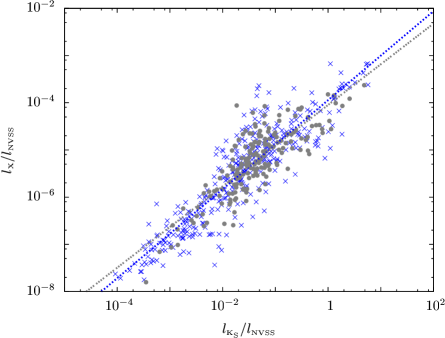
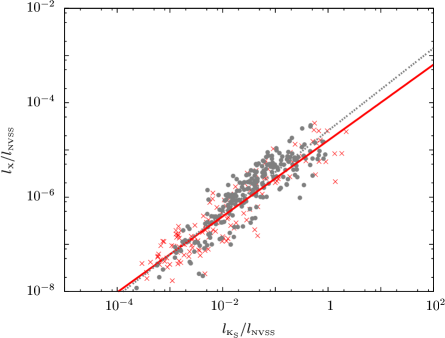
Figure 8 shows flux ratios versus diagram. Significant differences between known AGNs and unclassified sources can not be clearly seen in each diagram. There appears to be correlations between and in the diagrams. We performed least square fittings for the distributions of both known AGNs and unclassified sources. The least square fitting lines are also shown in the diagrams. Still, there is no significant difference between known AGNs and unclassified sources in each diagram, although in the – for the BSC there is small difference in slope. It is known that there is a correlation between luminosity ratios and (e.g., Brinkmann et al., 1995, 1997, 2000). Correlations in our sample may be a variant of such correlations.
Because unclassified sources have similar properties with known AGNs in the diagrams, these properties also support that unclassified sources are AGNs.
5 Summary and Conclusions
We have cross-identified the 2MASS PSC with ROSAT catalogues, and have extracted AGN candidates on the basis of the near-infrared colour selection. Of 5,273 (10,701) AGN candidates in the BSC (FSC), 3,220 (9,693) are unclassified sources. We investigated their properties using near-infrared, X-ray, optical, and radio data. Overall, most unclassified sources in the BSC have similar properties with known AGNs and their properties are also consistent with previous studies, whereas some unclassified sources, especially those in the FSC, have properties different from known AGNs.
It is highly probable that most unclassified sources are AGNs because of the following reasons. First, our candidates are X-ray sources. The fact that a object is a X-ray source supports the object is an AGN because it is believed that the vast majority of X-ray sources are AGNs. Second, our candidates satisfy the near-infrared colour selection criteria proposed by Kouzuma & Yamaoka (2010), that is, they have properties in near-infrared colours similar to those of AGNs. Third, some candidates have been already known AGNs and not only unclassified sources show properties similar to those of known AGNs but also their properties in multiwavelength are consistent with previous studies. However, it should be noted that there may be relatively large number of contamination in unclassified FSC sources. To confirm that they are real AGNs, spectroscopic observations are required.
Similar works using a cross-identification with a ROSAT catalogue were performed by Boller et al. (1992b, 1998). Boller et al. (1992b) extracted a sample of 14,708 extragalactic IRAS sources on the basis of a supervised selection whose selection quality was assessed by Boller et al. (1992a), and they cross-identified between the sample and the first processing of the ROSAT all-sky survey data. The cross-identified 244 IRAS galaxies comprised infrared luminous nearby galaxies, spirals and ellipticals, Seyfert galaxies, and QSOs. They investigated properties of the cross-identified sources using X-ray, far-infrared, and optical fluxes, and found some correlations between them. The work in Boller et al. (1998) is also similar to that in Boller et al. (1992b), which cross-indentified the 14,315 IRAS galaxies with the second processing of the ROSAT all-sky survey. These studies are similar to our study in that a ROSAT catalogue is cross-identified with an infrared catalogue. However, whereas these studies investigated extragalactic sources extracted by a mid- and far-infrared colour selection, we investigated AGN candidates extracted by the near-infrared colour selection. The number of sample is also totally different. In addition, we discussed not only properties in infrared and X-ray but also near-infrared variability and radio properties, which are not discussed in Boller et al. (1992b, 1998).
This paper extracted several thousands of AGN candidates across the entire sky. The use of only near-infrared colours enables us to search for AGN candidates across the entire sky. When using this technique on other deep near-infrared surveys such as DENIS, UKIDSS, and future surveys, many AGNs, which have not been detected in the optical wavelength, can be extracted.
Acknowledgement
This publication makes use of data products from the Two Micron All Sky Survey, which is a joint project of the University of Massachusetts and the Infrared Processing and Analysis Center/California Institute of Technology, funded by the National Aeronautics and Space Administration and the National Science Foundation. TOPCAT (http://www.starlink.ac.uk/topcat/) helps us investigate the photometric properties of the AGN candidates. We thank the referee, Dr. Thomas Boller, for his suggestions.
References
- Adelman-McCarthy et al. (2008) Adelman-McCarthy, J. K., Agüeros, M. A., Allam, S. S., et al. 2008, ApJS, 175, 297
- Adelman-McCarthy & et al. (2009) Adelman-McCarthy, J. K. & et al. 2009, VizieR Online Data Catalog, 2294, 0
- Anderson et al. (2007) Anderson, S. F., Margon, B., Voges, W., et al. 2007, AJ, 133, 313
- Anderson et al. (2003) Anderson, S. F., Voges, W., Margon, B., et al. 2003, AJ, 126, 2209
- Bernt Haakonsen & Rutledge (2009) Bernt Haakonsen, C. & Rutledge, R. E. 2009, ApJS, 184, 138
- Bessell & Brett (1988) Bessell, M. S. & Brett, J. M. 1988, PASP, 100, 1134
- Boller et al. (1998) Boller, T., Bertoldi, F., Dennefeld, M., & Voges, W. 1998, A&AS, 129, 87
- Boller et al. (1992a) Boller, T., Meurs, E. J. A., & Adorf, H. 1992a, A&A, 259, 101
- Boller et al. (1992b) Boller, T., Meurs, E. J. A., Brinkmann, W., et al. 1992b, A&A, 261, 57
- Boyle et al. (1990) Boyle, B. J., Fong, R., Shanks, T., & Peterson, B. A. 1990, MNRAS, 243, 1
- Brinkmann et al. (2000) Brinkmann, W., Laurent-Muehleisen, S. A., Voges, W., et al. 2000, A&A, 356, 445
- Brinkmann et al. (1995) Brinkmann, W., Siebert, J., Reich, W., et al. 1995, A&AS, 109, 147
- Brinkmann et al. (1997) Brinkmann, W., Yuan, W., & Siebert, J. 1997, A&A, 319, 413
- Carpenter (2001) Carpenter, J. M. 2001, AJ, 121, 2851
- Cohen et al. (2003) Cohen, M., Wheaton, W. A., & Megeath, S. T. 2003, AJ, 126, 1090
- Condon et al. (1998) Condon, J. J., Cotton, W. D., Greisen, E. W., et al. 1998, AJ, 115, 1693
- Cutri et al. (2002) Cutri, R. M., Nelson, B. O., Francis, P. J., & Smith, P. S. 2002, in Astronomical Society of the Pacific Conference Series, Vol. 284, IAU Colloq. 184: AGN Surveys, ed. R. F. Green, E. Y. Khachikian, & D. B. Sanders, 127–+
- Cutri et al. (2001) Cutri, R. M., Nelson, B. O., Kirkpatrick, J. D., Huchra, J. P., & Smith, P. S. 2001, in Astronomical Society of the Pacific Conference Series, Vol. 232, The New Era of Wide Field Astronomy, ed. R. Clowes, A. Adamson, & G. Bromage, 78–+
- Edelson et al. (1996) Edelson, R. A., Alexander, T., Crenshaw, D. M., et al. 1996, ApJ, 470, 364
- Fan (1999) Fan, X. 1999, AJ, 117, 2528
- Finlator et al. (2000) Finlator, K., Ivezić, Ž., Fan, X., et al. 2000, AJ, 120, 2615
- Frayer et al. (2004) Frayer, D. T., Reddy, N. A., Armus, L., et al. 2004, AJ, 127, 728
- Fukugita et al. (2004) Fukugita, M., Yasuda, N., Brinkmann, J., et al. 2004, AJ, 127, 3155
- Giveon et al. (1999) Giveon, U., Maoz, D., Kaspi, S., Netzer, H., & Smith, P. S. 1999, MNRAS, 306, 637
- Glikman et al. (2007) Glikman, E., Helfand, D. J., White, R. L., et al. 2007, ApJ, 667, 673
- Jurek et al. (2008) Jurek, R. J., Drinkwater, M. J., Francis, P. J., & Pimbblet, K. A. 2008, MNRAS, 383, 673
- Kim & Elvis (1999) Kim, D.-W. & Elvis, M. 1999, ApJ, 516, 9
- Kouzuma & Yamaoka (2010) Kouzuma, S. & Yamaoka, H. 2010, A&A, 509, A260000+
- Krolik et al. (1991) Krolik, J. H., Horne, K., Kallman, T. R., et al. 1991, ApJ, 371, 541
- Lacy et al. (2004) Lacy, M., Storrie-Lombardi, L. J., Sajina, A., et al. 2004, ApJS, 154, 166
- Low et al. (1988) Low, F. J., Cutri, R. M., Huchra, J. P., & Kleinmann, S. G. 1988, ApJ, 327, L41
- Low et al. (1989) Low, F. J., Cutri, R. M., Kleinmann, S. G., & Huchra, J. P. 1989, ApJ, 340, L1
- Maddox et al. (2008) Maddox, N., Hewett, P. C., Warren, S. J., & Croom, S. M. 2008, MNRAS, 386, 1605
- Nakos et al. (2009) Nakos, T., Willis, J. P., Andreon, S., et al. 2009, A&A, 494, 579
- Polletta et al. (2007) Polletta, M., Tajer, M., Maraschi, L., et al. 2007, ApJ, 663, 81
- Richards et al. (2002) Richards, G. T., Fan, X., Newberg, H. J., et al. 2002, AJ, 123, 2945
- Sandage (1965) Sandage, A. 1965, ApJ, 141, 1560
- Schmidt & Green (1983) Schmidt, M. & Green, R. F. 1983, ApJ, 269, 352
- Schneider et al. (2007) Schneider, D. P., Hall, P. B., Richards, G. T., et al. 2007, AJ, 134, 102
- Sesar et al. (2006) Sesar, B., Svilković, D., Ivezić, Ž., et al. 2006, AJ, 131, 2801
- Skrutskie et al. (2006) Skrutskie, M. F., Cutri, R. M., Stiening, R., et al. 2006, AJ, 131, 1163
- Smail et al. (2008) Smail, I., Sharp, R., Swinbank, A. M., et al. 2008, MNRAS, 389, 407
- Stern et al. (2005) Stern, D., Eisenhardt, P., Gorjian, V., et al. 2005, ApJ, 631, 163
- Veron-Cetty & Veron (1998) Veron-Cetty, M. & Veron, P. 1998, A Catalogue of quasars and active nuclei, ed. P. Veron-Cetty, M.-P. & Veron
- Véron-Cetty & Véron (2006) Véron-Cetty, M.-P. & Véron, P. 2006, A&A, 455, 773
- Voges et al. (1999) Voges, W., Aschenbach, B., Boller, T., et al. 1999, A&A, 349, 389
- Warren et al. (2000) Warren, S. J., Hewett, P. C., & Foltz, C. B. 2000, MNRAS, 312, 827
- Watanabe et al. (2004) Watanabe, C., Ohta, K., Akiyama, M., & Ueda, Y. 2004, ApJ, 610, 128
- Wei et al. (1999) Wei, J. Y., Xu, D. W., Dong, X. Y., & Hu, J. Y. 1999, A&AS, 139, 575
- White et al. (1997) White, R. L., Becker, R. H., Helfand, D. J., & Gregg, M. D. 1997, ApJ, 475, 479
- Yuan et al. (1998) Yuan, W., Brinkmann, W., Siebert, J., & Voges, W. 1998, A&A, 330, 108