Magnetic, thermal and transport properties of Cd doped CeIn3
Abstract
We have investigated the effect of Cd substitution on the archetypal heavy fermion antiferromagnet CeIn3 via magnetic susceptibility, specific heat and resistivity measurements. The suppression of the Neel temperature, TN, with Cd doping is more pronounced than with Sn. Nevertheless, a doping induced quantum critical point does not appear to be achievable in this system. The magnetic entropy at and the temperature of the maximum in resistivity are also systematically suppressed with Cd, while the effective moment and the Curie-Weiss temperature in the paramagnetic state are not affected. These results suggest that Cd locally disrupts the AFM order on its neighboring Ce moments, without affecting the valence of Ce. Moreover, the temperature dependence of the specific heat below is not consistent with 3D magnons in pure as well as in Cd-doped CeIn3, a point that has been missed in previous investigations of CeIn3 and that has bearing on the type of quantum criticality in this system.
pacs:
I Introduction
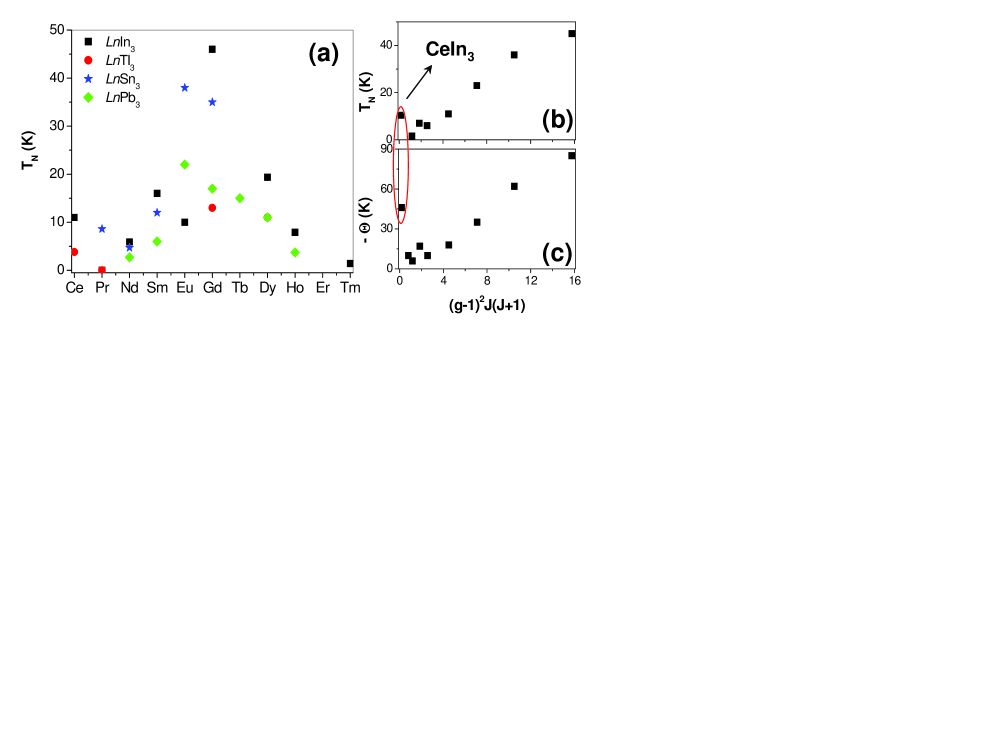
CeIn3 is a heavy fermion antiferromagnet (AFM) belonging to the family of Ce-binaries that form in the cubic Cu3Au structure. Its Neel temperature K is much larger than expected from a simple DeGennes scalingBuschow et al. (1969). Indeed both the Neel and the Curie-Weiss temperatures for CeIn3 deviate from the DeGennes scaling, as seen in Fig. 1. The Curie-Weiss temperature in rare-earth compounds reflects the strength of the intersite (RKKY) coupling and thus should follow the DeGennes factor . At low temperatures, the Kondo screening of Ce moments is expected to reduce rather than enhance the intersite coupling, so a larger is quite surprising. in either case, this deviation might be attributed to crystal field effects. Note that the DeGennes scaling is well-obeyed in the related layered CeMIn5 and CeIn8 (Co,Rh,Ir) compoundsPagliuso et al. (2001). CeIn3 also exhibits pressure-induced superconductivity, with K, around the critical pressure where is suppressed to zero Mathur et al. (1998); Knebel et al. (2001). NQR measurements indicate homogeneous coexistence between superconductivity and the AFM state under pressureKawasaki et al. (2008). The occurrence of superconductivity in the vicinity of the AFM quantum critical point originally lead to the idea of magnetically mediated Cooper pairing in this and other heavy fermion superconductorsMathur et al. (1998); Monthoux et al. (2007).
CeIn3 is one of the most thoroughly studied systems among heavy fermion compounds, in part due to the availability of large single crystals of high quality. Its magnetic structure and fluctuations are well characterized via neutron scatteringLawrence and Shapiro (1980); Knafo et al. (2003), with a commensurate ordering wavevector of (1/2,1/2,1/2) and an ordered moment of , close to the expected moment for the crystal field ground state, Boucherle et al. (1983). Evidence for Kondo coupling has been found in resonant photoemissionAllen et al. (1981); Kim et al. (1997), in form of a broad peak at the Fermi level, similar to CeSn3 but with a weaker hybridization, as well as in inelastic neutron scatteringKnafo et al. (2003), in form of a non-dispersive quasi-elastic peak corresponding to a single ion Kondo scale K, of the same order as . The magnetic entropy recovered at is close to , meaning that the Kondo coupling does not efficiently quench the local moments prior to magnetic ordering. This is also supported by a moderately large electronic specific heat coefficient in the paramagnetic state, mJ/K2mol, corresponding to a mass enhancement of 27 compared to the non-magnetic La-analog.
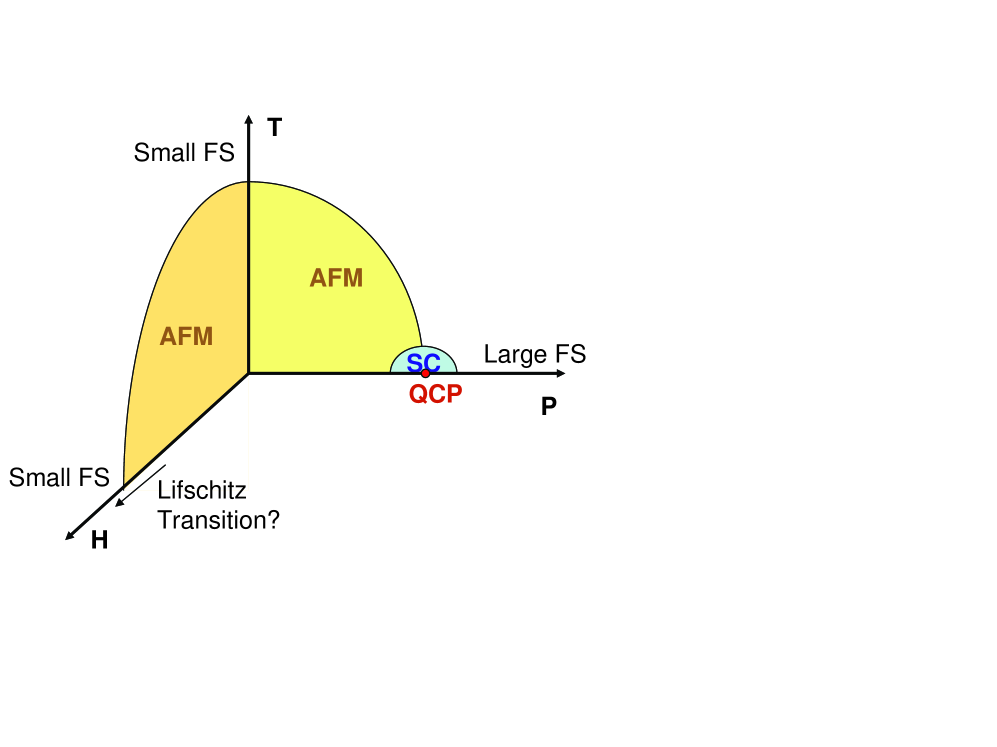
The Fermi Surface (FS) of CeIn3 continues to be a focus of attention, in connection with the theoretical possibility of a FS change across a zero temperature AFM instability, also called a quantum critical point (QCP)Coleman et al. (2001). Hot spots have been identified in pulsed field dHvA measurements, with a divergent effective mass for field Ebihara et al. (2004). The corresponding region of the FS is the protruded neck in LaIn3 and the mass enhancement has been attributed to the topological change due to the AFM Brillouin zone boundary crossing the FSGor’kov and Grigoriev (2006). The CeIn3 Fermi surface has been mapped in the PM state via electron-positron annihilation technique and corresponds to fully localized -electronsBiasini et al. (2003). More recently it is claimed that the divergence of the effective mass actually happens within the Neel state, pointing to a FS topology change generically known as a Lifshitz transitionSebastian et al. (2009). Moreover, the field polarized PM state (for T) has a small FS (corresponding to localized -electrons) at ambient pressureHarrison et al. (2007) but a large FS (corresponding to itinerant -electrons) at high pressure (for )Settai et al. (2006); Endo et al. (2004); Settai et al. (2005). The phase diagram of CeIn3 is schematically represented in Fig 2. It is unclear how the FS continuously evolves from small to large in the PM state with applied pressure.
Evidence for a pressure induced QCP in the CeIn3 phase
diagram comes from the fact that the resistivity exhibits a
temperature exponent strictly less than 2 at , corresponding to
a breakdown of the Fermi Liquid behaviorKnebel et al. (2001).
The FS volume increase, deduced from dHvA under
pressureSettai et al. (2006); Endo et al. (2004); Settai et al. (2005),
across the critical pressure where AFM is suppressed,
suggests a local QCP, where the -electrons drop out of the FS
when they order magneticallyColeman et al. (2001). The commonly
accepted examples of a local QCP are
CeCu5.9Au0.1Schroder et al. (2000) and
YbRh2Si2Gegenwart et al. (2002). Doping studies of CeIn3,
on the other hand, are more consistent with a spin-density wave type
of QCPHertz (1976); Millis (1993), where the -electrons retain their
localized character on both sides of the QCP. The AFM order in
CeIn3-xSnx can be suppressed to at ,
with a logarithmically divergent electronic specific
heatRus et al. (2005); Pedrazzini et al. (2004), characteristic of heavy
fermion compounds at the QCP. The divergence of the Gruneisen ratio
at this concentration has the exponent expected from a 3D-SDW
QCPKuchler et al. (2006). This is also supported by the fact that
there is no real breakdown of the FL behavior in the resistivity of
a sample when the Neel order is suppressed by a large
applied magnetic fieldSilhanek et al. (2006). An important open
question is then: is there two distinct QCP’s with different
mechanisms in this system? if so, how are the two related in a
pressure-doping phase diagram? The answer to such questions is
likely to advance significantly our
understanding of quantum criticality in heavy fermion systems.
In this paper we report susceptibility, specific heat and
resistivity measurements in Cd doped CeIn3. Cd substitution to In
is equivalent to hole doping, as opposed to electron doping with Sn,
which is known to induce a valence
transitionLawrence (1979). Cd doping in the related
CeMIn5 ( Co,Rh,Ir) has lead to unexpected
results, with a few percent Cd suppressing superconductivity in
favor of the AFM state in both CeCoIn5 and CeIrIn5, while the
in CeRhIn5 has a non-monotonic evolution with
dopingPham et al. (2006). Perhaps the most noteworthy aspect is that
the effect of Cd doping can be reversed by applying
pressurePham et al. (2006), even though the lattice volume change
due to Cd is minute. Also, NMR measurements in Cd doped CeCoIn5
suggest that Cd enhances AFM correlations locally among the
neighboring Ce ionsUrbano et al. (2007), and it remains a mystery
how such antiferromagnetic droplets can percolate at the level of a
few percent Cd introduced. These results have motivated us to
investigate the effect of Cd in CeIn3 and our main findings can
be summarized as follows: Cd monotonically suppresses , the
magnetic entropy at , as well as the paramagnetic electronic
specific heat coefficient () in CeIn3, without
changing the Curie-Weiss behavior of Ce. This suggests that the
valence of Ce is not affected by Cd, in the concentration range
investigated. These results, very similar to the effect of Sn at low
doping levels, mirrors the electron-hole symmetry in the system. The
second important result is that the AFM magnon contribution to the
heat capacity is not consistent with 3D magnon spectrum, a point
that has been missed in previous reports. The possibility of 2D spin
fluctuations makes it difficult to infer the type of quantum
critical point in pure as
well as Cd doped CeIn3 based on dimensional analysis.
The paper is organized in four parts: in the first two
sections we detail the crystal growth procedure and discuss the
doping and magnetic field phase diagrams; in the following sections
we present detailed analysis of resistivity and heat capacity
measurements.
II Crystal Growth and Characterization
| 0 | 0 | 3 | 4.690 | 10.2 | 56.5 | 2.66 |
| 0.05 | 0.0198 | 2.63 | 4.690 | 9.5 | 50 | 2.70 |
| 0.1 | 0.0221 | 2.64 | 4.688 | 9.08 | 56.4 | 2.63 |
| 0.1† | 0.0174 | 3 | – | 9.8 | – | – |
| 0.2 | 0.0295 | 2.62 | 4.687 | 8.15 | 52.8 | 2.63 |
| 0.2† | 0.0223 | 3 | – | 9.6 | – | – |
| 0.3 | 0.0501 | 2.63 | – | 7.1 | 50.3 | 2.66 |
| 0.4 | 0.0740 | 2.59 | 4.686 | 6.71 | 49.3 | 2.64 |
| 0.4† | 0.0199 | 3 | – | 9.15 | – | – |
| 0.5 | 0.121 | 2.59 | 4.691 | 6 | 56.5 | 2.66 |
| 0.5† | 0.0199 | 3 | – | 9 | – | – |
| 0.6 | 0.0810 | 2.47 | 4.690 | 6.45 | 57.9 | 2.73 |
| 0.6† | 0.0303 | 3 | – | 8.8 | – | – |
Single crystals of Ce(In1-xCdx)y were grown
out of In:Cd flux with a starting molar ratio of 1:20(1-x):20x
(Ce:In:Cd). Their characteristic parameters: composition, lattice
constant, and Curie-Weiss parameters are listed in
Table 1. Energy dispersive X-ray analysis (EDS) shows
that these samples are off-stoichiometric in Indium with
rather than 3. This corresponds to the surface (rather
than the bulk) composition and appears to be the result of etching
the samples in dilute HCl (in order to remove the excess In flux),
since we find the correct Ce:In ratio in the un-etched pure compound
grown on stoichiometry (1:3). From EDS, we determine the ratio of
the effective versus the nominal Cd concentration to be 1:10,
similar to the Cd doping of CeMIn5 (M=Co,Rh,Ir). We have been
unsuccessful in reaching Cd concentrations higher than effectively
. Since CeCd3 does not crystallize in the Cu3Au
structure, excessive Cd in the flux
leads to secondary phases such as CeCd11.
We have also attempted to grow more stoichiometric samples
for resistivity measurements in a two-step process where we first
pre-react Ce:Cd:In in desired proportions (solid state reaction at
1180 ∘C for 8 h in alumina crucible), followed by a second
round in the furnace with excess In flux (1:10) in the crucible
where we slowly cool (10 ∘C/h) from 1180 ∘C. The
resulting crystals have a ratio of Ce to (In+Cd) very close to 1:3
but are overall more dilute in Cd than the first set of crystals.
The EDS concentrations and (determined from ) for these
are also reported in
Table 1.
The Curie-Weiss parameters and the Neel temperatures
reported in Table 1 are determined from the magnetic
susceptibility (). Magnetization was measured at T from
K to K using a commercial vibrating sample SQUID
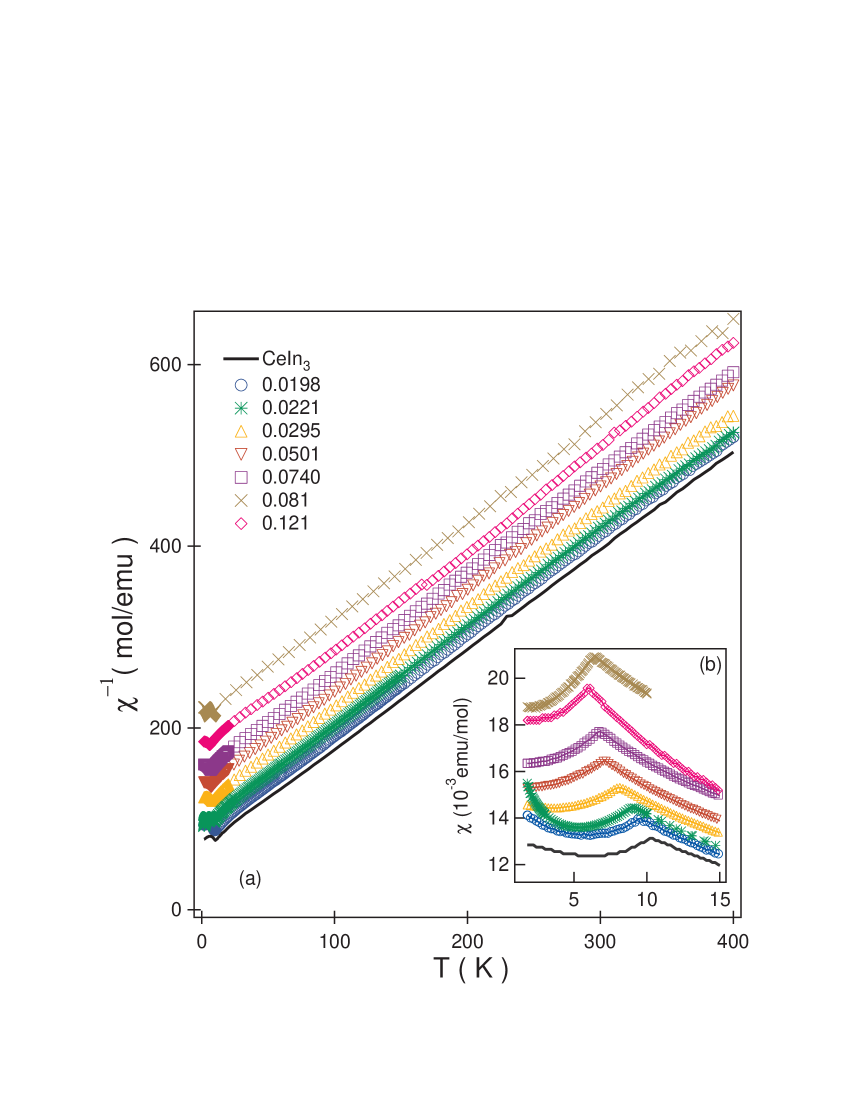
magnetometer (Quantum Design). The inverse susceptibility, shown in
Fig. 3a, is linear in temperature between K for
all dopings. The linear fits yield a Curie-Weiss moment (slope of
) close to the theoretical value for
Ce3+ () and an antiferromagnetic Curie-Weiss
temperature (T-axis intercept) K, similar to the
pure compound, with no systematic variation as a function of Cd
concentration. The antiferromagnetic transition at is marked
by a peak in the susceptibility, as seen in Fig. 3b, and
is monotonically suppressed with Cd doping, as listed in
Table 1 and also shown in figures 4a and 4b.
The monotonic decrease of with increasing Cd
concentration indicates that Cd effectively substitutes to In.
However, no systematic evolution of the lattice constant with
doping is observed (see Table 1). The lattice
constants have been determined from Rietveld refinement of
powder X-ray diffraction spectra, using Si as a standard. One would
expect the lattice to shrink with Cd, since Cd is smaller than In. A
systematic suppression of with Cd concentration was indeed
observed in Cd doped CeCoIn5Booth et al. (2009). In addition,
increases systematically with Sn in CeIn3, as expected, Sn being
larger than InLawrence (1979).
In principle, Cd dopants could capture an electron from the
conduction band, which would force the neighboring Ce3+ ion to
give its f electron in order to ensure electric neutrality locally,
thus becoming a non-magnetic Ce4+ ion. Since the concentration
and effective moment of Ce3+ ions in the PM state does not
change with Cd, this can be effectively ruled out. Thus the
Curie-Weiss analysis and the absence of change in the lattice
constant rule out any valence change of Ce induced by Cd, in the
doping range investigated. In comparison, it is known that with Sn
doping the Ce3+ ions undergo a valence change, with CeSn3
being in the (homogeneous) intermediate valence
regimeLawrence (1979). In this case, the Curie-Weiss
temperature shows a steep increase at the critical Sn concentration
where the lattice constant exhibits a kink, corresponding to the
intermediate valence regimeLawrence (1979).
Finally, the origin of the low temperature Curie tail in the
susceptibility, observed only at low concentrations, as seen in
Fig. 3b, is presently unknown and somewhat sample
dependent. A similar upturn is also present in Sn-doped
samplesPedrazzini et al. (2004). We have also observed such upturns
in some of the pure samples so it does not appear to be
doping induced.
III Phase diagram
The suppression of with Cd doping is surprising since
Cd enhances in the CeMIn5 and CeIn8
(Co,Rh,Ir) compounds Pham et al. (2006); Adriano
et al. (2009a, b). This difference may be due to the fact that in the
tetragonal compounds there are two In sites and Cd preferentially
substitutes to the in-plane InBooth et al. (2009). It is instructive
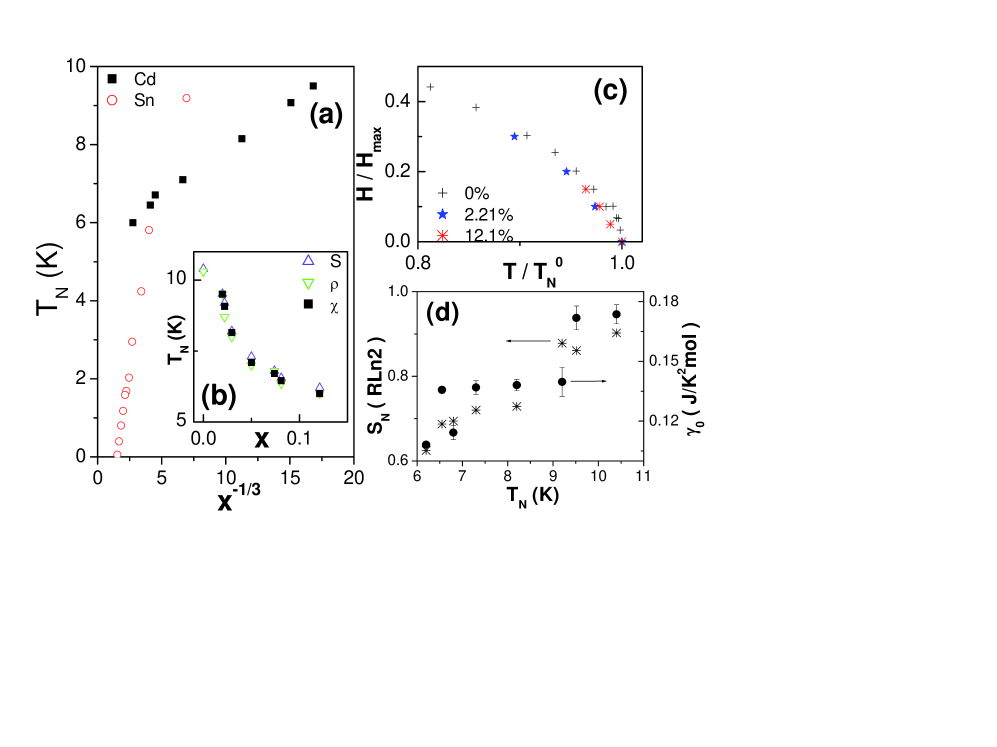
to compare the suppression of in Cd and Sn doped samples, as
shown in Fig. 4a. The values of for Sn doped samples
are from refPedrazzini et al. (2004). The values of in Cd
doped CeIn3, determined from the peak in susceptibility, or the
kink in the entropy and the resistivity, are in close agreement
with one and other, as shown in figure 4b. Moreover, the
consistency between the values for the two set of samples, In
deficient and stoichiometric, (see Table 1) show that
the surface depletion of In does not affect the bulk properties. For
both dopants, Sn and Cd, follows a dependence, as
shown in Fig. 4a, where corresponds to the
average distance between dopants. This suggests a similar mechanisms
for the suppression of the AFM order. The weaker slope for Cd in
Fig. 4a means a stronger suppression of as compared
to Sn. Nevertheless a doping induced QCP is unlikely in the case of
Cd since the x-axis intercept is negative. In the doping range
shown, neither Cd nor Sn changes the effective moment and
Curie-Weiss temperature of Ce at high temperatures, thus it is
likely that both Cd and Sn prevent their Ce neighbors from ordering
with respect to the local Weiss field below . In other words,
the AFM order is suppressed locally around the dopants rather
than a global reduction of the RKKY coupling of Ce local moments.
Figure 4c shows the normalized H-T phase diagram
of Cd doped CeIn3, the data for the pure CeIn3 is taken from
ref.Ebihara et al. (2004). The H-T phase diagram is
established from the heat capacity measurements at 0, 3 T, 6 T, 9 T
for and samples. We have verified that the
magnetic field suppression of is independent of x provided we
normalize by and by , where
is defined as the critical field for the AFM transition at zero
temperature (). The value of T is used
for pure CeIn3, consistently with
Ref.Ebihara et al. (2004). Then is adjusted for the
Cd doped samples to give the best overlap in the normalized phase
diagram. We find T and T for the
( K) and ( K) samples. The fact that
reducing by a factor of results in a suppression of
of the same rate suggests that the same effective moment
is involved in the Zeeman energy () for the Cd doped
sample as for the pure CeIn3.
Thus, the (effective) ordered moment per Ce within the AFM
state does not change with Cd, based on the H-T phase diagram. This
suggests that the CEF ground state does not change with Cd. One is
then lead to speculate that the number of Ce3+ ions
participating in the Neel order is decreasing with increasing Cd
concentration, possibly as a result of local disruption caused by
doping, as discussed above. However, this cannot solely explain the
suppression of the AFM state since it is hard to reconcile a local
scenario with a simultaneous decrease of the magnetic entropy at
(see below). The investigation of the magnetic fluctuations in
the vicinity of Cd in CeIn3 with NMR, of the local structure of
Ce by EXAFS as well as the investigation of possible changes in the
magnetic structure via neutron scattering
will likely shed more light on the mechanism of suppression of the AFM order with Cd.
IV Heat Capacity
IV.1 The magnetic entropy at
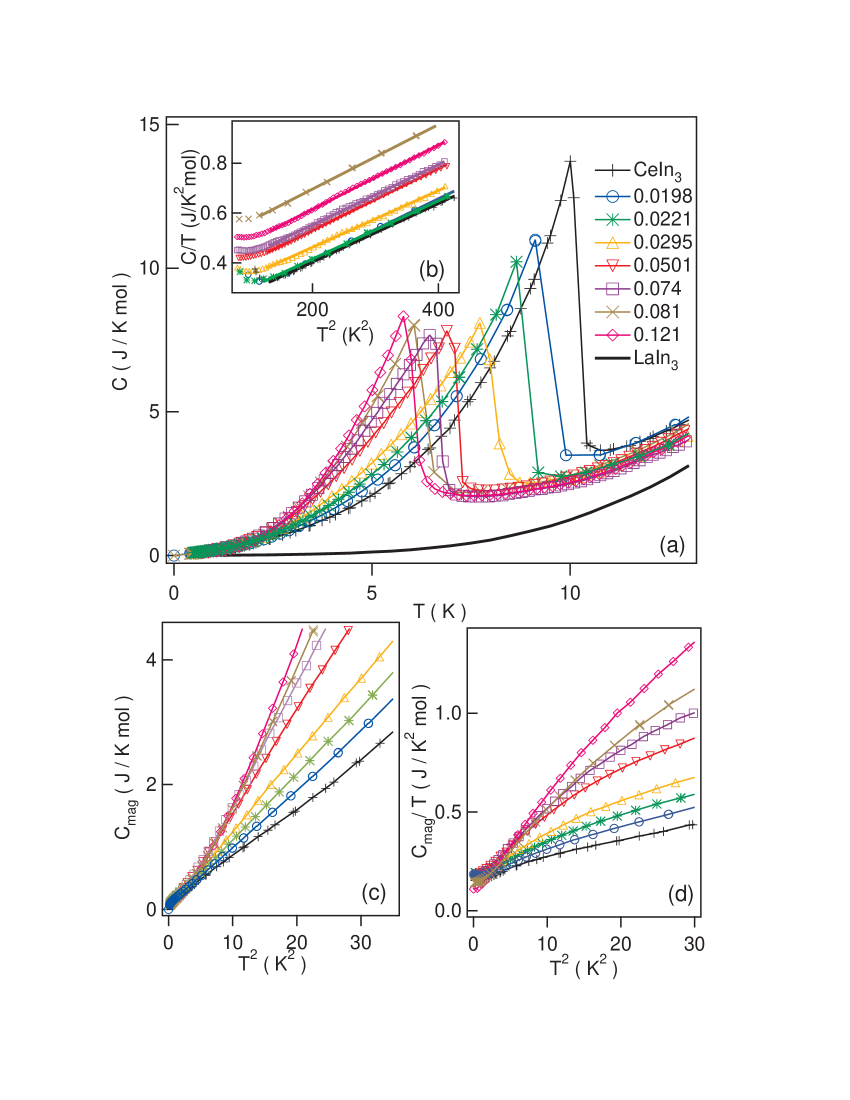
Figure 5a shows the temperature dependence of the total specific heat () down to K in single crystals of Ce(In1-xCdx)2.6 at zero magnetic field, for the indicated nominal concentrations. The non-magnetic analog, LaIn3 is also measured in order to estimate and subtract the lattice contribution (see fig 5a). The AFM transition is marked by a jump in , characteristic of a second order transition. The corresponding magnetic entropy is obtained by integrating the magnetic contribution to specific heat up to , and shown as a function of in Fig. 4d. decreases monotonically with doping.
The size of the specific heat jump is surprisingly non-monotonic as a function of Cd concentration: it first decreases from 0 to 2.23Cd and then increases from 2.23 to 12.1Cd. This may correspond to the AFM transition evolving from a second order to a weakly first order one, although the susceptibility anomaly nor the drop in the entropy at become discontinuous. Further investigations of the sublattice magnetization or the magneto-caloric effect are needed to address this issue.
The local suppression of the AFM around the Cd impurities, as suggested above, cannot alone be responsible for the observed entropy loss upon Cd doping. Rather, it may be due to a more effective Kondo screening prior to ordering: if decreases faster than , the magnetic entropy at the transition will be suppressed simply because of the quenching of Ce moments. We have determined the single-ion Kondo temperature of La0.95Ce0.05In3 doped with 10 nominal Cd (2 effective) from specific heat (not shown) and found that the magnetic entropy reaches at K, which corresponds to the same single-ion Kondo temperature as in pure CeIn3Knafo et al. (2003). Therefore Cd has very little effect on while it suppresses monotonically. The screening of the Ce moments for results in a lower entropy at .
IV.2 The electronic specific heat coefficient
The electronic specific heat coefficient in the PM state is obtained from linear fits to vs in the range K. The linearity of vs for all Cd concentrations, as seen in Fig. 5b, suggests that any additional contribution to heat capacity (from CEF excitations or AFM fluctuations) is negligible in this range. The slight increase in the slope of vs with increasing Cd concentration results in a suppression of the T=0 intercept, which defines . The error bars on comes from the choice of the temperature range used in fitting. Within the error bars, is suppressed with increasing Cd concentration, as shown in Fig. 4d.
The simultaneous suppression of the magnetic order and the heavy fermion state is at odds with the Doniach phase diagram, where a heavy paramagnetic state emerges beyond the critical point where the AFM state is suppressed. Since the is determined at temperatures nominally higher than , it may not properly reflect the mass renormalization occurring at the lowest temperatures (within the AFM state). Nevertheless the in the AFM state also appears to decrease with increased doping, as seen in Fig. 5d, so that our data effectively rules out any mass enhancement concomitant with the suppression of .
IV.3 AFM magnon contribution
Figure 5c and 5d show the magnetic part of
the specific heat, in the AFM state (), obtained by
subtracting the lattice contribution. At low temperatures,
antiferromagnetic magnon contribution is expected to follow a
law in 3DKittel (1963). This is because the AFM magnon dispersion is
to a good approximation linear in an intermediate temperature range
and the calculation of heat capacity follows by analogy with the
Debye model. The comparison of vs (Fig. 5c)
and vs (Fig. 5d) reveals that the
data are more consistent with a quadratic () behavior rather
than cubic (). In fact, the data collapse on a single curve at
low T for all Cd concentrations in Fig. 5c, whereas there
is no substantial T-range where is linear in
in Fig. 5d.
This unusual power law is clear evidence that the spin
fluctuations in pure as well as Cd doped CeIn3 are not 3D,
contrary to what is commonly assumed for this cubic
compoundKuchler et al. (2006). Given the ordering wavevector, one
possibility is that these are transverse spin fluctuations within
the [111] planes and the system is effectively quasi-two
dimensional. Future theoretical work, as well as a direct
investigation of magnon spectrum via inelastic neutron scattering is
strongly needed to address the origin of the
behavior of the heat capacity in the AFM state.
Two-dimensional fluctuations are not uncommon in the context
of local quantum criticality and they have been observed in
particular in CeCu5.9Au0.1 via inelastic neutron
scattering measurementsStockert et al. (1998). We have checked with
previously published dataPaschke et al. (1994) that the specific heat of
CeCu5Au in the AFM state is also quadratic in temperature up to
0.5 K, consistently with CeIn3. This gives further evidence that
in both systems the underlying physics involves 2D magnons. This
suggests that one can effectively analyze the specific heat in the
AFM state away from the QCP, to gain insight into the dimensionality
of the spin fluctuations in other quantum critical systems as well.
One immediate consequence of 2D spin fluctuations is that the sum of
the physical dimension () and the dynamical critical exponent
() is exactly 4, which is the upper critical dimension in the
context of spin fluctuation theoryHertz (1976); Millis (1993). In other
words, a wide fluctuation regime is possible in this system, so the
dimensional analysisColeman et al. (2001) alone is not
sufficient to distinguish between the SDW theory and the local QCP
scenario in this case. Then Cd doped CeIn3 is a potential
candidate for FS volume change across the (pressure induced) QCP,
just as the pure compound.
In summary, the main effect of Cd on the specific heat is:
(i) an entropy loss at the transition, (ii) a suppression of the
electronic specific heat coefficient in the PM state.
While the former can be understood in terms of an increased Kondo
screening, the latter appears to contradict the Doniach phase
diagram. Therefore it is unlikely that Cd doping itself tunes the
system towards a QCP. Nevertheless, it is a sensible assumption
that pressure will tune Ce(In,Cd)3 towards a QCP. Based on the anomalous
(quadratic) behavior of the magnon heat capacity, we speculate that the
magnetic fluctuations in this system are effectively 2D, which makes
it impractical to determine the type of QCP from dimensional analysis.
V Resistivity
V.1 Coherence temperature
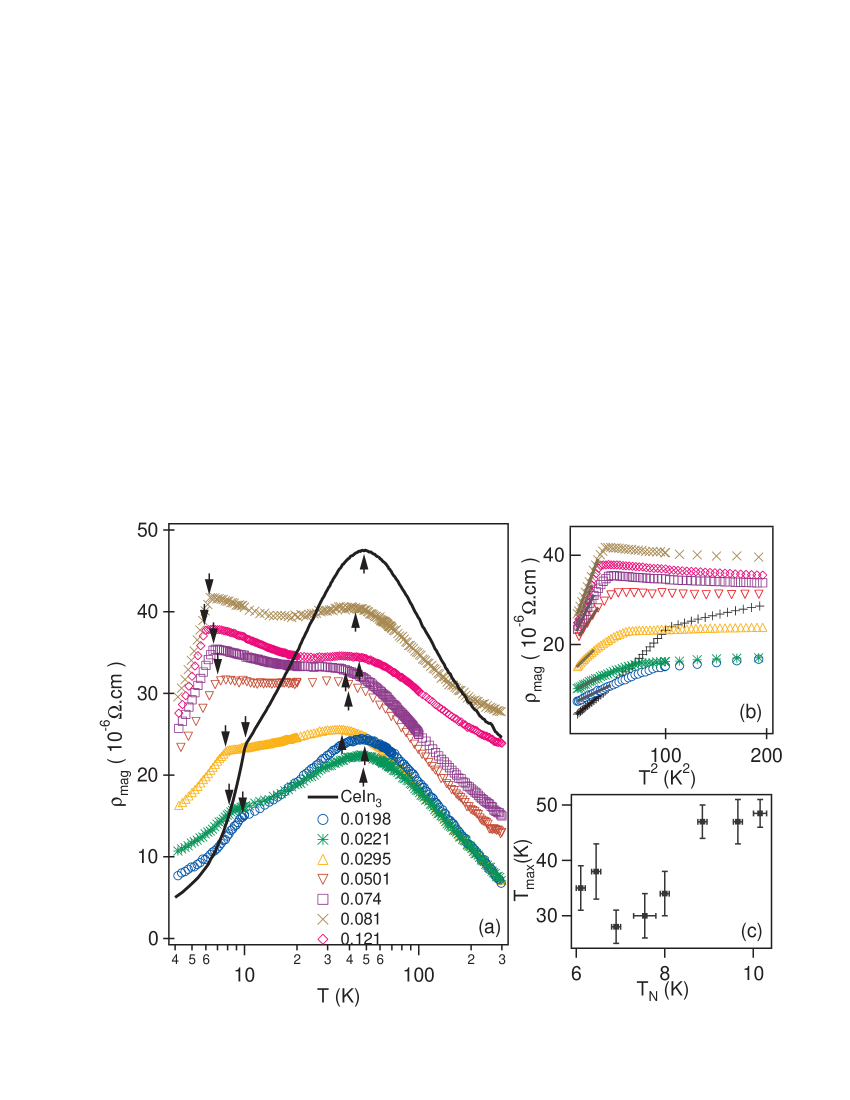
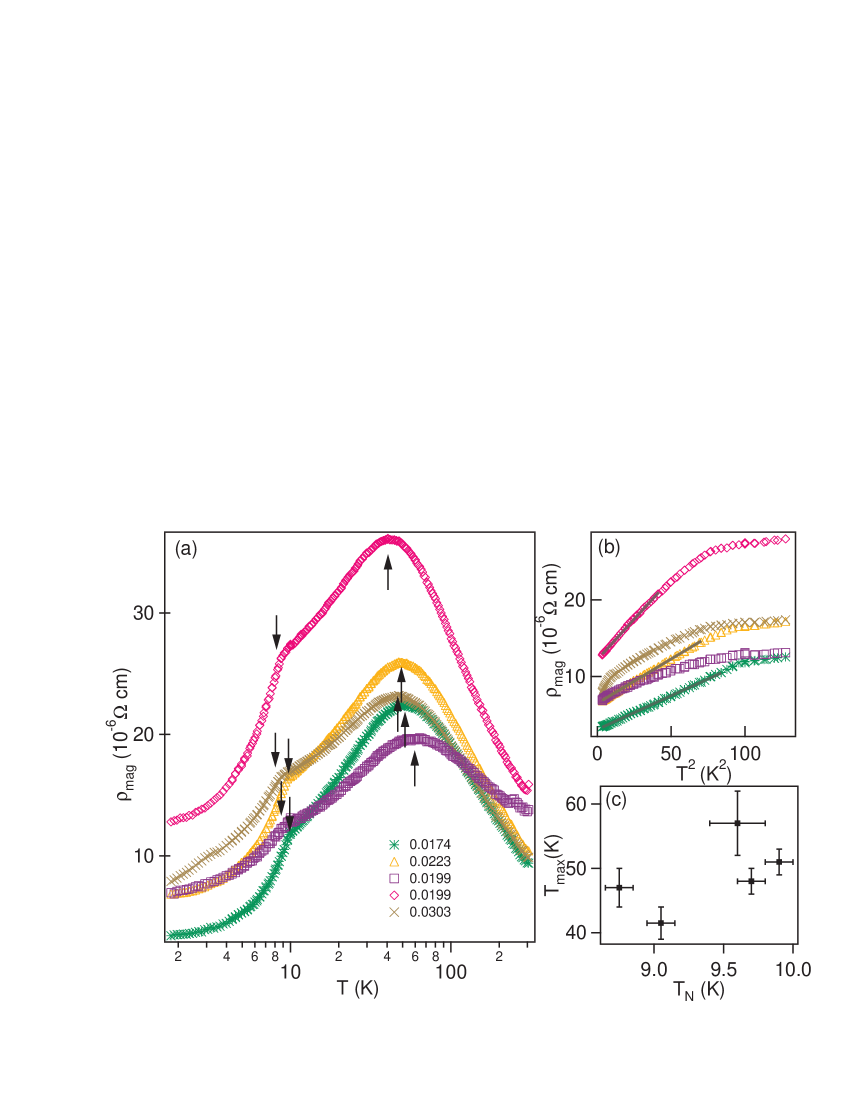
The temperature dependence of the magnetic part of the
resistivity is shown on a semi-log plot for the two sets of Cd doped
crystals, the In deficient and the stoichiometric ones, in
Fig. 6a and Fig. 7a respectively. The
resistivity was measured with the standard four-wire technique in
the range K, with Pt wires attached to the samples using
silver paint. A current of mA was applied. For the
stoichiometric samples (), a modest field of G was
applied in order to suppress the superconducting transition of free
In inclusions. The magnetic contribution is obtained by
subtracting the phonon contribution from the total resistivity,
assuming it is the same as
for the LaIn3 analog: .
The characteristic peak in is observed at K in pure CeIn3, consistent with previous reportsElenbaas et al. (1980); Knebel et al. (2001). It is also known that the peak in in pure CeIn3 is accompanied by a Schottky peak in the specific heat at around the same temperatureDiepen et al. (1971). This Schottky peak is associated with a CEF excitation of , also seen in inelastic neutron scatteringBoucherle et al. (1983); Lawrence and Shapiro (1980). is usually taken as a crossover (or coherence) temperature from single ion to dense Kondo regime in heavy fermionsLavagna et al. (1982). It also corresponds to the crossover from a Kondo effect involving the full degeneracy of the multiplet of the Ce3+ ion at high to a Kondo effect restricted to the crystal field ground state at low Cornut and Coqblin (1972). The emerging picture from these two approaches is that the Kondo lattice coherence among Ce’s is only achieved when the -electrons condense into their CEF ground state. This is also consistent with the view that the sets the scale of intersite coupling among Ce’s, a conclusion reached in the La dilution study of CeCoIn5Nakatsuji et al. (2002).
In the present case, is determined graphically for
all Cd concentrations from the broad peak observed in resistivity,
as shown by the arrows in Fig. 6a and 7a.
When plotted against , as done in Fig. 6c and
7c, one can see that tends to decrease with
decreasing , due to Cd doping. A similar suppression of
is observed in Sn-doped CeIn3Pedrazzini et al. (2004).
Note, however, that is enhanced with Sn doping in
CeCoIn5Bauer et al. (2006), highlighting the different response
of the tetragonal and cubic systems to the same dopant. The disorder
suppression of the Kondo coherence temperature in this and other
heavy fermion systems is
currently an open issue but it likely involves crystal field effects.
V.2 Resistivity upturn
The most striking change induced by Cd is a clear upturn in
for , as seen in
Fig. 6a in In-deficient samples,
Ce(In1-xCdx)2.6. The upturn becomes systematically more
pronounced with increasing Cd concentrations. Moreover, the
application of T magnetic field does not suppress the upturn
significantly (not shown). The stoichiometric compounds
(Fig. 7a) do not show any upturn, but this could be
simply because they are actually more dilute in Cd than their
In-deficient counterparts. Thus, In deficiency alone does not appear
to be the spurious cause of the upturn. A similar upturn is also
reported in La-doped CeIn3Elenbaas et al. (1980) as well as in
other heavy fermion systems such as Ga doped
CeAl2Takeuchi and da Cunha (1995). In the latter, it has been
associated with a second Kondo scale. To the best of our knowledge,
such an upturn is not found in Sn doped CeIn3, nor in any Cd
doped CeMIn5 (Co,Rh,Ir). Given the observed
trends, and given the absence of the upturn in the pure compound, it
is unlikely associated with a lower Kondo scale in Cd doped
CeIn3. We are thus compelled to interpret it as a disorder effect
associated with
Cd doping.
V.3 Spin-disorder scattering
The onset of the antiferromagnetic transition at is marked by a pronounced drop in in all Cd doped samples (see arrows in Fig. 6a and 7a), corresponding to the suppression of spin-disorder scattering. In most rare-earth intermetallics exhibiting AFM ordering, the spin-disorder scattering in , as well as the ordering temperature , are proportional to the so-called DeGennes factor , since both depend on the exchange coupling strengthJensen and Mackintosh (1991). Moreover, the derivative of , is known to mimic the jump in the specific heat in a magnetic transitionFisher and Langer (1968), and this is indeed the case in CeIn3Knebel et al. (2001).
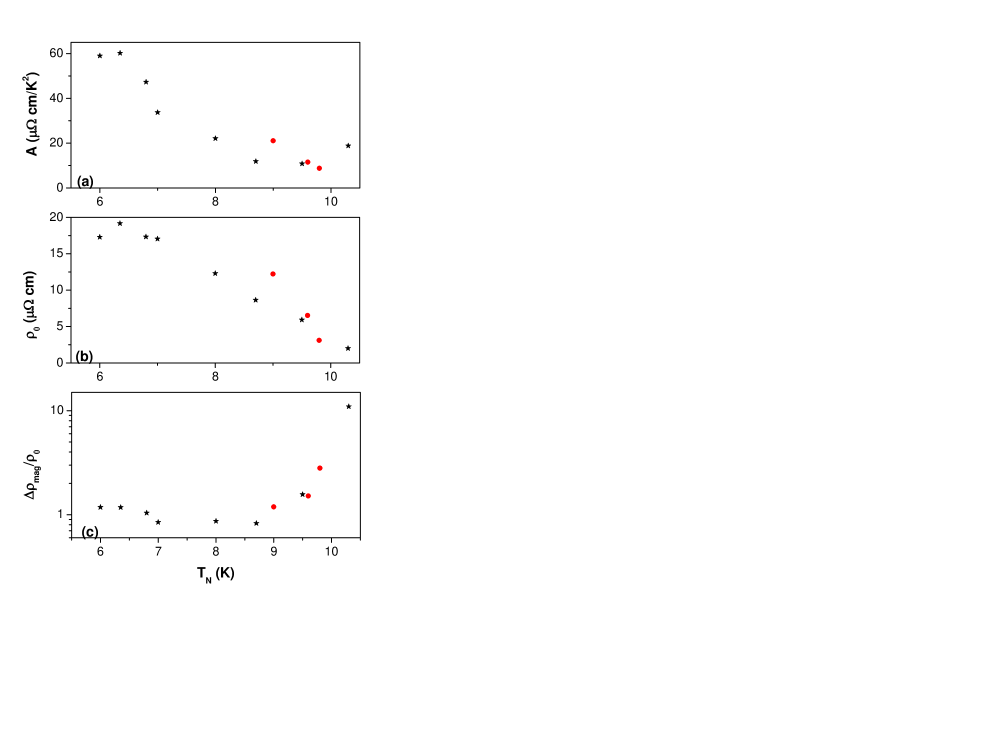
In the present compounds, we found a non-monotonic evolution
with Cd of the relative change in across , namely
the ratio . This ratio is defined
as , with the value of
at , and with , the residual resistivity,
obtained from the quadratic fits (see below). As shown in the
semi-log plot of Fig. 8c,
steeply decreases upon doping,
with decreasing , then saturates and slightly increases at
higher Cd concentrations. The latter might be a consequence of the
upturn in reported above. The initial sharp drop of
reflects the decreasing magnetic
entropy upon doping, as expected from . This is also consistent with the pressure
resultsKnebel et al. (2001), where
the resistivity anomaly is suppressed together with .
V.4 Fermi Liquid analysis
The temperature dependence of below is quadratic in the pure as well as in most of the Cd doped CeIn3 samples, as shown in Fig. 6b and 7b. The notable exceptions are the nominal 40 and 60 stoichiometric samples, which exhibit a pronounced negative curvature. The quadratic behavior of is consistent with a Fermi Liquid regime extending up to , also in agreement with previous reportsKnebel et al. (2001).
The observation of a resistivity on a wide T-range within the magnetically ordered state is unusual and implies a negligible electron-magnon scattering, as compared to the electron-electron scattering. The quadratic fits to in both the In-deficient and stoichiometric samples, yield a Fermi Liquid coefficient and residual resistivity , both of which are shown as a function of on Fig. 8a and 8b. The systematic increase in with decreasing (increasing Cd doping) is simply the expected impurity scattering from Cd. The corresponding increase in the coefficient would in principle correspond to a mass enhancement.
At first, this is surprising since the Sommerfeld
coefficient both in the PM and the AFM states decreases
with increasing Cd concentration. In most heavy fermions, as first
noted by Kadowaki and WoodsKadowaki and Woods (1986), the
coefficient of resistivity scales with the electronic specific heat
coefficient. Therefore the thermodynamic results cast doubts on the
validity of the interpretation of the quadratic behavior of
resistivity in the AFM state in terms of Fermi Liquid behavior and
of the evolution of the coefficient with doping in terms of mass enhancement in Ce(In,Cd)3.
In summary, the effect of Cd on the resistivity is complex. The suppression of the coherence temperature and the increase in the residual resistivity appear to be disorder related. The smaller spin-disorder scattering with increasing Cd concentration can be attributed to the loss of magnetic entropy at the transition. There is an unusual upturn induced by Cd, whose origin remains to be elucidated. The quadratic behavior of resistivity in the AFM state may be analyzed in terms of Fermi liquid behavior, as was previously done in pure CeIn3, however the enhancement of the coefficient is at odds with the simultaneous suppression of with increasing Cd concentrations.
VI Conclusion
In conclusion, susceptibility and resistivity measurements
in Ce(In1-xCdx)3 consistently show that the
Cd-suppression of the AFM state is not accompanied by any change of
the Ce local moments, suggesting that Cd locally disrupts the long
range order. The Sommerfeld coefficient is systematically and
significantly suppressed in the PM state, suggesting a Cd induced
suppression of the effective mass of carriers. The simultaneous
suppression of the magnetic order and the heavy fermion state is at
odds with the Doniach phase diagram and suggests that Cd tunes the
system away from the QCP. The most striking effect of Cd in the PM
state is the upturn seen in the resistivity, whose origin is
currently unknown. In the AFM state, the Fermi liquid coefficient,
determined from the resistivity, increases systematically with
increasing Cd, which would in principle imply a mass enhancement.
However, the concomitant increase in the residual resistivity as
well as the presence of magnon scattering makes this interpretation
dubious. Moreover, we found that the magnetic contribution to the
specific heat has a behavior in the AFM state, inconsistent
with 3D magnons. The reduced dimension for magnetic excitations,
which is the likely origin of this quadratic behavior, have been
missed in previous studies, and makes it difficult to assess the
type of quantum criticality
observed in this system based on dimensional analysis.
Acknowledgements.
Z.F. acknowledges support through NSF Grant No. NSF-DMR-0503361. E.M.B. and P.G.P. acknowledge support through CNPq (grant No. 200563/2008-4) and FAPESP (grant No. 2006/55347-1).References
- (1)
- Buschow et al. (1969) K. H. J. Buschow, H. W. de Wijn, and A. M. van Diepen, The Journal of Chemical Physics 50, 137 (1969).
- Pagliuso et al. (2001) P. G. Pagliuso, J. D. Thompson, M. F. Hundley, J. L. Sarrao, and Z. Fisk, Phys. Rev. B 63, 054426 (2001).
- Mathur et al. (1998) N. D. Mathur, F. M. Grosche, S. R. Julian, I. R. Walker, D. M. Freye, R. K. W. Haselwimmer, and G. G. Lonzarich, Nature 394, 39 (1998).
- Knebel et al. (2001) G. Knebel, D. Braithwaite, P. C. Canfield, G. Lapertot, and J. Flouquet, Phys. Rev. B 65, 024425 (2001).
- Kawasaki et al. (2008) S. Kawasaki, M. Yashima, Y. Kitaoka, K. Takeda, K. Shimizu, Y. Oishi, M. Takata, T. C. Kobayashi, H. Harima, S. Araki, et al., Physical Review B 77, 064508 (2008).
- Monthoux et al. (2007) P. Monthoux, D. Pines, and G. G. Lonzarich, Nature 450, 1177 (2007).
- Buschow (1979) K. H. J. Buschow, Rep. Prog. Phys. 42 (1979).
- Lawrence and Shapiro (1980) J. M. Lawrence and S. M. Shapiro, Phys. Rev. B 22, 4379 (1980).
- Knafo et al. (2003) W. Knafo, S. Raymond, B. Fak, G. Lapertot, P. C. Canfield, and J. Flouquet, J. Phys. Condens. Matter 15, 3741 (2003).
- Boucherle et al. (1983) J. Boucherle, J. Flouquet, Y. Lassailly, J. Palleau, and J. Schweizer, Journal of Magnetism and Magnetic Materials 31-34, 409 (1983).
- Allen et al. (1981) J. W. Allen, S. J. Oh, I. Lindau, J. M. Lawrence, L. I. Johansson, and S. B. Hagström, Phys. Rev. Lett. 46, 1100 (1981).
- Kim et al. (1997) H.-D. Kim, O. Tjernberg, G. Chiaia, H. Kumigashira, T. Takahashi, L. Duò, O. Sakai, M. Kasaya, and I. Lindau, Phys. Rev. B 56, 1620 (1997).
- Coleman et al. (2001) P. Coleman, C. Pepin, Q. Si, and R. Ramazashvili, Journal of Physics: Condensed Matter 13, R723 (2001).
- Ebihara et al. (2004) T. Ebihara, N. Harrison, M. Jaime, S. Uji, and J. C. Lashley, Phys. Rev. Lett. 93, 246401 (2004).
- Gor’kov and Grigoriev (2006) L. P. Gor’kov and P. D. Grigoriev, Physical Review B 73, 060401(R) (2006).
- Biasini et al. (2003) M. Biasini, G. Ferro, and A. Czopnik, Phys. Rev. B 68, 094513 (2003).
- Sebastian et al. (2009) S. E. Sebastian, N. Harrison, C. D. Batista, S. A. Trugman, V. Fanelli, M. Jaime, T. P. Murphy, E. C. Palm, H. Harima, and T. Ebihara, arXiv:0902.4108v2 (2009).
- Harrison et al. (2007) N. Harrison, S. E. Sebastian, C. H. Mielke, A. Paris, M. J. Gordon, C. A. Swenson, D. G. Rickel, M. D. Pacheco, P. F. Ruminer, J. B. Schillig, et al., Physical Review Letters 99, 056401 (2007).
- Settai et al. (2006) R. Settai, T. Kubo, T. Matsuda, Y. Haga, Y. Onuki, and H. Harima, Physica B: Condensed Matter 378-380, 417 (2006).
- Endo et al. (2004) M. Endo, N. Kimura, H. Aoki, T. Terashima, S. Uji, T. Matsumoto, and T. Ebihara, Phys. Rev. Lett. 93, 247003 (2004).
- Settai et al. (2005) R. Settai, T. Kubo, T. Shiromoto, D. Honda, H. Shishido, K. Sugiyama, Y. Haga, T. D. Matsuda, K. Betsuyaku, H. Harima, et al., Journal of the Physical Society of Japan 74, 3016 (2005).
- Schroder et al. (2000) A. Schroder, G. Aeppli, R. Coldea, M. Adams, O. Stockert, H. Lohneysen, E. Bucher, R. Ramazashvili, and P. Coleman, Nature 407, 351 (2000).
- Gegenwart et al. (2002) P. Gegenwart, J. Custers, C. Geibel, K. Neumaier, T. Tayama, K. Tenya, O. Trovarelli, and F. Steglich, Phys. Rev. Lett. 89, 056402 (2002).
- Hertz (1976) J. A. Hertz, Phys. Rev. B 14, 1165 (1976).
- Millis (1993) A. J. Millis, Phys. Rev. B 48, 7183 (1993).
- Rus et al. (2005) T. Rus, H. Wilhelm, O. Stockert, T. L hmann, N. Caroca-Canales, J. Sereni, C. Geibel, and F. Steglich, Physica B: Condensed Matter 359-361, 62 (2005).
- Pedrazzini et al. (2004) P. Pedrazzini, M. G. Berisso, N. Caroca-Canales, M. Deppe, C. Geibel, and J. G. Sereni, European Physical Journal B 38, 445 (2004).
- Kuchler et al. (2006) R. Kuchler, P. Gegenwart, J. Custers, O. Stockert, N. Caroca-Canales, C. Geibel, J. G. Sereni, and F. Steglich, Physical Review Letters 96, 256403 (2006).
- Silhanek et al. (2006) A. V. Silhanek, T. Ebihara, N. Harrison, M. Jaime, K. Tezuka, V. Fanelli, and C. D. Batista, Physical Review Letters 96, 206401 (2006).
- Lawrence (1979) J. Lawrence, Phys. Rev. B 20, 3770 (1979).
- Pham et al. (2006) L. D. Pham, T. Park, S. Maquilon, J. D. Thompson, and Z. Fisk, Physical Review Letters 97, 056404 (2006).
- Urbano et al. (2007) R. R. Urbano, B.-L. Young, N. J. Curro, J. D. Thompson, L. D. Pham, and Z. Fisk, Physical Review Letters 99, 146402 (2007).
- Booth et al. (2009) C. H. Booth, E. D. Bauer, A. D. Bianchi, F. Ronning, J. D. Thompson, J. L. Sarrao, J. Y. Cho, J. Y. Chan, C. Capan, and Z. Fisk, Physical Review B 79, 144519 (2009).
- Adriano et al. (2009a) C. Adriano, C. Giles, L. Mendonca-Ferreira, F. de Bergevin, C. Mazzoli, L. Paolasini, Z. Fisk, and P. G. Pagliuso, Physica B 404, 3014 (2009a).
- Adriano et al. (2009b) C. Adriano, C. Giles, E. M. Bittar, L. N. Coelho, F. de Bergevin, C. Mazzoli, L. Paolasini, W. Ratcliff, R. Bindel, J. W. Lynn, et al., arXiv.org:0912.4467 (2009b).
- Kittel (1963) C. Kittel, Quantum theory of solids, John Wiley and Sons (1963).
- Stockert et al. (1998) O. Stockert, H. v. Lohneysen, A. Rosch, N. Pyka, and M. Loewenhaupt, Phys. Rev. Lett. 80, 5627 (1998).
- Paschke et al. (1994) C. Paschke, C. Speck, G. Portisch,and H. v. Lohneysen, J. Low Temp. Physics 97, 229 (1994).
- Elenbaas et al. (1980) R. Elenbaas, C. Schinkel, and C. van Deudekom, Journal of Magnetism and Magnetic Materials 15-18, 979 (1980).
- Diepen et al. (1971) A. V. Diepen, R. Craig, and W. Wallage, Journal of Physics and Chemistry of Solids 32, 1867 (1971).
- Lavagna et al. (1982) M. Lavagna, C. Lacroix, and M. Cyrot, Journal of Physics F: Metal Physics 12, 745 (1982).
- Cornut and Coqblin (1972) B. Cornut and B. Coqblin, Phys. Rev. B 5, 4541 (1972).
- Nakatsuji et al. (2002) S. Nakatsuji, S. Yeo, L. Balicas, Z. Fisk, P. Schlottmann, P. G. Pagliuso, N. O. Moreno, J. L. Sarrao, and J. D. Thompson, Phys. Rev. Lett. 89, 106402 (2002).
- Bauer et al. (2006) E. D. Bauer, F. Ronning, C. Capan, M. J. Graf, D. Vandervelde, H. Q. Yuan, M. B. Salamon, D. J. Mixson, N. O. Moreno, S. R. Brown, et al., Physical Review B (Condensed Matter and Materials Physics) 73, 245109 (2006).
- Takeuchi and da Cunha (1995) A. Y. Takeuchi and S. F. da Cunha, Journal of Alloys and Compounds 226, 126 (1995).
- Jensen and Mackintosh (1991) J. Jensen and A. R. Mackintosh, Rare Earth Magnetism: Structure and Excitations, Clarendon Press, Oxford (1991).
- Fisher and Langer (1968) M. E. Fisher and J. S. Langer, Phys. Rev. Lett. 20 (1968).
- Kadowaki and Woods (1986) K. Kadowaki and S. B. Woods, Solid State Communications 58, 507 (1986).