STRENGTHENING THE CASE FOR ASTEROIDAL ACCRETION:
EVIDENCE FOR SUBTLE AND DIVERSE DISKS AT WHITE DWARFS
Abstract
Spitzer Space Telescope IRAC m and AKARI IRC m photometry are reported for ten white dwarfs with photospheric heavy elements; nine relatively cool stars with photospheric calcium, and one hotter star with a peculiar high carbon abundance. A substantial infrared excess is detected at HE 22211630, while modest excess emissions are identified at HE 01063253 and HE 03070746, implying these latter two stars have relatively narrow () rings of circumstellar dust. A likely 7.9 m excess is found at PG 1225079 and may represent, together with G166-58, a sub-class of dust ring with a large inner hole. The existence of attenuated disks at white dwarfs substantiates the connection between their photospheric heavy elements and the accretion of disrupted minor planets, indicating many polluted white dwarfs may harbor orbiting dust, even those lacking an obvious infrared excess.
Subject headings:
circumstellar matter— minor planets, asteroids— planetary systems – stars: abundances— white dwarfs1. INTRODUCTION
The large-scale composition of extrasolar minor planets can be indirectly measured using white dwarfs as astrophysical detectors (Jura et al., 2009b; Zuckerman et al., 2007). Rings of warm dust (and in some cases gaseous debris) revealed at over one dozen white dwarfs (Farihi et al., 2009) are situated within the Roche limits (Gänsicke et al., 2006) of their respective stellar hosts, and likely originated via the tidal disruption of minor (or possibly major) planets (Jura, 2003). These closely orbiting disks rain metals onto the stellar photosphere, and contaminate an otherwise pristine hydrogen or helium atmospheric composition. For any particular cool white dwarf, the timescales for individual heavy elements to sink below the high gravity photosphere differ by less than a factor of three, yet are always orders of magnitude shorter than the cooling age (Koester, 2009a). With an appropriate treatment of the accretion history, photospheric heavy element abundances can be used as a measure of the composition of the tidally destroyed, polluting parent body or bodies (Klein et al., 2010; Jura, 2008).
The spectacularly debris-polluted white dwarf GD 362 is an excellent example of this potential. Its circumstellar disk re-emits at least 3% of the incident stellar radiation; one-third of this is carried by a strong m silicate emission feature (Jura et al., 2007b). The star itself is polluted by at least 15 elements heavier than hydrogen and helium, in an arrangement that is rich in refractory elements and deficient in volatiles; a pattern that broadly mimics the inner Solar system, and comparable with the outer composition of the Earth and Moon (Zuckerman et al., 2007). A recent analysis of the unusual atmospheric mix of hydrogen and helium, together with X-ray constraints on the current hydrogen accretion rate at GD 362, suggests that if a single parent body gave rise to both the currently observed disk and the panoply of heavy elements in its atmosphere, then its mass would be larger than Callisto, and possibly larger than Mars (Jura et al., 2009b).
Observations of a large number and variety of metal-polluted white dwarfs are necessary to better understand and constrain the connection between rocky extrasolar parent bodies, the circumstellar dust and gas, and the subsequent photospheric pollutions they create in white dwarfs (Zuckerman et al., 2003). The lifetimes of the disks at white dwarfs are poorly constrained at present, though there is some indication their lifetimes do not significantly exceed yr (Farihi et al., 2009; Kilic et al., 2008). Another outstanding issue is the nature of the large metal abundances in stars lacking excess infrared emission; tenuous, gaseous, or previously-accreted disks are strong possibilities. While the evolution of optically thick dust at white dwarfs should be dominated by viscous dissipation-spreading, to date only G166-58 stands out as a possible indicator of how competing mechanisms, such as additional impacts or gas drag at the inner disk edge, may play a role (Jura, 2008; Farihi et al., 2008).
Spitzer IRAC and AKARI IRC photometric imaging observations are presented for nine metal-polluted white dwarfs chosen for their high calcium abundances and relatively short cooling ages. The observations are presented in §2, the results in §3, and the implications for the minor planet accretion hypothesis and future dust searches are discussed in §4.
| WD | Name | SpT | [Ca/H(e)] | Telescope | Refs | |
|---|---|---|---|---|---|---|
| (mag) | ||||||
| 0047190aaThe WD numbers for these stars are unofficial designations, but correctly reflect
the conventional use of epoch B1950 coordinates. Abundances are expressed as [X/Y] = .
|
HS 00471903 | DAZ | 16.1 | Spitzer | 1 | |
| 0106328aaThe WD numbers for these stars are unofficial designations, but correctly reflect
the conventional use of epoch B1950 coordinates. Abundances are expressed as [X/Y] = .
|
HE 01063253 | DAZ | 15.5 | Spitzer | 1 | |
| 0307077aaThe WD numbers for these stars are unofficial designations, but correctly reflect
the conventional use of epoch B1950 coordinates. Abundances are expressed as [X/Y] = .
|
HS 03070746 | DAZ | 16.4 | Spitzer | 1 | |
| 0842231aaThe WD numbers for these stars are unofficial designations, but correctly reflect
the conventional use of epoch B1950 coordinates. Abundances are expressed as [X/Y] = .
|
Ton 345 | DBZ | 15.9 | AKARI | 2 | |
| 1011570 | GD 303 | DBZ | 14.6 | Spitzer / AKARI | 3 | |
| 1225079 | PG | DZAB | 14.8 | Spitzer | 3,4 | |
| 1542182 | GD 190 | DBQ | 14.7 | Spitzer | 5 | |
| 1709230 | GD 205 | DBAZ | 14.9 | Spitzer / AKARI | 4,6 | |
| 2221165aaThe WD numbers for these stars are unofficial designations, but correctly reflect
the conventional use of epoch B1950 coordinates. Abundances are expressed as [X/Y] = .
|
HE 22211630 | DAZ | 16.1 | Spitzer | 1 | |
| 2229235aaThe WD numbers for these stars are unofficial designations, but correctly reflect
the conventional use of epoch B1950 coordinates. Abundances are expressed as [X/Y] = .
|
HS 22292335 | DAZ | 15.9 | Spitzer | 1 |
2. OBSERVATIONS AND DATA
The target sample of stars was chosen based on the prior result that nine of 14 white dwarfs with inferred metal accretion rates above g s-1 and cooling ages less than 1.0 Gyr have infrared excess (Farihi et al., 2009). All nine metal-contaminated white dwarfs in Table 1 satisfy this criteria; five DAZ stars with high rates of ongoing metal accretion, plus three DBZ stars with high calcium abundances. Table 2 lists the relevant parameters for the DAZ and DBZ stars. Also included as a target is the 22 000 K DBQ white dwarf GD 190, with an anomalous atmospheric carbon abundance (Petitclerc et al., 2005). Ton 345 was included based on the presence of circumstellar, gaseous metal emission (Gänsicke et al., 2008).

2.1. Spitzer IRAC Observations
Mid-infrared imaging observations of the white dwarf targets were obtained with the Spitzer Space Telescope (Werner et al., 2004) during Cycle 5 using the Infrared Array Camera (IRAC; Fazio et al. 2004) at all four wavelengths, namely 3.6, 4.5, 5.7, and 7.9 m. The total integration time in each channel was 600 s, where the observations consisted of 20 frames taken in the cycling (medium) dither pattern with 30 s individual exposures. All images were analyzed, including photometry and upper limits, as in Farihi et al. (2009) using both and pixel-1 mosaics created using MOPEX.
In cases where the flux of a neighboring source was a potential contaminant of the white dwarf photometry, steps were taken to minimize or remove any such external contributions, including small aperture radii and point-spread function (PSF) fitting with daophot. To this end, the newly available (beginning with pipeline version S18.5) pixel-1 mosaics were useful to better constrain and eliminate sources of photometric confusion. While the IRAC Data Handbook (Spitzer Science Center, 2006) provides information necessary to perform photometry on point sources in the native pixel-1 scale images, the provided aperture corrections do not take advantage of the available smaller pixel scale. A comparison of identical observation sets, processed into both and pixel-1 mosaics, reveals a modest but clear increase (around 20% by full width at half maximum) in spatial resolution. This information gain at the smaller pixel scale is most evident at the two shortest wavelengths channels, where the diffraction limited PSF of the telescope is significantly under-sampled (Spitzer Science Center, 2006).
| WD | ||||
|---|---|---|---|---|
| (Jy) | (Jy) | (Jy) | (Jy) | |
| 0047190 | ||||
| 0106328 | ||||
| 0307077 | ||||
| 1011570 | ||||
| 1225079 | ||||
| 1542182 | ||||
| 1709230 | ||||
| 2221165 | ||||
| 2229235 | 18aa upper limit. |
2.2. AKARI IRC Observations
Observations with AKARI (Murakami et al., 2007) were executed using the Infrared Camera (IRC; Onaka et al. 2007) in the N2, N3 and N4 filters (2.34, 3.19, and 4.33 m) for three white dwarfs listed in Table 1. These stars were imaged in 2008 November and 2009 March-April using the Astronomical Observational Template IRCZ3, which was designed for imaging with the N2, N3, and N4 filters in a pointed observation. The basic data reduction, including dark subtraction, linearity correction, distortion correction, flat fielding, image stacking, and absolute position determination were performed by the standard IRC Imaging Data Reduction Pipeline for Phase 3 data (version 080924P3). The IRAF package daophot was used for photometry, with an aperture radius of 5 pixels () and corrected to the standard 10 pixel radius using aperture corrections derived from bright sources within individual images. Flux calibration was achieved using conversion factors provided by the IRC team111http://www.ir.isas.jaxa.jp/ASTRO-F/Observation/DataReduction/IRC/ConversionFactor__090824.html.
| WD | |||
|---|---|---|---|
| (Jy) | (Jy) | (Jy) | |
| 0842231 | |||
| 1011570 | |||
| 1709230 |
3. ANALYSIS AND RESULTS
Tables 2–3 list the flux determinations and established upper limits for the science targets. Figures 16 plot the measured mid-infrared fluxes together with available near-infrared and optical data (Abazajian et al., 2009; Farihi, 2009; Skrutskie et al., 2006; Martin et al., 2005; McCook & Sion, 2008; Landolt & Uomoto, 2007; Kilic et al., 2006; Copenhagen University Observatory, 2006; Space Telescope Science Institute, 2006; Zacharias et al., 2005; DENIS Consortium, 2005; Monet et al., 2003). For a few of the metal-rich target stars, Kilic et al. (2006) has published spectroscopically derived and colors, such that the - and -band fluxes of these stars are anchored to the 2MASS -band flux, and hinge upon its accuracy. IRTF photometry of HE 01063252 and PG 1225079 are taken from Farihi (2009). Where available, Galaxy Evolution Explorer (GALEX; Martin et al. 2005) far- and near-ultraviolet photometric fluxes are plotted to assist in establishing the appropriate brightness level of the white dwarf. However, because the interstellar extinction to these stars is not known, the GALEX fluxes were used with some caution.

Five of the target white dwarfs come from the Hamburg Schmidt (HS; Hagen et al. 1995) and the Hamburg ESO Schmidt (HE; Wisotzki et al. 1996) quasar surveys. The coordinates in SIMBAD for these five white dwarfs have poor precision, and are often missing from the white dwarf catalog McCook & Sion (1999, 2008). The correct positions for these white dwarfs were provided by the SPY team (R. Napiwotzki 2007, private communication), and their coordinates in the IRAC images are given in Table 4. The HE and HS white dwarfs tend to suffer from a lack of accurate ground-based photometry in the literature. A typical star has entries in a few photographic catalogs (30% errors), variable quality -band CCD photometry from the Carlsberg Meridian Catalog (CMC; Copenhagen University Observatory 2006), and a DENIS -band measurement if in the southern hemisphere. For HS 00470093, HS 03070746, HE 22211630, and HS 22292335, the only near-infrared photometry is the 2MASS -band value, as the - and -band data are substantially less reliable owing to the faintness of these stars (Skrutskie et al., 2006).
| Star | ||
|---|---|---|
| HS 00471903 | ||
| HE 01063253 | ||
| HS 03070746 | ||
| HE 22211630 | ||
| HS 22292335 |
Note. — As measured on the IRAC array based on image header astrometry; the epochs all correspond to Cycle 5 dates between 2008.9 and 2009.3 (equinox 2000).
All available photometric data for each white dwarf were fitted by a pure hydrogen or pure helium white dwarf model with and effective temperature to the nearest 500 K (Koester, 2009b). Because the surface gravity and the atmospheric composition are fixed, and because the effective temperature resolution is limited, the models shown in the figures do not necessarily describe accurately or strongly constrain the effective temperature of the stars. Rather, the atmospheric model fits predict the expected level of mid-infrared photospheric emission, and thereby constrain the presence or absence of infrared excess (Farihi, 2009). Relative to the Spitzer data, the AKARI images were found to be shallow, with patchy sky background, and highly asymmetric stellar images. For this reason, it is likely the errors used here are underestimated, and these data were given little weight in the final analysis.
3.1. Stars With Infrared Excess
| Method22Methods: a) PSF fitting of both white dwarf and neighboring source; b) PSF fitting of white dwarf only; c) Relative aperture photometry at using nearby star (§3.1). | ||||
|---|---|---|---|---|
| (Jy) | (Jy) | (Jy) | (Jy) | |
| a | ||||
| b | ||||
| c |
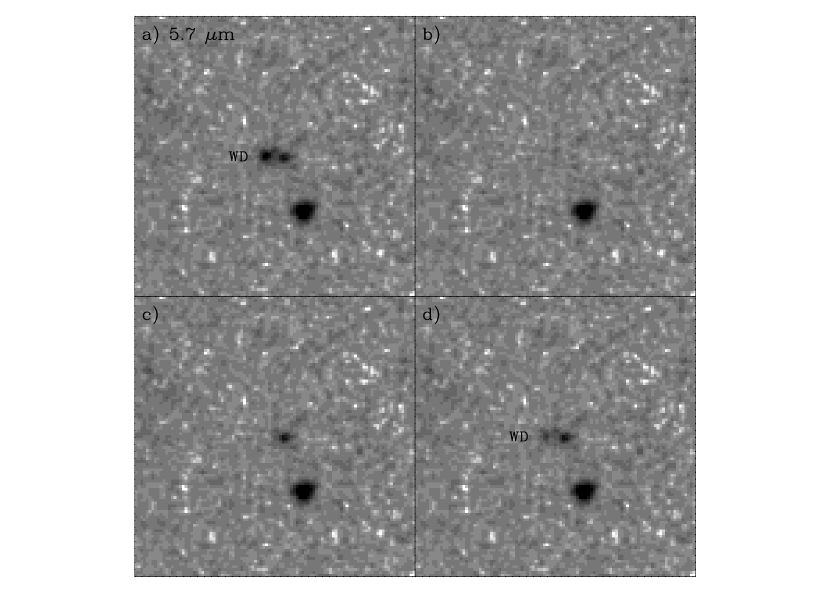
HE 01063253. The IRAC images of this star reveal another source separated by at position angle , as measured by daophot using the pixel-1 images (Figure 3). The neighboring source appears to be a background galaxy based on its half maximum intensity at 3.6 and 4.5 m, measured in a direction orthogonal to its position angle relative to the white dwarf. Two independent methods were used to measure the flux of the white dwarf without contamination from the nearby galaxy. First, daophot was employed to fit both the white dwarf and the nearby galaxy (thus treating it as a point source) simultaneously. This was done with two independent sets of PSF stars, one derived from archival IRAC images taken for the Galactic component of the First Look Survey, and the other created using a few to several of bright point sources within the science target images. Additionally, daophot was run to fit the white dwarf only, with no information provided on the neighboring source. It is noteworthy that the task returned similar results for these two approaches, within 3% at all four IRAC wavelengths.
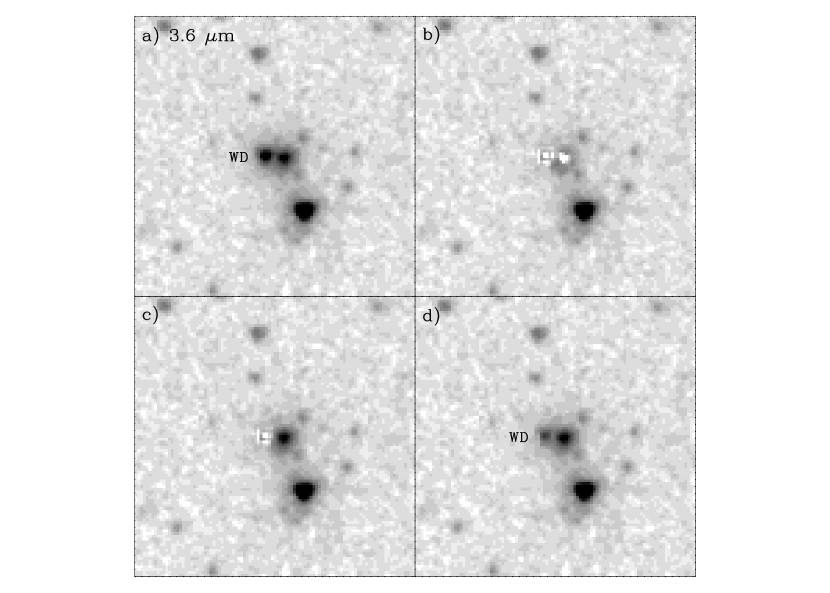
Second, relative aperture photometry was performed on HE 01063253 and a moderately bright, nearby star 2MASS J010834973237486; this star can be seen in Figures 3 and 4, distant from the white dwarf. Robust centroids were determined for each star using both gaussian profile analysis and daophot PSF fitting; the centroids in all four channels were averaged for each star and found to agree to within 1 standard deviation of 0.10 pixels. The centroid for the comparison star was taken to be fixed while photometry for the white dwarf was performed at a total of nine positions; at the nominal centroid plus at eight positions along a circle of radius 0.10 pixels about this center, spaced evenly at angles 45 to in the image plane. Photometry was executed in half-pixel steps from 1 to 4 pixels. The same relative photometric analysis was also performed for two randomly selected point sources (called ’star1’ and ’star2’) within the HE 01063253 IRAC field of view. Lastly, the 2MASS comparison star was input to daophot as a reference PSF, and the white dwarf flux was re-measured as above.
Figure 5 plots the results of the relative flux measurements between the white dwarf and 2MASS comparison star. Each datum is the average and error among the nine positions where the white dwarf flux was measured. Also shown in the plot are the fluxes as determined by daophot, averaged over the 3 sets of PSF stars, and the expected white dwarf photospheric fluxes as determined by the model shown in Figure 1. Two things are apparent from the figure and analysis: 1) HE 01063253 is photometrically extended beyond pixels, and possibly beyond 1.5 pixels; 2) the daophot flux measurements are in good agreement with the fluxes determined by relative photometry with the 2MASS comparison star at pixels.
The fluxes determined by these methods are listed in Table 5, and a series of representative images are shown in Figures 3 and 4. Both methods yield IRAC fluxes in excess of the predicted photospheric emission of the white dwarf based on the model plotted in Figure 1; the weighted average of these is plotted in the Figure and listed in Table 2. The excess at each IRAC wavelength lies in the range using the errors derived via the individual measurements, or within using the weighted average errors. The nearby galaxy cannot account for the results of the PSF fitting photometry where extracted sources must conform to a relatively static, model point source. The last panel of Figures 3 and 4 displays the PSF fit and removal of the white dwarf at the expected photospheric level; a point-like residual (excess) is seen at the location of the white dwarf.
To assess the potential flux contamination by the galaxy, a radial profile and vector analysis of the white dwarf flux was performed. Both 1D gaussian profile fitting and a raw vector cut (each of 3 pixel width) were executed across the white dwarf in the direction towards and away from the galaxy, and the fluxes on either side were compared. From these analyses, it is found that at pixels from the white dwarf centroid, the side nearest the galaxy contains at most 15% more flux than the side opposite at 3.6 m, and no more than 10% at the three longer wavelengths. Assuming a worst case scenario where one-half of the photometric aperture is biased in this manner – certain not to be the case – then the galaxy contributes a maximum of 5% of the measured flux at all wavelengths except 3.6 m, where it is limited to 7.5%. The excess flux (measuredphotosphere) relative to the measured flux is 27, 32, 39, and 55% at 3.6, 4.5, 5.7, and 7.9 m, and hence the potential influence of the galaxy cannot account this excess. From this analysis, it appears that HE 01063253 has an infrared excess.

HS 03070746. Figure 1 reveals an infrared excess around this star based on the plotted 10 500 K DA model and the short wavelength photometry. The data are anchored to the 2MASS -band measurement of mag, where the and colors were derived spectroscopically by Kilic et al. (2006). The only optical, photoelectric photometry comes from the Carlsberg Meridian Catalog (CMC) where two measurements are given as mag. Koester & Wilken (2006) give K and for the white dwarf, similar to the plotted model that agrees well with the GALEX far- and near-ultraviolet fluxes. If the model used here is sufficiently accurate, the putative excess at HS 03070746 appears at the level at all IRAC wavelengths.
Ton 345. The Spitzer data for this star is analyzed elsewhere, but the AKARI IRC fluxes reported here are original and appear broadly consistent with the near-infrared and Spitzer IRAC fluxes (Melis et al., 2010; Brinkworth et al., 2010).
PG 1225079 and GD 303. The 7.9 m IRAC flux at PG 1225079 indicates a excess (Figure 2) while all other photometric data are consistent with photospheric emission. If real, this star joins G166-58 as a metal-rich white dwarf with a long wavelength IRAC excess but no short wavelength excess; these two objects may form a class of object whose orbiting disks have large inner holes. GD 303 may have a marginal photometric excess at the level (Figure 2).
3.2. Notes on Stars Without Infrared Excess
GD 190. The 2MASS mag measurement (Figure 2) for this helium- and carbon-rich white dwarf appears erroneous at the level.
GD 205. The fit to the spectral energy distribution (SED) shown in Figure 2 employs a higher than that found by previous studies; 18 500 K (Voss et al., 2007), 19 700 K (Koester et al., 2005). However, the 20 500 K model better matches all the photometric data, including the GALEX fluxes.
2229235. While the native pixel scale IRAC images of this star reveal a single source (single Airy disk) with an elongated core, the pixel-1 mosaics spatially resolve a neighboring source at and position angle , as measured by daophot. The 2MASS - and -band images of the white dwarf may show a slight elongation in the expected direction, but the S/N in these images is too low to be certain (especially at -band). Photometric deconvolution was performed with daophot, yielding good results at 3.6 and 4.5 m; errors of 6% and 8% respectively for the white dwarf. While the neighboring source is likely extragalactic in nature, there is no evidence of elongation in the IRAC images, and there are no significant residuals in the PSF subtracted images of both sources at either of the shorter wavelengths.
Unfortunately, reliable optical or near-infrared photometry of HS 22292335 is lacking; the best data are mag (Copenhagen University Observatory, 2006), and mag (Skrutskie et al., 2006). The flux plotted at -band is the average and standard deviation of five photographic plate magnitudes from NOMAD, GSC2.3, and USNO-B1.0 (Space Telescope Science Institute, 2006; Zacharias et al., 2005; Monet et al., 2003). If interstellar extinction towards the white dwarf is negligible, the GALEX and IRAC data agree with an 18 500 K, DA model Koester & Wilken (2006). Near-infrared photometry would better constrain the SED of this white dwarf, but it does not appear to have a mid-infrared excess.

3.3. Disk Models
The infrared excesses at HE 01063253, HS 03070746, and HE 22211630 were fitted with the circumstellar disk models of Jura (2003). These disks are geometrically thin, flat rings of dust vertically optically thick at wavelengths up to 20 m. Figure 7 shows the model fits, while Table 6 gives the model parameters. The models do a reasonable job of reproducing the disk fluxes. Both HE 01063253 and HS 03070746 have a relatively high 3.6 m flux relative to the model; this behavior is also seen for the inner disk region at PG 1457086 (Farihi et al., 2009). It is conceivable that some disk warping in the inner regions is responsible for the relatively high observed flux at short infrared wavelengths, similar to that seen and modeled for GD 56 (Jura et al., 2009a, 2007a).
4. DISCUSSION
4.1. The Existence of Narrow Dust Rings

| WD | |||||||
|---|---|---|---|---|---|---|---|
| (K) | (K) | (K) | () | () | |||
| 0106328 | 15 700 | 3.4 | 1400 | 1100 | 0.19 | 0.27 | 0.15 |
| 0307077 | 10 200 | 3.5 | 1050 | 850 | 0.17 | 0.22 | 0.40 |
| 2221165 | 10 100 | 4.3 | 1200 | 750 | 0.14 | 0.27 | 0.50 |
Note. — The first column is the input temperature of the central star, followed by the ratio of the stellar radius to its photometric distance.
Two white dwarfs in this study – HE 01063253 and HS 03070746 – appear to have narrow () rings of dust similar to PG 1457086, when compared to the ensemble of white dwarfs with warm circumstellar disks (Farihi et al., 2009). In fact, their disk widths could be even smaller as the models presented here are degenerate between disk width and inclination. For example, if the inclination of the disks at HE 01063253 or PG 1457 are actually close to face-on (), the radial extent of their dust is only , roughly 1 and 10 times smaller than the rings of Saturn, yet still over 10 times the diameter of all Solar System asteroids save Ceres. This finding has an important implication.
The detection of narrow dust rings suggests the asteroid accretion model may apply to additional, and potentially many, stars without a clear infrared excess. Take the most modest excess yet detected, that of PG 1457086: a face-on disk of width 0.01 and producing a 15% () excess would become difficult to confirm above , corresponding to an excess of only 10%. While such disks may appear slight when compared to the majority of infrared excesses discovered so far, they could easily contain sufficient mass to fuel the observed photospheric pollutions in DAZ and DBZ stars. At the high densities necessary to prevent collisional dust erosion within the disk (Farihi et al., 2008), the thin ring above could harbor over 1022 g of matter within a disk height of 10 m, and readily supply heavy elements at 109 g s-1 for nearly 106 yr. The discovery of three relatively narrow rings indicates there may be more subtle excesses awaiting detection.
Table 7 lists a comparison of the infrared excesses at all known white dwarfs with dust. To calculate the fractional dust continuum luminosity, , the excess flux in the m region was fitted by a single temperature blackbody, and its bolometric flux divided by the stellar flux (similar to those plotted in the SED figures). There are currently three white dwarfs with K dust whose infrared excesses are less than of the incident starlight: HE 01063253, WD 1041091 (SDSS J104341.53085558.2), and PG 1457086. The stars G166-58 and PG 1225079 owe their modest excesses to a lack of K dust, hence their low are qualitatively different. It is noteworthy that all stars with had their disks discovered via ground-based observations.
| WD | Name | Stellar Model | m Blackbodya | |
|---|---|---|---|---|
| (K) | (K) | |||
| 0106328 | HE 01063253 | 16 000 | 1400 | 0.0008 |
| 0146187 | GD 16 | 11 500 | 1000 | 0.0141 |
| 0300013 | GD 40 | 15 000 | 1200 | 0.0033 |
| 0408041 | GD 56 | 14 500 | 1000 | 0.0257 |
| 0307077 | HS 03070746 | 10 500 | 1200 | 0.0028 |
| 0842231 | Ton 345 | 18 500 | 1300 | 0.0048 |
| 1015161 | PG | 19 500 | 1200 | 0.0017 |
| 1041091 | SDSS 104341.53085558.2 | 18 500 | 1500 | 0.0008 |
| 1116026 | GD 133 | 12 000 | 1000 | 0.0047 |
| 1150153 | EC 115071519 | 12 500 | 900 | 0.0216 |
| 1226110 | SDSS 122859.93104032.9 | 22 000 | 1000 | 0.0042 |
| 1225079: | PG | 10 500 | 300: | 0.0005: |
| 1455298 | G166-58 | 7500 | 500 | 0.0015 |
| 1457086 | PG | 20 000 | 1800: | 0.0007 |
| 1729371 | GD 362 | 10 500 | 900 | 0.0235 |
| 2115560 | LTT 8452 | 9500 | 900 | 0.0092 |
| 2221165 | HE 22211630 | 10 100 | 1000 | 0.0076 |
| 2326049 | G29-38 | 11 500 | 1000 | 0.0297 |
Note. — Measured infrared excess from thermal continuum emission between 2 and 6 m, as most stars lack spectroscopic data on any potential silicate emission in the m region.
A disk of radial width 0.01 may result from the tidal disruption of an asteroid perturbed into an orbit with periastron near 0.2 , and dust spreading timescales suggest the material need not expand to a much greater radius. In the context of Spitzer searches for dust at polluted white dwarfs, highly attenuated rings of dust may persist at some white dwarfs that lack apparent infrared excess. Without supplementary ground-based, near-infrared photometry, the mild infrared excess at PG 1457086 would not be obvious (Farihi et al., 2009; Farihi, 2009). A combination of accurate optical and near-infrared photometry with appropriate atmospheric models may reveal excesses previously missed. Ideally, high signal-to-noise mid-infrared spectroscopy spanning the 10 m silicate feature should be capable of detecting very modest dust emission, such as that seen at HD 69830 (Lisse et al., 2007). Spectroscopy with the Mid-Infrared Instrument for JWST would be an ideal choice to reveal the most subtle infrared excesses.
4.2. A Class of Disks with Enlarged, Dust-Free Inner Regions?
Among white dwarfs with circumstellar dust, G166-58 was the first star observed to have an beginning long ward of 4 m (Farihi et al., 2008). Figure 8 revisits the available photometry for this DAZ star and plots the IRAC data, together with IRTF , SDSS , and GALEX near-ultraviolet photometry. These data are fitted with a 7500 K, DA model that reproduces the photometry well to 4.5 m. The IRAC fluxes have changed marginally following analysis of the newly available pixel-1 mosaics for this star. The excess can be reproduced by a 500 K blackbody, implying the inner dust disk edge cannot be significantly warmer. The flat ring model then predicts the innermost dust is located at 0.28 , and far from where silicate grains should rapidly sublimate. Therefore, the dust disk appears to have an enlarged, dust-free inner region.
Interestingly, PG 1225079 appears to have an excess only at 7.9 m and may also represent a dust disk with a large inner ‘hole’. An excess flux is difficult to confirm with the current data alone, yet the IRAC images are of good quality and free of neighboring sources. If the excess is confirmed, the dust-free, inner region at PG 1225079 should be around three times larger than that inferred for G166-58, but still located well within the Roche limit for kilometer size or larger solid (rocky or icy) bodies (Davidsson, 1999). There are two distinct possibilities for such large dust-free zones: 1) the region is dominated by gaseous matter emitting inefficiently in the infrared or, 2) the region is depleted relative to the dust inferred from the observed infrared excess.
The first possibility can arise if the inner dust disk region is impacted by a moderate size asteroid whose solid mass and angular momentum is dissipated via collisions prior to vaporizing the entire disk (Jura, 2008). In Saturn’s rings, the observed radial dark lanes or spokes are the result of meteorite impacts, whose kinetic energies are sufficient to produce fine dust, gas, and (importantly) plasma, which interact dynamically within this environment to obscure the rings (Goertz & Morfill, 1983; Morfill & Goertz, 1983). Similar impacts upon dust disks at white dwarfs should release kinetic energies 1000 times higher due to the difference in gravitational potential; the model radii and sizes of dust rings at white dwarfs are very similar to those of Saturn.
This model is attractive because it can account for disks with enlarged, dust-free inner regions or small outer radii (including narrow rings) as well as high accretion rate DAZ white dwarfs that lack infrared excess out to 7.9 m yet require a nearby, ongoing source of photospheric heavy element pollution. G166-58 has a relatively long diffusion timescale for a DAZ star, around 2000 yr for the observed calcium (Koester, 2009a). This calculated lifetime does not guarantee accretion is ongoing, but the presence of orbiting dust makes it likely.
Perhaps more important, the absence of detectable dust need not imply an absence of accretion and photospheric pollution. While the disks at G166-58 and PG 1225079 may be partly composed of dust particles which are detected in the infrared, and partly of gaseous heavy elements which remain unseen, most metal-contaminated white dwarfs lack infrared dust signatures altogether (Farihi et al., 2009). In many of these cases accretion must be ongoing and can be accounted for by the presence of either tenuous dust rings or completely gaseous disks (Jura, 2008); unseen brown dwarf companions have been ruled out (Farihi et al., 2009, 2008).
The second possibility for dust disks with large inner holes is a relative dearth of dust (and gas) due to prior accretion; i.e. a partly consumed disk. PG 1225079 has a heavy element diffusion timescale typical of cooler DBZ stars, over 1 Myr for calcium (Koester, 2009a). In this case the lifetime of metals implies that accretion need not currently proceed at a high rate, and the observed metals may be residuals from an older event. Although the presence of an infrared excess, and hence the possibility of orbiting dust, make an ongoing accretion scenario likely, it raises an important question about the disk depletion timescale at white dwarfs. A prediction of ceased accretion would be higher relative atmospheric abundances of lighter elements (Koester, 2009a), and is testable with good abundance data for PG 1225079.
In the appendix, a simple calculation demonstrates that radiation drag (the Poynting-Robertson effect) on particles is insufficient to drive the infall of disk material and account for the distribution of inferred heavy element accretion rates at disk-polluted DAZ stars (Farihi et al., 2009; Jura et al., 2007b; Koester & Wilken, 2006). At the inner disk edge, viscous spreading due to collisions between differentially rotating ring annuli and random motions among solids (Esposito, 1993) must be boosted by the presence of gas (via sublimated or collisionally vaporized dust); such enhancement must be significant. Farihi et al. (2008) have shown that grains within white dwarf disks will collide on a timescale at least an order of magnitude shorter than their Poynting-Robertson lifetime. Therefore, high viscosity resulting from dust-gas interactions must be ultimately responsible for the implied accretion rates from observed disks. For a disk that is otherwise optically thick at all relevant wavelengths, only a tiny fraction of its total volume – only the inner edge – will be illuminated by the central star. There is no compelling reason why the remainder of the disk should not evolve as a particulate ring, having a very low dust viscosity (Esposito, 1993), and be gradually whittled away via gas drag at the inner edge.

4.3. The Emerging Picture
Figures 9 and 10 plot the metal abundances versus effective temperature and time-averaged metal accretion rate versus cooling age for 60 Spitzer observed metal-rich white dwarfs. All accretion rates were re-calculated following Farihi et al. 2009 using recent results on metal diffusion timescales and convective envelope masses for both DAZ and DBZ white dwarfs, including mixed cases (Koester 2009a; D. Koester 2009, private communication); parameters for the newly observed Cycle 5 stars are listed in Table 8. Plotted as newly discovered disks are HE 01063253, HE 03070746, HE 22211630, and tentatively PG 1225079. To these are added three white dwarfs orbited by both dust and gaseous metals (Brinkworth et al. 2009; C. Brinkworth 2008, private communication), while PG 1632177 (observed by Farihi et al. 2008 and listed as DAZ in Farihi et al. 2009) has been removed from this growing sample, as it is not metal-lined (Zuckerman et al., 2003).


The new additions to the plots continue the trend that metal accretion rates g s-1 are those that are most likely to exhibit infrared excess (Farihi et al., 2009); the sole exception is G166-58. Two of the disks discovered in this work orbit relatively cool white dwarfs with cooling ages of 0.73 and 0.94 Gyr. These are somewhat older than the previous average cooling age of white dwarfs with disks as found in Farihi et al. (2009), and may indicate relative longevity for orbiting dust.
Viscous spreading among solids may allow optically thick dust rings at white dwarfs to persist for at least 10 Myr timescales, possibly orders of magnitude longer, analogous to planetary rings. The inner radius of Saturn’s rings represents the furthest inner extent of its spreading over a period up to a few Gyr (Esposito et al., 2008). For dust rings at white dwarfs, gas drag should decrease the viscous timescale by orders of magnitude, but the gas content in most white dwarf disks is presently unconstrained. At the inner edge of a typical dust disk, rapid sublimation of dust will produce significant gas, as may grain-grain collisions. Such viscosity enhancements are necessary to reproduce the dust accretion rates inferred for stars with short photospheric metal lifetimes.
Dust rings at white dwarfs are unlikely to be as simple as modeled here; calcium triplet emission lines at three metal-polluted stars can be approximately reproduced by orbiting disks, but there are asymmetries which indicate deviations from the model (Gänsicke et al., 2008). Yet it is noteworthy that the simple model works rather well given only three free parameters, two of which – the inner and outer radius – are physically well-motivated.
Significant orbital energy must be shed to transform an asteroid on a perturbed, eccentric orbit into a disk contained entirely within the Roche limit of a white dwarf. The primordial energy may dissipate partially via collisions which initially widen the disk (or perhaps not in the case of narrow rings), yet an efficient way to discard orbital energy is within a large fragment of the tidally disrupted parent body. Surviving fragments may be responsible for warps invoked in some disk models, such as GD 362 and GD 56 (Jura et al., 2009a, 2007b). Saturn’s ring-moon Daphnis – 8 km in diameter and comparable to a small asteroid – causes 1 km vertical disturbances in the A ring; 100 times larger than the height of the unperturbed rings (Weiss et al., 2009). The more substantial Mimas, lying just outside Saturn’s main rings (and its Roche limit) with a mass nearly identical to the total mass of the rings, is responsible for the Cassini Division between the A and B rings. A Mimas-analog of 1022 g could orbit a white dwarf beyond 2.0 and not be tidally destroyed. Such a body with an inclined (relative to the disk) or eccentric orbit, could easily excite warping or eccentricity within a white dwarf dust ring (Borderies et al., 1984). Dynamical modeling of tidal disruption events may shed light on the frequency, size, and orbital distribution of residual fragments.
| WD | SpT | [H/He] | log | log () | |||
|---|---|---|---|---|---|---|---|
| () | (K) | (Gyr) | (g s-1) | (g) | |||
| 0047190 | DAZ | 0.51 | 16 600 | 0.11 | 9.0 | ||
| 0106328 | DAZ | 0.62 | 15 700 | 0.17 | 9.3 | ||
| 0307077 | DAZ | 0.66 | 10 200 | 0.73 | 8.9 | ||
| 0842231 | DBZ | 0.71 | 18 600 | 0.16 |
aaThis single temperature is a zeroth order approximation of the disk SED.
|
9.4 | 21.7 |
| 1011570 | DBZ | 0.60 | 18 000 | 0.12 |
aaUpper limit.
|
8.7 | 21.2 |
| 1225079 | DZA | 0.58 | 10 500 | 0.59 | 9.2 | 23.1 | |
| 1709230 | DBAZ | 0.65 | 18 500 | 0.13 | 8.4 | 20.7 | |
| 2221165 | DAZ | 0.73 | 10 100 | 0.94 | 8.9 | ||
| 2229235 | DAZ | 0.57 | 18 600 | 0.09 | 9.3 |
Note. — The seventh column lists time-averaged metal infall rates, calculated assuming a steady state between accretion and diffusion. The eighth column shows the mass of metals in the convective envelopes of the DBZ stars, based on the observed calcium abundances and assuming this represents 1.6% of the total mass of heavy elements, as in the bulk Earth (Allègre et al., 1995).
5. CONCLUSIONS
Three (possibly four) newly identified dust disks orbiting metal-polluted white dwarfs are discovered by Spitzer IRAC as mid-infrared excess emission over m. The fractional infrared (dust continuum) luminosity from HE 22211630 is relatively large and around 0.008. In contrast, HE 01063253 and HE 03070746 with their much smaller infrared luminosities are modeled by narrow rings of orbiting dust. Even narrower disks at white dwarfs are possible, and perhaps likely given the necessity for ongoing heavy element pollution at the bulk of DAZ stars. An attenuated, flat disk as narrow as half an earth radius can harbor up to g of material and be sufficient to reproduce the inferred 1) metal accretion rates of DAZ stars for at least 104 yr, and 2) mass of heavy elements in the convective envelopes of DBZ stars. Yet such a tenuous ring of dust would not exhibit an infrared excess at the 10% level for any inclination. The only evidence of accretion may be the photospheric pollution; other signatures such as X-ray emission seen in accreting binaries require much higher mass infall rates than inferred for metal-enriched white dwarfs. Therefore, elemental abundances for polluted stars without an infrared excess are still likely to represent the bulk composition of accreted minor planets.
PG 1225079 is a tantalizing potential disk that emits only at 7.9 m, but which may confirm a previously suspected class of dust ring with a large inner hole. While the excess emission from G166-58 is somewhat similar in temperature, a flat ring model predicts the inner hole at PG 1225079 would be significantly larger and may represent a disk that is near to being fully accreted; forthcoming data may test this scenario.
Appendix A Accretion Rates from Poynting-Robertson Drag on Dust Particles
Jura et al. (2007a) demonstrate that dust captured near the Bondi-Hoyle radius (i.e. interstellar grains), and accreted under the influence of Poynting-Robertson (PR) drag, cannot account for the detected (and upper limit) infrared emission at DAZ white dwarfs. That is, assuming metal accretion rates sufficient to reproduce the photospheric metals, the predicted 24 m emission from grains spiraling inward under radiation drag is typically tens to hundreds of times higher than that measured at polluted white dwarfs (Farihi et al., 2009; Jura et al., 2007a).
Here, this argument is extended to consider PR drag on closely orbiting dust rings. To better understand the lifetime of such dust disks in the presence of accretion, consider the following simplistic but instructive model. A flat ring of dust extends outward from 0.2 , with thickness m (typical of Saturn’s rings), and consisting of g cm-3 dust grains. The ring orbits a compact star with , a value typical for a 16 000 K DA white dwarf (Fontaine et al., 2001), whose full starlight penetrates the inner disk edge to a depth of one mean free path (). The PR lifetime of particles at the inner surface is given by (Burns et al., 1979):
| (A1) |
where is the distance to the inner disk edge, is the particle size, and is the radiative coupling coefficient. For particles around 1 m or larger, geometrical optics is valid and . Applied to a disk of fixed volume and uniform density, the shell of mass exposed to the full radiation drag force is
| (A2) |
where is the volume mass density of the disk, and is the depth of the exposed shell mass (the mean free path in this case). For One can make the approximation
| (A3) |
where is the mean free path given by
| (A4) |
and the number density of particles, is
| (A5) |
Hence the mean free path can be reduced to
| (A6) |
and the exposed shell mass depends only on particle size, and is specifically independent of the disk density (or total disk mass in this case)
| (A7) |
Because the PR lifetime of this shell is also proportional to particle size, the mass infall rate at the inner disk edge is essentially constant for the case of geometric optics
| (A8) |
and around 6000 g s-1 for the parameters given above. For silicate particles smaller than around 1 m, geometric optics is not appropriate; radiative coupling becomes more effective until around 0.3 m, then less effective at smaller radii (Artymowicz, 1988). The maximum implied mass infall rate due to PR drag calculated in this manner is g s-1 and a few to several orders of magnitude shorter than the inferred metal accretion rates for DAZ white dwarfs.
It should be noted that this model does not apply to disk particles excepting those at the innermost edge which are exposed to the full starlight. However, such particles should rapidly sublimate at some radius and are then no longer subject to radiation drag, further corroborating that PR forces cannot account for the necessary dust/gas infall rates.
References
- Abazajian et al. (2009) Abazajian, K. N., et al. 2009, ApJS, 182, 543
- Artymowicz (1988) Artymowicz, P. 1988, ApJ, 335, L82
- Allègre et al. (1995) Allegre, C. J., Poirier, J. P.,Humler, E., & Hofmann, A.W. 1995, Earth Planetary Sci. Letters, 4, 515
- Borderies et al. (1984) Borderies, N., Goldreich, P., & Tremaine, S. 1984, ApJ284, 429
- Brinkworth et al. (2009) Brinkworth, C. S., Gänsicke, B. T., Marsh, T. R., Hoard, D. W., & Tappert, C. 2009, ApJ, 696, 1402
- Brinkworth et al. (2010) Brinkworth, C. S., et al. 2010, in preparation
- Burns et al. (1979) Burns, J. A., Lamy, P. L., & Soter, S. 1979, Icarus, 40, 1
- Butler et al. (2006) Butler, R. P., et al. 2006, 646, 505
- Copenhagen University Observatory (2006) Copenhagen University Observatory 2006, The Carlsberg Meridian Catalog 14 (Strasbourg: CDS)
- Davidsson (1999) Davidsson, B. J. R. 1999, Icarus, 142, 525
- DENIS Consortium (2005) DENIS Consortium 2005, The DENIS Database, Release (Strasbourg: CDS)
- Esposito (1993) Esposito, L. W. 1993, AREPS, 21, 487
- Esposito et al. (2008) Esposito, L. W., Meinke, B. K., Colwell, J. E., Nicholson, P. D., & Hedman, M. M. 2008, Icarus, 194, 278
- Farihi (2009) Farihi, J. 2009, MNRAS, 398, 2091
- Farihi et al. (2009) Farihi, J., Jura, M., Zuckerman, B. 2009, ApJ, 694, 805
- Farihi et al. (2008) Farihi, J., Zuckerman, B., & Becklin, E. E. 2008b, ApJ, 674, 431
- Fazio et al. (2004) Fazio, G. G., et al. 2004, ApJS, 154, 10
- Fontaine et al. (2001) Fontaine, G., Brassard, P., & Bergeron, P. 2001, PASP, 113, 409
- Gänsicke et al. (2008) Gänsicke, B. T., Koester, D., Marsh, T. R., Rebassa-Mansergas, A., & Southworth J. 2008, MNRAS, 391, L103
- Gänsicke et al. (2006) Gänsicke, B. T., Marsh, T. R., Southworth, J., & Rebassa-Mansergas, A. 2006, Science, 314, 1908
- Goertz & Morfill (1983) Goertz, C. K., & Morfill, G. 1983, Icarus, 53, 219
- Hagen et al. (1995) Hagen, H. J., Groote, D., Engels, D., & Reimers, D. 1995, A&AS, 111, 195
- Jura (2003) Jura, M. 2003, ApJ, 584, L91
- Jura (2008) Jura, M. 2008, AJ, 135, 1785
- Jura et al. (2007a) Jura, M., Farihi, J., & Zuckerman, B. 2007a, ApJ, 663, 1285
- Jura et al. (2009a) Jura, M., Farihi, J., & Zuckerman, B. 2009a, AJ, 137, 3191
- Jura et al. (2009b) Jura, M., Muno, M., Farihi, J., & Zuckerman, B. 2009b, ApJ, 699 1473
- Jura et al. (2007b) Jura, M., Farihi, J., Zuckerman, B., & Becklin, E. E. 2007b, AJ, 133, 1927
- Kilic et al. (2008) Kilic, M., Farihi, J., Nitta, A., & Leggett, S. K. 2008, AJ, 136, 111
- Kilic et al. (2006) Kilic, M., von Hippel, T., Leggett, S. K., & Winget, D. E. 2006, ApJ, 646, 474
- Klein et al. (2010) Klein, B., Jura, M., Koester, D., Zuckerman, B., & Melis C. 2010, ApJ, in press (arXiv:0912.1422)
- Koester (2009a) Koester, D. 2009a, A&A, 498, 517
- Koester (2009b) Koester, D. 2009b, to appear in Memorie della Società Astronomica Italiana, based on lectures given at the School of Astrophysics “F. Lucchin”, Tarquinia, June 2008 (arXiv:0812.0482)
- Koester & Wilken (2006) Koester, D., & Wilken, D. 2006, A&A, 453, 1051
- Koester et al. (2005) Koester, D., Rollenhagen, K., Napiwotzki, R., Voss, B., Christlieb, N., Homeier, D., & Reimers, D. 2005a, A&A, 432, 1025
- Landolt & Uomoto (2007) Landolt, A. U., & Uomoto, A. K. 2007, AJ, 133, 768
- Lisse et al. (2007) Lisse, C. M., Beichman, C. A., Bryden, G., & Wyatt, M. C. 2007, ApJ, 658, 584
- Martin et al. (2005) Martin, D. C., et al. 2005, ApJ, 619, L1
- McCook & Sion (2008) McCook, G. P., & Sion, E. M. 2008, Catalog of Spectroscopically Identified White Dwarfs (Strasbourg: CDS)
- McCook & Sion (1999) McCook, G. P., & Sion, E. M. 1999, ApJS, 121, 1
- Melis et al. (2010) Melis, C., Jura, M., Albert, L., Klein, B., & Zuckerman, B. 2010, ApJ, submitted
- Monet et al. (2003) Monet, D., et al. 2003, AJ, 125, 984
- Morfill & Goertz (1983) Morfill, G. E., & Goertz, C. K. 1983, Icarus, 55, 111
- Murakami et al. (2007) Murakami, H., et al. 2007, PASJ, 59, 369
- Onaka et al. (2007) Onaka, T. et al. 2007, PASJ, 59, 401
- Petitclerc et al. (2005) Petitclerc, N., Wesemael, F., Kruk, J. W., Chayer, P., Billeres, M. 2005, ApJ, 624, 31
- Skrutskie et al. (2006) Skrutskie, M. F., et al. 2006, AJ, 131, 1163
- Space Telescope Science Institute (2006) Space Telescope Science Institute 2006, The Guide Star Catalog Version 2.3, (Baltimore: STScI)
- Spitzer Science Center (2006) Spitzer Science Center. 2006, IRAC Data Handbook Version 3.0 (Pasadena: SSC)
- Voss et al. (2007) Voss, B., Koester, D., Napiwotzki, R., Christlieb, N., & Reimers, D. 2007, A&A, 470, 1079
- Werner et al. (2004) Werner, M. W., et al. 2004, ApJS, 154, 1
- Weiss et al. (2009) Weiss, J. W., Porco, C. C., & Tiscareno, M. S. 2009, AJ, 138, 272
- Wisotzki et al. (1996) Wisotzki, L., Koehler, T., Groote, D., & Reimers, D. 1996, A&AS, 115, 227
- Wolff et al. (2002) Wolff, B., Koester, D., & Liebert, J. 2002, A&A, 385, 995
- Zacharias et al. (2005) Zacharias, N., Monet, D. G., Levine, S. E., Urban, S. E., Gaume, R., Wycoff, G. L. 2005, The NOMAD Catalog (Strasbourg: CDS)
- Zuckerman et al. (2007) Zuckerman, B., Koester, D., Melis, C., Hansen, B. M. S., & Jura, M. 2007, ApJ, 671, 872
- Zuckerman et al. (2003) Zuckerman, B., Koester, D., Reid, I. N., & Hünsch, M. 2003, ApJ, 596, 477