Precessing jets and X-ray bubbles from NGC 1275 (3C 84) in the Perseus galaxy cluster: a view from 3D numerical simulations
Abstract
The Perseus galaxy cluster is known to present multiple and misaligned pairs of cavities seen in X-rays, as well as twisted kiloparsec-scale jets at radio wavelengths; both morphologies suggest that the AGN jet is subject to precession. In this work we performed 3D hydrodynamical simulations of the interaction between a precessing AGN jet and the warm intracluster medium plasma, which dynamics is coupled to a NFW dark matter gravitational potential. The AGN jet inflates cavities that become buoyantly unstable and rise up out of the cluster core. We found that under certain circumstances precession can originate multiple pairs of bubbles. For the physical conditions in the Perseus cluster, multiple pairs of bubbles are obtained for a jet precession opening angle acting for at least three precession periods, reproducing well both radio and X-ray maps. Based on such conditions, assuming that the Bardeen-Peterson effect is dominant, we studied the evolution of the precession opening angle of this system. We were able to constrain the ratio between the accretion disc and black hole angular momenta as . We were also able to constrain the present precession angle to , as well as the approximate age of the inflated bubbles to Myrs.
1 Introduction
The powerful radio source 3C 84 is associated to the elliptical galaxy NGC 1275 (), the dominant member of the Perseus cluster. Besides its very complex radio morphology at parsec and kiloparsec scales characterized by ’S’ or ’Z’-shaped jets (Walker et al. 2000, and references therein), 3C 84 exhibits pairs of kiloparsec X-ray bubbles positioned at different angles with respect to the radio jet. The misaligned orientation of the bubbles has been interpreted as produced by a jet, precessing with a period of years and semi-aperture angle of about 50∘ (Dunn, Fabian & Sanders 2006, and references therein).
The interaction between AGN jets and the intracluster medium (ICM) has already been studied in numerical simulations. Scannapieco & Bruggen (2008) and Bruggen, Sccanapieco & Heinz (2009) studied the evolution of pre-set hot gas bubbles and their role in the distribution of energy in galaxy clusters. Heinz et al. (2006) implemented a self-consistent procedure by means of AGN jets, though failing in inflating bubbles as observed. Typically, the narrow, relativistic and nonprecessing jets carve the ICM hot gas and release most of its energy far from the central region of the system (Vernaleo & Reynolds 2006, O’Neill & Jones 2010), an effect known as “dentist drill”. Sternberg et al. (2007) showed that wide jets, with opening angles , are able to transfer momentum into a larger area resulting in the inflation of fat bubbles. The same physical properties, however, are expected in precessing AGN jets (Sternberg & Soker 2008a). Large precession angles sustained for long periods can be able to inflate cavities as observed in the Perseus galaxy cluster.
In this work we present a number of hydrodynamical 3D numerical simulations taking into account the evolution of precessing jets, and study the inflation of cavities that can reproduce the observed emission maps of NGC 1275 at radio and X-rays. We assume in this work that the jet precession evolution is due to the Bardeen-Peterson effect. The model is described in Section 2, as well as the numerical setup. In Section 3 we present the main results and the comparison between the synthetic and observed features in NGC 1275, followed by the conclusions.
2 The model
The basic idea of this work relies on the fact that a precessing jet, originated in the central region of NGC 1275, interacts with the intracluster gas resulting in the inflation of bubbles. These may rise outward of the cluster core, while new bubbles are constantly formed and grow at different position angles due to jet precession.
Several processes may lead to jet precession, such as magnetic torques, warped discs and gravitational torques in a binary system (Pizzolato & Soker 2005). In this work, we attributed jet precession to the Bardeen-Petterson torques acting on the viscous accretion disc that originates the jet, which must be tilted with relation to the equatorial plane of the central Kerr black hole (Bardeen & Petterson 1975). In fact, since the origin of the accretion disc is probably related to merging processes, it is very unlikely that the BH and the infalling material momentum are perfectly aligned, making the Bardeen-Peterson effect a probable precessing mechanism in such an environment. This effect also induces the alignment of the disc and the black hole angular momenta, explaining the presence of twisted jets in several observed AGNs (Liu & Melia 2002, Caproni et al. 2004, 2006, 2007, Fragile & Anninos 2005, Martin, Pringle & Tout 2007, Chen, Wu & Yuan 2009).
Under the approximation of a constant surface density accretion disc, Scheuer & Feiler (1996) showed that, for small misalignment angles, its time evolution results in an exponential decay of the precession angle in timescales of the order of the precession period. However, King et al. (2005) pointed out that this behavior is not universal, and more complex time evolutions could be obtained for different disc structures. Assuming the total angular momentum vector, defined as , being respectively and the disc and black hole angular momenta, is fully conserved, King et al. (2005) derived the equation that rules the time dependency of :
| (1) |
where , is the precession period and the ’+’ and ’-’ signs correspond, respectively, to the alignment and counter-alignment of the involved angular momenta vectors. Notice that is the angle between the disk and the black hole angular momenta, while represents the angle between the disk and the total angular momenta. Since is constant, from Eq.(1) it is possible to obtain the time evolution of both and .
2.1 Setup of the numerical simulations
In order to simulate the inflation of the observed cavities detected in X-rays, as well as the jet geometry observed at radio wavelengths, we performed a number of hydrodynamical simulations that provide the evolution of the jet interaction with the ICM, as well as the formation of the bubbles.
The model was implemented in a well-tested Godunov scheme, in which we integrate the full set of hydrodynamical equations in conservative form (Falceta-Gonçalves, Kowal & Lazarian 2008, Burkhart et al. 2009 and Leão et al. 2009). The radiative cooling module was computed independently, as we calculate after each timestep, where is the number density, is the gas pressure, the adiabatic constant and is the interpolation function from an electron cooling efficiency table for an optically thin gas (Gnat & Sternberg 2007).
The external gravity was introduced through a fixed distribution of dark matter following the NFW profile (Navarro, Frenk & White 1996),
| (2) |
where represents the characteristic radius of the cluster, the mass density, and the absolute mass within the radius . From isothermal pressure equilibrium the gas density may be described by . This equation represents the initial density distribution for all runs. The temperature was initially set as uniform, being K. As initial setup for the simulations we used an initial core density cm-3 and kpc, which resulted in a profile similar to the empirical density distribution (Sanders et al. 2004). The computational domain corresponded to three dimensional (3D) cubes with physical size kpc in each direction. The cubes were homogeneously divided into fixed 2563 and 5123 cells, the later corresponding to kpc/cell. We used open boundary conditions in order to allow gas motion in/outwards the computational domain, as the pressure gradients evolved with time.

To simulate the jets we selected a central region in the computational domain with a radius of 1kpc with fixed physical conditions. The local velocity was fixed as (which corresponds to km s-1) in both opposite directions of the jet that forms an angle with respect to the x-axis of the cube, which coincided with the total angular momentum of system. The geometry of the simulated jet is cylindrical, i.e. the velocity field of the launched jet is uniform. The temperature is set as , and the density , resulting in a total mass loss rate of M⊙ yr-1 and a total kinetic power of erg s-1. The assumed geometry is shown in Fig. 1. The total angular momentum of the system , i.e. the precession symmetry axis, is set in the x direction. The jet precesses around the x-axis with an opening angle and an angular velocity . Initially, we set .
In the simulations, the precession period is assumed to be constant as yr, close to the value of yr obtained by Dunn, Fabian & Sanders (2006). We run several models for different initial precession angles to study its role on the formation of bubbles.
As discussed above, the behavior of depends mostly on the ratio of the angular momenta of the disc and BH. Since this value is unknown, we have initially assumed in the simulations an alignment law , following Scheuer & Feiler (1996), and varied , according to the values in Table 1, except for Model # 13 for which we have obtained the precession angle self-consistently from Eq. 1.
| Model | resolution | Output | ||
|---|---|---|---|---|
| 1 - 4 | 10∘ | 0.5, 1.0, 2.0 & 4.0 | single pair of bubbles | |
| 5 - 8 | 30∘ | 0.5, 1.0, 2.0 & 4.0 | single pair of bubbles | |
| 9 - 11 | 60∘ | 0.5, 1.0 & 2.0 | single pair of bubbles | |
| 12 | 60∘ | multiple pairs of bubbles | ||
| 13 | 58∘ | multiple pairs of bubbles |
3 Results
From the simulated data, obtained under the assumption of exponential decay for , assuming the gas to be optically thin we constructed X-ray emission maps for different lines of sight. In this case, the X-ray emission can be represented by the emission measure, defined as the integral of the squared density along the line of sight (), and directly compared to the observations. Once the synthetic emission maps for all models were calculated, it was possible to visually recognize the morphological structures formed up to .
As main result we found that only models with and can reproduce the X-ray features in NGC 1275, namely the detached and misaligned double pair of bubbles/cavities. Lower values of result in single pairs of bubbles, being their widths proportional to . Also, models with but produce wide cavities but, since the precession is damped in a timescale shorter than the rise time of the bubbles only one pair of cavities is seen. With this in place, we were able to obtain the ideal set of angular momenta for the disc and the BH, based on Eq.(1). The result has been used for the precession angle evolution of Model # 13.
As the simulation begin, the radiative cooling is responsible for a reduction of thermal pressure at the central region where the gas is denser. A small inward flux (cooling flow) is observed (see Falceta-Gonçalves et al. [2010], for details). At later stages, as more energy is released by the AGN, this flow is reversed and an outward flux of km s-1 is seen at Myr. The temperature gradient of the ICM, however, is still present, as discussed below.
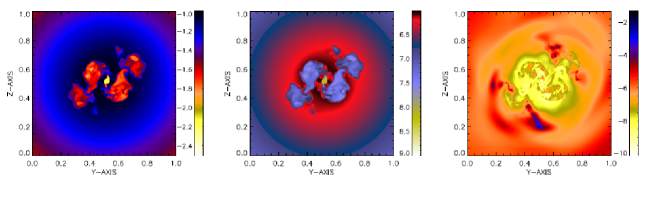
In Fig. 2 we show Y-Z central slices of model # 13 at evolutionary time of . The density cut (left pannel) clearly shows the existence of two disconnected bubbles. The density profile across the bubble shell reveal a density contrast , similar to the values obtained by (Sternberg & Soker 2009). This ratio corresponds to at , and at . Adiabatic strong shocks result in density enhancements of . This factor can be even larger if cooling is fast. At early stages, the jet shock with the ICM gas is supersonic. As the bubble expands the shocks become weaker and the density contrast is reduced.
The temperature map (center) is directly correlated to the density map. Here, the radiative cooling is responsible for the low temperature at the core ( K). The cooling timescale Myr gives a central temperature K after 150 Myr, in agreement with the simulations. Within the bubbles, the temperature of the low density gas decreases mostly due to adiabatic expansion as . The bubbles shown in Fig. 2 present a radius kpc, which gives K. For kpc, the cooling has not have enough time to decrease the gas temperature. This positive temperature gradient, together with a decreasing expansion velocity of the bubble, results in a sharp decrease of the Mach number of the shock fronts. A consequence is the appearance of sound waves instead of sharp shock fronts. These waves can be recognized as archs in the kinetic energy map in Fig. 2 (right), and were detected by Graham et al. (2008).
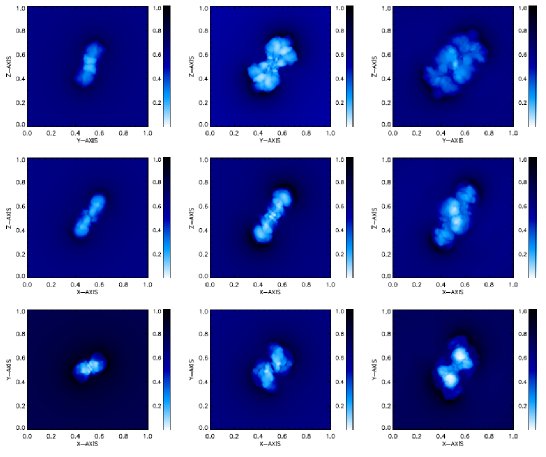
In Fig. 3 we present the emission maps obtained for three different lines of sight - along x (first row), y (center row) and z directions (third row). Columns 1-3 represent the evolutionary stage at , and . The emission measure was normalized by its maximum value calculated for each frame. It is noticeable the difference in observed morphology depending on the orientation of the line of sight. It occurs because of the twisted shape of the cavities due to the precessing jets. The inflated bubbles typically detach from the rest of the forming structure at .
The simulated jets inflated the bubbles in timescales of Myrs when they detach, at a distance kpc away from the core. At this specific time, the cavities present an average diameter kpc. This value is in a good agreement with the analytical approximation for jet inflated bubbles (see Eq. 3 in Soker [2004]).
Compared to previous numerical simulations of the evolution of rising bubbles, where artificial bubbles are introduced in the ICM, (e.g. Bruggen, Sccanapieco & Heinz 2009), the cavities created self-consistently in our simulations are stable for longer periods. Basically, the jet is able to continuously input energy into the bubbles, at least until detachment. Also, the rising speed of a continuously inflatted bubble is smaller, reducing the Rayleigh-Taylor instability effect (Sternberg & Soker 2008b).
3.1 Simulations versus observed data
As discussed above, using a simple model of exponential decay for , it was possible to constrain the empirical thresholds of and , in order to obtain two misaligned pairs of bubbles. However, to compare with the observed maps, a more detailed evolution of the precession is needed. Using Eq. 1, we determined the basic physical parameters of the system that lead to the given thresholds for the initial precession angle of the jet, as well as the decaying timescale. It was possible to reproduce the needed and for and , in Eq. 1. For smaller values of it was not possible to obtain , while for counter alignment occurred instead. For each value of the ratio determines the alignment timescale (), which is well constrained. From Eq. 1 we obtained the variation of as a function of time calculated from Eq. 1, assuming and - the best set of parameters based on the threshold given by the simulations. The tilt angles and are also obtained, which are respectively the angles between and in relation to the x-direction defined by .
A new simulation (Model #13) was run using a finer resolution ( cells) and the time evolution of given by Eq. 1. In order to best reproduce the observed X-ray and radio maps we varied the orientation of the line of sight and calculated the emission measure, to account for the X-ray synthetic map, and integrated the temperature distribution to track the jet and its energetic particles, which could be comparable to the observed synchrotron radio maps, if the structure of the magnetic fields is not complex. The best match between the observed and synthetic maps occurred for a specific line of sight inclined with respect to the total angular momentum of the system.
In Fig. 4 we included the observed 328 MHz VLA radio map of 3C 84 (a) and the deep CHANDRA observations of the extensive X-ray emission map surrounding NGC1275 (b) (Fabian et al. 2003), which can be compared to the temperature integrated map (c) and the emission measure (d), respectively, for this specific line of sight.
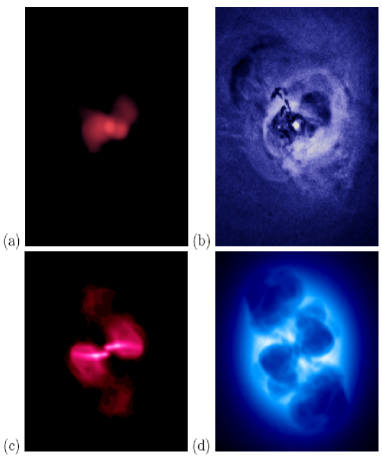
Visually, the X-ray map is well reproduced by the simulations, except for the fact that the farthest pair of bubbles is well aligned in the simulations. In the observed maps there is a slight misalignment of the “ghost cavities”. This may be related to complex motions of the ICM. The internal cavities are in very good agreement with the observations. Compared to the radio maps, the projected energy of particles is also similar. In this synthetic map the jets seem to be misaligned. Actually, this is an effect of projection. At the core, the jet points almost towards the observer. The result is the formation of two hot spots in the SW - NE direction.
This comparison is not straightforward. A self-consistent distribution of the magnetic field is required in order to accurately calculate the synchrotron radio emission of the jets. Full MHD simulations can be used in the near future for this purpose. Qualitatively, we expect the magnetic energy to decrease with radius, and the magnetically weighted maps of projected particle energy would provide stronger emission closer to the AGN. In this case, the map presented in Fig. 4c would be more similar to Fig. 4a. If the simulations truly corresponds to the actual scenario of NGC 1275, the timescale used for the synthetic maps, , reveals that we may expect a current precession angle , and an evolutionary age of about 100-150 Myrs for the two pairs of bubbles.
4 Conclusions
In this work we have studied the role of precessing AGN jets, and the evolution of the precession angle with time, on the morphology of the inflated cavities of NGC 1275, in the Perseus Cluster. For that, we used a number of hydrodynamical simulations of the ICM plasma interacting with precessing jets. We varied the precession angle as well as the jet alignment timescales. We found that, in order to reproduce the morphology of cavities observed in this system, a precession angle as large as is required during a timescale of at least 3 precession periods. In such conditions, the jets are responsible for the inflation of two pairs of bubbles, as seen in NGC 1275. It is worth to mention the interesting agreement between this value and the jet half opening angle predicted by Soker (2004), and Sternberg & Soker (2009) in terms of precessing jets in 2.5D simulations. We also found that the condition is required for the inflation of fat bubbles (Sternberg & Soker [2008a]).
The synthetic emission measure obtained from the simulations matches the morphologies of the cavities observed in X-rays if the line of sight is inclined by with respect to the total angular momentum of the system. Also, the projected temperature matches the synchrotron emission map, though a magnetic field distribution would be required for a direct, and more precise, comparison. From the simulations, and assuming the Bardeen-Peterson effect to be dominant in this system, we were also able to estimate the current precession angle of the AGN jet, , and its age, Myrs.
We were unable to identify from these simulations other complex structures observed in NGC 1275 such as its filamentary structure detected in Hα, though this may be related to internal turbulence excited by SNe or recent mergers, as shown in Falceta-Gonçalves et al. (2010).
References
- Bardeen & Petterson (1975) Bardeen, J. M., Petterson, J. A. 1975, ApJ, 195, L65
- Bruggen, Sccanapieco & Heinz (2009) Bruggen, M., Sccanapieco, E. & Heinz, S. 2009, ApJ, 395, 2210
- Burkhart et al. (2009) Burkhart, B., Falceta-Gonçalves, D., Kowal, G., Lazarian, A. 2009, ApJ, 693, 250
- Caproni, Mosquera Cuesta & Abraham (2004) Caproni, A., Mosquera Cuesta, H. J., Abraham, Z. 2004, ApJ, 616, L99
- Caproni et al. (2006) Caproni, A., Livio, M., Abraham, Z., Mosquera Cuesta, H. J. 2006, ApJ, 653, 112
- Caproni et al. (2007) Caproni, A., Abraham, Z., Livio, M., Mosquera Cuesta, H. J. 2007, MNRAS, 379, 135
- Chen, Wu & Yuan (2009) Chen, L., Wu, S., Yuan, F. 2009, MNRAS, 398, 1900
- Dunn, Fabian & Sanders (2006) Dunn, R. J. H., Fabian, A. C., Sanders, J. S. 2006, MNRAS, 366, 758
- Fabian et al. (2003) Fabian A.C., Sanders J.S., Allen S.W., Crawford C.S. Iwasawa K., Johnstone R.M., Schmidt R.W. & Taylor G.B. 2003, MNRAS, 344, 43
- Falceta-Gonçalves, Lazarian & Kowal (2008) Falceta-Gonçalves D., Lazarian A. & Kowal G. 2008, ApJ, 679, 537
- Falceta-Gonçalves et al. (2010) Falceta-Gonçalves D., de Gouveia Dal Pino E. M., Gallagher J. S. & Lazarian A. 2010, ApJL, 708, 57.
- Fragile & Anninos (2005) Fragile, P. C. & Anninos, P., 2005, ApJ, 623, 347
- Gnat & Sternberg (2007) Gnat O. & Sternberg A. 2007, ApJ, 168, 213
- Graham et a. (2008) Graham J., Fabian A. C. & Sanders J. S. 2008, MNRAS, 386, 278
- Heinz et al. (2006) Heinz, S., Bruggen, M., Young, A. & Levesque, E. 2006, MNRAS, 373, 65
- King et al. (2005) King, A. R., Lubow, S. H., Ogilvie, G. I., Pringle, J. E. 2005, MNRAS, 363, 49
- Leão et al. (2009) Leão, M. R. M., de Gouveia Dal Pino, E. M., Falceta-Gonçalves, D.,Melioli, C., Geraissate, F. 2009, MNRAS, 394, 157
- Liu & Melia (2002) Liu, S., Melia, F. 2002, ApJ, 573, L23.
- Martin, Pringle & Tout (2007) Martin, R. G., Pringle, J. E., Tout, C. A. 2007, MNRAS, 381, 1617
- Navarro, Frenk & White (1996) Navarro J. F., Frenk C. S. & White S. D.M. 1996, ApJ, 462, 563
- O’Neill & Jones (2010) O’Neill, S. M. & Jones, T. W. 2010, ApJ, 710, 180
- Pizzolato & Soker (2006) Pizzolato, F. & Soker, N. 2006, AdSpR, 36, 762
- Sanders et al. (2004) Sanders J. S., Fabian A. C., Allen S. W. &Schmidt R. W. 2004, MNRAS, 349, 952
- Scannapieco & Bruggen (2008) Scannapieco, Evan; Br ggen, Marcus 2008, ApJ, 686, 927
- Scheuer & Feiler (1996) Scheuer P. A. G., Feiler R. 1996, MNRAS, 282, 291
- Soker (2004) Soker, N. 2004, A&A, 414, 943
- Sternberg, Pizzolato & Soker (2007) Sternberg, A., Pizzolato, F. & Soker, N. 2007, ApJ, 656, L5
- Sternberg & Soker (2008a) Sternberg, A. & Soker, N. 2008a, MNRAS, 384, 1327
- Sternberg & Soker (2008b) Sternberg, A. & Soker, N. 2008b, MNRAS, 389, L13
- Sternberg & Soker (2009) Sternberg, A. & Soker, N. 2009, MNRAS, 398, 422
- Vernaleo & Reynolds (2006) Vernaleo, J. C. & Reynolds, C. S. 2006, MNRAS, 645, 83
- Walker et al. (2000) Walker, R. C., Dhawan, V., Romney, J. D., Kellermann, K. I., Vermeulen, R. C. 2000, ApJ, 530, 233