Zn-impurity effects on quasi-particle scattering in La2-xSrxCuO4 studied by angle-resolved photoemission spectroscopy
Abstract
Angle-resolved photoemission measurements were performed on Zn-doped La2-xSrxCuO4 (LSCO) to investigate the effects of Zn impurities on the low energy electronic structure. The Zn-impurity-induced increase in the quasi-particle (QP) width in momentum distribution curves (MDC) is approximately isotropic on the entire Fermi surface and energy-independent near the Fermi level (). The increase in the MDC width is consistent with the increase in the residual resistivity due to the Zn impurities if we assume the carrier number to be 1- for =0.17 and the Zn impurity to be a potential scatterer close to the unitarity limit. For =0.03, the residual resistivity is found to be higher than that expected from the MDC width, and the effects of antifferomagnetic fluctuations induced around the Zn impurities are discussed. The leading edges of the spectra near (,0) for =0.17 are shifted toward higher energies relative to with Zn substitution, indicating a reduction of the superconducting gap.
pacs:
74.25.Jb, 71.18.+y, 74.72.Dn, 79.60.-iI Introduction
Zn substitution for Cu atoms in the CuO2 planes for the high- cuprates causes a dramatic reduction of and thus may offer an opportunity to characterize the nature of the superconducting states in the cuprates. Zn is a nonmagnetic impurity with a closed shell and produces a large in-plane residual resistivity while the temperature-slope of the resistivity is unchanged.Fukuzumi Quantitative analysis of the residual resistivity indicates that the Zn impurity acts as a potential scatterer in the unitarity limit. To understand the microscopic mechanism of the scattering by the Zn impurities, the local information around the Zn impurities has been extensively studied. Reduction of superfluid density by Zn impurities were detected by SR Nachumi and a “Swiss cheese” model, in which non-superconductivity islands are induced around the Zn impurities, was proposed to explain the reduction of the superconducting fraction proportional to the Zn concentration. This model is consistent with the observation by scanning tunneling microscopy (STM) that the superconductivity is locally destroyed by Zn impurities.PanSTM Also, according to NMR studies, it was found that antiferromagnetic moment is induced around the Zn impurity.Julien While these experimental results have given insight into the local electronic structure around the impurity, Zn impurity effects in momentum space, which are more directly related to the transport properties, is still poorly understood.
In order to elucidate details of impurity scattering in momentum space as well as the mechanism of the reduction of induced by impurity, direct observation of the quasi-particle (QP) under the influence of Zn impurities should give useful information. Previous angle-resolved photoemission (ARPES) studies indicated that in Bi2Sr2CaCu2O8+δ(Bi2212) Zn and Ni impurities reduces the coupling strength to Boson excitation which leads the “kink” in the QP dispersion.Terashima ; Zabolotnyy Also, the depression of the superconducting coherence peak by Zn impurities has been observed,Terashima ; Zabolotnyy ; TerashimaZnLSCO ; Nishina consistent with the decrease in the superfluid density.Nachumi In this work, we shall focus on the impurity effects on the QP in La2-xSrxCuO4 (LSCO), particularly, on the relationship between the and the observed increase in the widths of momentum distribution curves (MDC) in relation to the scattering mechanism of QP in the normal state. In particular, the effects of antiferromagnetic fluctuations locally induced by the Zn impurities shall be discussed.

II Experiment
High-quality single crystals of Zn-doped and Zn-free LSCO were grown by the traveling-solvent floating-zone method. Figure 1 shows the temperature dependence of the electrical resistivity and the Hall coefficient of samples studied in the present work. The Zn-free and 2 % Zn-doped samples with hole content of = 0.17 have critical temperatures (’s) of 40 K and 22 K, respectively. The Zn-free and 3 % Zn-doped = 0.03 samples are non-superconducting. With Zn-doping, the residual resistivity increases for both =0.03 and 0.17 samples, while the temperature slope of does not change with the Zn impurities for the =0.17 sample. The “carrier number” defined by for =0.03 is close to the nominal hole concentration, but decreases by 20 % with 3% Zn-doping. The ARPES measurements were carried out at beamline 10.0.01 of Advanced Light Source (ALS) and beamline 5-4 of Stanford Synchrotron Radiation Laboratory (SSRL), using incident photons with energies of 55.5 eV and 22.4 eV, respectively. The total energy resolution was about 15 meV (SSRL) or 20 meV (ALS). The momentum resolutions at ALS and SSRL are 0.02 and 0.01 in units of 1/, respectively, where =3.8 Å is the lattice constant. The samples were cleaved in situ and measurements were performed at about 20 K (ALS) or 10 K (SSRL). In the measurements at ALS, the electric vector of the incident photons lied within the CuO2 plane, 45 degrees rotated from the Cu-O direction and was parallel to the Fermi surface segment in the nodal region. This measurement geometry enhances dipole matrix elements in this region because the wave function has symmetry.yoshidaOD The in the measurements at SSRL was nearly parallel to the Cu-O direction.
III Results and discussion
III.1 Zn-impurity effects on the quasi-particle
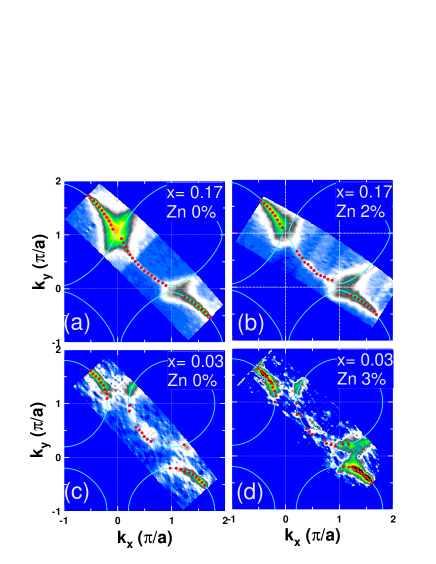
First, in order to see the effects of Zn impurities on the shape of the Fermi surface, momentum-space spectral weight mapping at the Fermi level () is shown in Fig. 2. We have determined the Fermi momentum () of the (underlying) Fermi surfaces by using the peak positions of the MDC’s, as represented by dots.shadow The positions thus determined, which designate the shape of the Fermi surfaces, could be well fitted to the Fermi surface of the tight-binding model as shown by solid curves. Both for =0.03 and 0.17, the tight-binding parameters are almost identical between the Zn-doped and Zn-free samples (=-0.120, for =0.03 and =-0.135, for =0.17), indicating that the Zn substitution does not change the overall electronic structure and the hole concentration appreciably. Although for =0.03 shown in Fig. 1(b) suggests a decrease of the hole concentration with Zn doping by 20%, we could not detect this signature in the present experiment since the corresponding change is a very small portion of the Fermi surface area (1%).

Nevertheless, Zn-impurity effects are clearly seen in the spectral line shapes of the energy distribution curves (EDC’s). Figure 3 shows EDC’s in the nodal direction [(0,0)-(,)] in the second Brillouin zone. Clear QP peaks are observed near in the Zn 0% =0.17 and 0.03 samples [panels (a) and (c), respectively]. With Zn substitution, the peak is significantly depressed [panels (b) and (d)]. As indicated by vertical arrows, a characteristic dip at 70 meV, which corresponds to the “kink” is prominent for the =0.03 spectra. The dip feature still remains at almost the same binding energy with Zn-doping.
To clarify the impurity effects on the QP spectral weight, the EDC’s at have been symmetrized with respect to as shown in Fig. 3(e). These spectra have been normalized to the spectral weight between -0.2- -0.1 eV below the . For both the Zn-free and Zn-doped =0.17 samples, the symmetrized EDC’s show a clear QP peak at the point although the QP intensity decreases with Zn-doping. The existence of a clear QP peak even for the Zn-doped sample may be related with the persistence of superconductivity with = 22 K. On the other hand, the QP peak is strongly depressed in the Zn-doped =0.03 sample. Particularly, the symmetrized EDC at show a shallow dip at , indicating the destruction of the nodal QP and a possible pseudogap opening. Note that the pseudogap on the energy scale of 10 meV caused by charge localization was observed in the optical conductivity measurement of LSCO (=0.03) at low temperature.Dumm The observed pseudogap-like feature of similar magnitude in the EDC of the =0.03 Zn 3 % sample would therefore be related to the localization behavior at low temperature of the electrical resistivity as seen in Fig. 1. The integrated MDC spectra along the nodal direction in Fig. 3(f) for both hole concentrations also show suppression of the spectral weight by the Zn impurities.
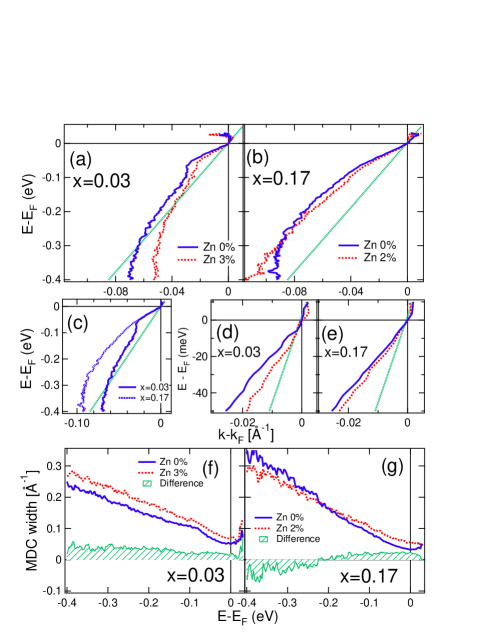
In Fig. 4, we summarize the dispersion of the QP peak in MDC’s and the energy dependence of the MDC width in the nodal direction. Both the = 0.03 and 0.17 samples show a kink at 70 meV [panels (a),(b)]. In Fig. 4(c), one can confirm that the Fermi velocity for the Zn-free samples does not change with hole doping, i.e., the universal Fermi velocity.ZhouNature By contrast, the slopes of the energy dispersions near slightly increases with Zn-doping as shown in panels (a) and (b). Panel (d) indicates that the slope of the dispersion within 20 meV of becomes steeper in = 0.03 Zn 3%, which however may be an artifact due to the (pseudo) gap opening [Fig.3(d)]. Indeed, such an effect is absent in the =0.17 samples [panel(e)].
Next, let us look at the effect of Zn impurities on the MDC width in the nodal direction [Figs. 4(f) and 4(g)]. The MDC width shows a characteristic drop below the kink energy of 70 meV, especially for the =0.03 samples, indicating a reduction of the scattering rate of QP by collective modes below the mode energy. Below the kink energy, the Zn-induced increase in the MDC width is energy independent as clearly indicated by the difference between the Zn-doped and Zn-free data. Since the MDC width increases with decreasing mean-free path through the extra scattering due to the impurity, the energy-independent increase in the MDC width is consistent with the temperature-independent increase in the resistivity caused by the Zn impurities.
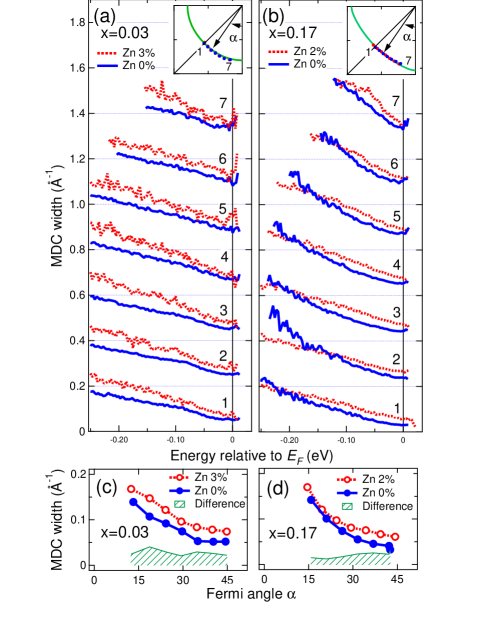
In order to see the momentum dependence of the increase in the MDC on the Fermi surface, the MDC widths at various ’s are shown in Fig. 5. The energy dependence of the MDC width is compared between the Zn-doped and Zn-free samples in Figs. 5(a) and 5(b), and the MDC width at is plotted in Figs. 5(c) and 5(d) as a function of the Fermi angle . Also, the differences of the MDC width between the Zn-free and Zn-doped samples are plotted on the same panels. These plots indicate that the increase in the MDC width by the Zn impurity is almost isotropic on the Fermi surface. Thus, on the low energy scale ( 70 meV), the contribution of the impurity to the MDC width is energy- and momentum-independent, indicating that the Zn impurity is a nearly static and isotropic scatterer. As a results of the momentum independent increase in the MDC width, the relative increase in the MDC width for 2-3% Zn substitution is 10-20% in the anti-node direction and 50-100% in the node direction. Because the pseudogap size mainly determines the -axis transport properties in underdoped samples, the small relative increase in the MDC width in the antinodal region compared to the nodal region may explain the fact that the out-of-plane transport is less affected by the Zn impurities than the in-plane transport.Mizuhashi
III.2 Comparison with transport properties
Since the MDC width is equal to the inverse of the mean free path, here, we shall compare the transport properties with the MDC width deduced from the present ARPES results. The mobility can be derived from the in-plane resistivity and the carrier density if the Drude formula is assumed. We have assumed that is given by and for =0.03 and 0.17, respectively, because the Hall coefficientAndoHall ; OnoHall as well as the residual resistivity of Zn-doped LSCOFukuzumi show a crossover from to around =0.1. From the ARPES data, the inverse mobility can be calculated using the formula , where is the MDC width. As the observed MDC width is influenced by the finite angular and energy resolutions, we have subtracted the angular broadening 0.01 Å-1 from the measured MDC widths. When the Fermi surface has a pseudo-gap as in the underdoped region, since the QP’s in the node region dominate the in-plane transport, the evaluated would be that of the node region. As for the slightly overdoped =0.17 samples, too, the scattering rate is the lowest in the nodal region, as can be seen from the smallest MDC width in this region [see Fig. 5(d)]. Therefore, the evaluated is largely determined by the nodal QP’s.
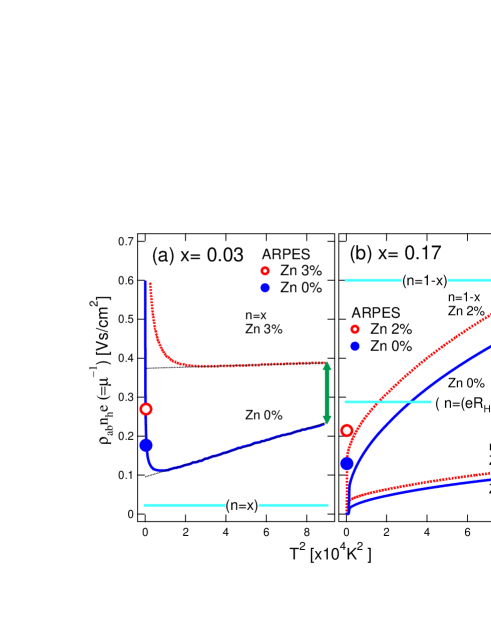
In Fig. 6, we compare the Zn-induced increase in the inverse mobility obtained from the transport and present ARPES results.mdc From the measurements of the electrical resistivity of the present samples, the inverse-mobility , with (=0.03) or (=0.17), is found to increase with Zn doping by 0.16 and 0.098 Vs/cm2 for =0.03 and 0.17, respectively, at 300 K. From the MDC width at in the nodal direction (Fig. 4), the Zn-induced increase in are 0.022 and 0.020 Å-1 for the = 0.03 and 0.17 samples, respectively. Using the increase in and the formula , the increase in for =0.03 and 0.17 samples are calculated to be 0.093 and 0.085, respectively. Here, 0.64 Å-1 measured from () was deduced from ARPES. Therefore, for the =0.17 samples, the obtained Zn-induced increase in the values from the transport and ARPES results are quantitatively consistent if we assume . On the other hand, for the =0.03 samples, the increase in from ARPES is smaller than that estimated from the transport.
In general, transport and ARPES measurements detect different scattering processes of QP in different weight. The scattering rate by impurities in transport is given by , where is the scattering angle and is the scattering potential.Mahan Because of the factor 1- in the integrand, the main scattering process stems from backward scattering. On the other hand, the scattering rate in ARPES () is , where is the self-energy and is the renormalization factor, indicating that both backward scattering and forward scattering equally contribute. It should be noted that, in the unitarity limit, and should be the same due to the -independence of the scattering amplitude. Since the Zn-induced increase in from the transport (assuming ) and ARPES results for =0.17 samples show almost the same value of Vs/cm2, one can conclude that the scattering by the Zn impurities in the =0.17 samples are in the unitarity limit. This is consistent with the in-plane resitivity resultsFukuzumi and with the conclusion reached by an STM study.PanSTM
For the =0.03 samples, on the other hand, the increase in from ARPES is smaller than that from transport (which is extrapolated from the high temperature region in order to eluminate the localization effect). This cannot be understood within the unitary scattering picture. Here, let us consider the effects of antiferromagnetic correlations induced around the impurity atom.Julien Theoretically, vertex correction from the antiferromagnetic fluctuations may cause an enhancement of the resistivity compared to that calculated based on Boltzmann equation.Kontani Since the present estimate from the ARPES data is based on Boltzmann transport theory, the smaller estimated from ARPES than that from the transport indicates that the QP scattering rate has a peculiar momentum dependence with a maximum occuring in the backward scattering direction. Such a situation may be realized if scattering by the low-energy antiferromagnetic fluctuations induced by the Zn impurities is dominant in the QP scattering in the =0.03 samples.
In two dimensional metals like high- cuprates, whether a dirty system become a superconductor or not is determined by the normal-state critical sheet resistance.Emery In both Zn 0% and 3% =0.03 samples, it is clear that the inverse mobilities obtained by the ARPES and transport studies are much higher than critical universal 2D value, and therefore, the system indeed goes into the localization phase. This explains the absence of superconductivity in the Zn-free =0.03 samples, although it shows a clear QP in the vicinity of near the node direction. It is likely that a tiny gap is opened in the nodal direction [Fig. 3(e)], as pointed out in previous report on the lightly-doped cuprates.KMShenPRB With Zn-doping, the QP peak is significantly depressed as shown in Figs. 3(e) and 3(f), a signature of carrier localization which starts at higher temperature. Note that a pseudogap on the low energy scale of 10 meV was observed in the optical conductivity measurement and indicated localization at low temperatures.Dumm In the Zn 2% =0.17 samples, the inverse mobility obtained by ARPES are lower than the universal resistivity, which accords with the persistence of the superconductivity in this sample. One can infer that, with a few more percent Zn-doping, the inverse mobility would reach that of the universal resistivity and the system would enter the non-superconducting phase.
III.3 Zn-impurity effects in the anti-nodal region
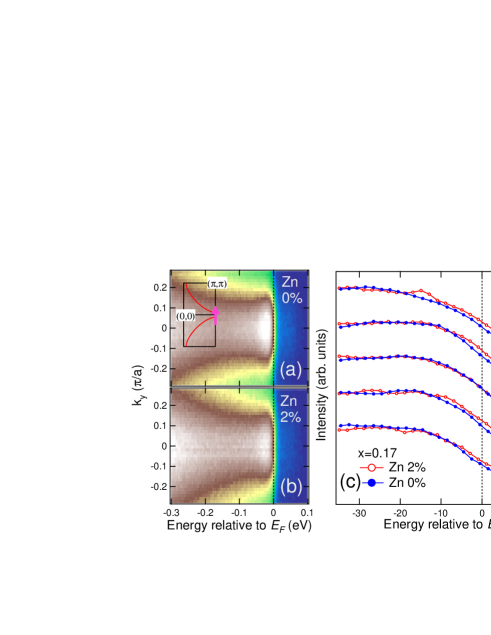
Finally, we discuss Zn impurity effects on the spectra in the antinodal region, where the opening of the superconducting gap is expected below . Figure 7 shows EDC’s along the (,0)-(,) line of the = 0.17 samples measured at SSRL. At the point with , the EDCs of the Zn-doped sample are slightly shifted toward higher energies relative to compared to the Zn-free sample. Because the pseudogap state has been reported to be stabilized by out-of-plane disorder,Okada if in-plane and out-of-plane disorder have similar effects on the pseudogap, the observed shift is unlikely to be a reduction of the pseudogap. Instead, the shift may be understood as a reduction of the superconducting gap, because such a reduction by Zn impurity has also been observed in Zn-doped Bi2212.Nishina However, the decrease of the gap by Zn-doping is only 1-2 meV, which is much smaller than that ( 4 meV) expected from the decrease of by 20 K. Furthermore, the observed gap size is too small compared with that estimated from the -wave BCS theory 8 meV for the Zn-free samples with the 40 K.Maki Note that, for =0.15 samples, an indication of the leading edge gap of 10 meV was reported in previous studies although no clear coherence peak was seen around TerashimaLSCO even using higher energy resolution than the present one. Therefore, the superconducting gap identified in this study may be opened on top of the pseudo gap and hence is probably blurred compared to an ideal superconducting gap. More detailed systematic studies are necessary to characterize the weak superconductivity in the antinodal region.
IV Conclusion
In summary, we have studied Zn-impurity effects on the near electronic states of LSCO and discussed their relationship to the transport properties. We have observed an isotropic increase in the MDC width as well as the suppression of spectral weight in the low energy part of the spectra. For slightly overdoped =0.17, the increase in the MDC width is close to that expected from the unitary limit of the impurity scattering and explains the increase in the in-plane residual resistivity. For the lightly doped =0.03, we found that the residual resistivity is larger than that expected from the MDC width. We propose that backward scattering due to antiferromagnetic fluctuations may be enhanced compared to forward scattering. We have confirmed that superconductor-to-localization behavior is caused by the increase in the MDC width up to the universal resistivity in the underdoped region.
Acknowledgment
We are grateful to Y. Yanase for enlightening discussions. This work was supported by a Grant-in-Aid for Scientific Research in Priority Area “Invention of Anomalous Quantum Materials”, and a Grant-in-Aid for Young Scientists from the Ministry of Education, Science, Culture, Sports and Technology. Y. A. was supported by KAKENHI 19674002 and 20030004. ALS is operated by the Department of Energy’s (DOE) Office of Basic Energy Science, Division of Materials Science. SSRL is operated by the DOE Office of Basic Energy Science Divisions of Chemical Sciences and Material Sciences.
References
- (1) Y. Fukuzumi, K. Mizuhashi, K. Takenaka, and S. Uchida, Phys. Rev. Lett. 76, 684 (1996).
- (2) B. Nachumi, A. Keren, K. Kojima, M. Larkin, G. M. Luke, J. Merrin, O. Tchernyshov, and Y. J. Uemura, Phys. Rev. Lett. 77, 5421 (1996).
- (3) S. H. Pan, E. W. Hudson, K. M. Lang, H. Eisaki, S. Uchida, and J. C. Davis, Nature 403, 746 (2000).
- (4) M.-H. Julien, T. Fehér, M. Horvatić, C. Berthier, O. N. Bakharev, P. Ségransan, G. Collin, and J.-F. Marucco, Phys. Rev. Lett. 84, 3422 (2000).
- (5) K. Terashima, H. Matsui, D. Hashimoto, T. Sato, T. Takahashi, H. Ding, T. Yamamoto, and K. Kadowaki, Nature Physics 2, 27 (2006).
- (6) V. B. Zabolotnyy, S. V. Borisenko, A. A. Kordyuk, J. Fink, J. Geck, A. Koitzsch, M. Knupfer, B. Buchner, H. Berger, A. Erb, C. T. Lin, B. Keimer, and R. Follath, Phys. Rev. Lett. 96, 037003 (2006).
- (7) K. Terashima, T. Sato, K. Nakayama, T. Arakane, T. Takahashi, M. Kofu, and K. Hirota, Phys. Rev. B 77, 092501 (2008).
- (8) S. Nishina, T. Sato, T. Takahashi, S.-C. Wang, H.-B. Yang, H. Ding, and K. Kadowaki, J. Phys. Chem. Sol. 63, 1069 (2002).
- (9) T. Yoshida, X. J. Zhou, M. Nakamura, S. A. Kellar, P. V. Bogdanov, E. D. Lu, A. Lanzara, Z. Hussain, A. Ino, T. Mizokawa, A. Fujimori, H. Eisaki, C. Kim, Z.-X. Shen, T. Kakeshita, and S. Uchida, Phys. Rev. B 63, 220501(R) (2001).
- (10) Shadow bands seen in the first Brillouin zone in panels (c) and (d) are not considered in the present analysis because these bands may be extrinsic structures. The origin of the “shadow band” is disscussed in A. Koitzsch et al., Phys. Rev. B 69, 220505(R) (2004), in terms of structual effects.
- (11) M. Dumm, S. Komiya, Y. Ando, and D. N. Basov, Phys. Rev. Lett. 91, 077004 (2003).
- (12) X. J. Zhou, T. Yoshida, A. Lanzara, P. V. Bogdanov, S. A. Kellar, K. M. Shen, W. L. Yang, F. Ronning, T. Sasagawa, T. Kakeshita, T. Noda, H. Eisaki, S. Uchida, C.T. Lin, F. Zhou, J. W. Xiong, W. X. Ti, Z. X. Zhao, A. Fujimori, Z. Hussain, and Z. X. Shen, Nature 423, 398 (2003).
- (13) K. Mizuhashi, K. Takenaka, Y. Fukuzumi, and S. Uchida, Phys. Rev. B 52, R3884 (1995).
- (14) Y. Ando, Y. Kurita, S. Komiya, S. Ono, and K. Segawa, Phys. Rev. Lett. 92, 197001 (2004).
- (15) S. Ono, S. Komiya, and Y. Ando, Phys. Rev. B 75, 024515 (2007).
- (16) If the surface qualities and the experimental conditions are nearly the same between the Zn-free and the Zn-doped samples, the increase of the MDC width can be quantitatively attributed to by the Zn impurity scattering.
- (17) G. D. Mahan, Many-Particle Physics, 2nd ed. (Plenum, New York and London, 1990).
- (18) H. Kontani, K. Kanki, and K. Ueda, Phys. Rev. B 59, 14723 (1999).
- (19) V. J. Emery and S. A. Kivelson, prl 74, 3253 (1995).
- (20) K. M. Shen, T. Yoshida, D. H. Lu, F. Ronning, N. P. Armitage, W. S. Lee, X. J. Zhou, A. Damascelli, D. L. Feng, N. J. C. Ingle, H. Eisaki, Y. Kohsaka, H. Takagi, T. Kakeshita, S. Uchida, P. K. Mang, M. Greven, Y. Onose, Y. Taguchi, Y. Tokura, Seiki Komiya, Yoichi Ando, M. Azuma, M. Takano, A. Fujimori, and Z.-X. Shen, Phys. Rev. B 69, 054503 (2004).
- (21) Y. Okada, T. Takeuchi, T. Baba, S. Shin, and H. Ikuta, J. Phys. Soc. Jpn. 77, 074714 (2008).
- (22) H. Won and K. Maki, Phys. Rev. B 49, 1397 (1994).
- (23) K. Terashima, H. Matsui, T. Sato, T. Takahashi, M. Kofu, and K. Hirota, Phys. Rev. Lett. 99, 017003 (2007).