Controlling growth of nanorod via screening effects
Abstract
We demonstrate in this report that nanorods can spontaneously grow on the top of a transient mound when the screening effect is considered in island growth. The number of the topmost growing layers is defined as the active length, which decreases as the screening effect is enhanced. It follows that the thickness of the transient mound underneath the nanorod increases as the square of the active length, and a smaller active length favors the formation of nanorod.
pacs:
61.46.-w, 68.65.Ac, 68.55.-aDue to the size confinement of nanorods, their unique electric and optical properties make them prospective materials for device applications in nanoelectronics and nanophotonics Kuchibhatla et al. (2007); Huang et al. (2009); Gonzalez-Valls and Lira-Cantu (2009). However, controlling the growth of nanorod is usually tricky, and the understanding of the associated growth mechanism remains a challenging task. In metallic growth system, for example, in the absence of catalysts, instead of generating nanorods, very often a structure calld ”wedding-cake” or ”mound” is generated Zuo and Wendelken (1997); Krug et al. (2000). To solve this problem, oblique angle deposition is normally used, in which the upmost surface features shadow nearby lower surface regions where the incident atoms cannot reach Zhou and Huang (2008); Wang and Huang (2005); Ye et al. (2004); Tang et al. (2005). In addition, in some systems the long-range attractive forces between the incoming atoms and grown structure inherently steer the incident atoms to the upper growth sites, and hence stimulate the growth of nanorods in these regions Wang (2004). The essential feature in these two scenarios is that the topmost structures are superior in capturing incoming atoms. Here we term such a phenomenon as the screening effect. In fact, it is a well established effect in Laplacian growth: Among the protruding growing parts, the front-most tips get more nutrients and hence grow faster. Although screening effect has been observed to suppress the growth of those being trapped behind and thus form more ordered filament structures Wang et al. (2001); Witten and Sander (1983), the quantitative understanding of the screening effect in the interfacial growth, especially the role of screening effect in keeping the geometrical shape of the nanorods, has not been well addressed so far to the best of our knowledge.
In general, interfacial growth involves landing and accommodation of atoms on the surface, diffusion of adatoms on the surfaces, nucleation, and formation of a new crystalline layer by lateral expansion of the nucleus. The screening effect influences the landing positions of the deposit atoms, and surface diffusion promotes their redistribution. So both screening effect and surface kinetics govern the distribution of the adatoms on crystal surface, and affect the nucleation and growth processes. The influences of surface kinetics on the growth morphology and size of nanostructures have been extensively studied Zhang and Lagally (1997); Tersoff et al. (1994); Krug et al. (2000). Recently we also demonstrated the influence of surface kinetics on the growth mode and radius selection of nanorod growth Shu and et. al. .
In this report we focus on the influence of screening effect on the formation of nanorods with uniform cross-section size. Our calculations indicate that the nanorods can spontaneously grow on top of a transient mound when the screening effect has been considered in island growth. The number of the topmost growing layers is defined as the active length, which decreases as the screening effect is enhanced. Consequently, the thickness of the transient mound underneath the nanorod increases as the square of the active length, and a smaller active length favors the formation of nanorods.
Consider a growing stepped nanostructur with atomic layers. The dimensionless area of the substrate occupied by the nanostructure is denoted as , and that of the -th layer relative to the substrate is as . In island growth, the energy barrier at the step is usually larger than that within the terrace. The growth of a partially buried layer is maintained by the directly deposit atoms in the underneath layer, since the interlayer transport of the adatoms on the buried layers can be negligible. Assuming adatoms are deposited with rate in the normal direction of per surface lattice site. If there is no screening effect, the deposition is uniform on the surface, and all the layers can keep growing by capturing the deposit atoms. The opposite limiting case is that only the topmost layer is allowed to grow as a result of extremely strong screening effects. The more realistic situation is that the moderate strong screening effect leads to a finite number of the active layers, , the topmost layers which are active in capturing the deposit atoms. Correspondingly, only the topmost layers keep grow as the number of atomic layers adds up with deposition. Therefore the quantity can be regarded as a measure of the screening strength: The smaller is, the stronger the screening is. We refer hereafter as the active length.
By defining the dimensionless time as at deposition time , the coverage , which is defined as , increases with time according to the rate equation Krug et al. (2000); Krug (1997),
| (1) | |||
| (2) |
Since there are no sinks for atoms atop, the topmost terrace absorbs all the atoms landing on layers and , and grows according to
| (3) |
The influences of interlayer hoppting rate and the deposition rate are included into a characteristic coverage which is defined as , where is the dimensionless characteristic area according to Ref. Shu and et. al. . Starting from the substrate with area larger than , the coverage of the -th layer at different time can be obtained by integrating Eq. (2) with a time step . In this work, we use , and the influence of different is discussed later.
In the general situation of growth, the time interval between subsequent deposition events is much larger than the survival time of the adatom on . For the simplest situation where the smallest stable nucleus is a dimer, if a circular cross section is assumed, the nucleation rate on top of per unit time can be deduced Shu and et. al. . The corresponding nucleation rate per unit dimensionless time is . The random nucleation process is then modeled by introducing a uniform distributed random number between 0 and unit: Whenever is larger than the random number, a new layer is added atop and increases by one.
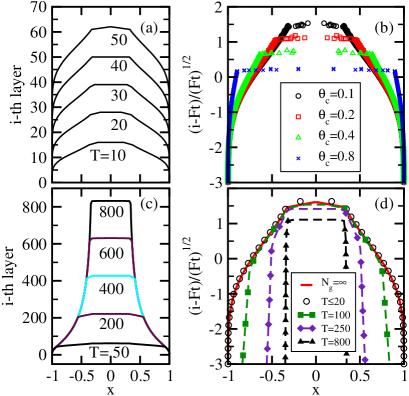
The variation of is recorded under specific growth conditions. The surface profiles without screening effect at different are shown in Fig. 1(a). The lateral position on the axis is proportional to . It shows that the number of the exposed layers increases with time. After re-scaling, the height profile of the mound converges to a time-independent asymptotic shape which only depends on , as shown in Fig. 1(b). This is a typical characteristic of the morphology known as wedding-cake Krug et al. (2000); Krug (1997).
The general evolvement of the surface profile when screening effect is introduced is shown in Fig. 1(c), where and . It indicates that the coverage decreases rapidly as a function of , until it approaches within transient layers. The corresponding re-scaled profiles at different are given in Fig. 1(d). It shows that the curve of is superposed on the the one without screening effect, which suggests that the island grows just as in the situation of infinite , keeping the well-known morphology of wedding-cake shape. Once is larger than , it is obvious that the re-scaled profiles in Fig. 1(d) gradually depart from the wedding-cake one, since the bottom layers cease growing.
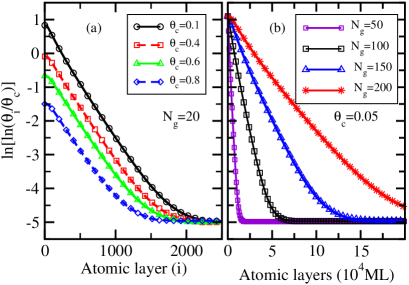
To identify the physical meaning of , we repeat the numerical simulations with different while keeping a constant. For the stable morphologies obtained after sufficient growth, we find that decreases approximately linearly as a function of , as shown in Fig. 2(a), until it decreases to a constant when , and then it remains. It suggests that a nanorod with area of is grown on top of the mound. The constant decreases with decreasing used in the simulations. When , which corresponds to a stable nanorod with area . It justifies the importance of as a characteristic area Shu and et. al. . Realistically, should always be integral in unit of , therefore decreases and approaches to as the limit. For the in nanoscale, is in the range of .
In order to study the quantitative influence of the screening effect, the variation of coverage for different is simulated by setting . The re-scaled coverage are shown in Fig. 2(b), as a function of . The main features are similar as that discussed above for in Fig. 2(a). The screening effect just changes the magnitude of the linear slope: When is increased as a result of weaker screening effect, the magnitude of the slope becomes smaller correspondingly.
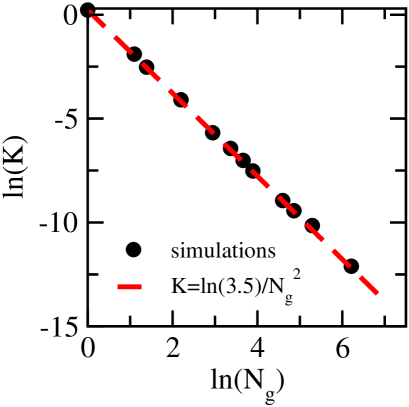
The dependence of slopes on can be obtained by fitting the linear region of the curves in Fig. 2(b). The results are plotted logarithmically in Fig. 3, where is positive denoting the magnitude of the slope. It reveals that is inversely proportional to ,
| (4) |
The area of is then obtained as,
| (5) |
The pow index becomes when , which is consistent with the analytic results in Ref. Shu and et. al. .
It is thus clear that starting from the substrate with cross sectional area larger than , a nanorod with area of is finally grown on top of a transient mound of layers. According to Eq. (5), the number of the transient layers is proportional to , with the coefficient . The value of is in the range of for from 0.001 to 0.9 and in nanoscale. The growth of a nanostructure therefore shows different feathers at different duration: Wedding-cake morphologies (), tapered morphologies () and nanorods with a tapered base () can be observed successively. determines the area of the approached nanorod, whereas the screening strength determines the transient layers, . At the limiting case when no screening exists, the well-known wedding cake morphology is obtained.
In conclusion, we have conducted simulations to study the screening effect on the nanorod growth. We found that a specific growth system can be well characterized as the characteristic area of and the active length . determines the area of the approached nanorod, whereas the screening strength influences the transition process from taper-like morphology to the nanorod, . Larger screening effect leads to smaller active length and favors nanorod growth. Therefore it is possible to control the nanorod growth process by tuning via varying the screening strength, for example by varying the deposition angle in oblique angle deposition.
This work was supported by NSF of China (10974079,10874068 and 10625417) and Jiangsu Province (BK2008012), MOST of China (2010CB630705 and 2006CB921804).
References
- Kuchibhatla et al. (2007) S. V. N. T. Kuchibhatla, A. S. Karakoti, D. Bera, and S. Seal, Prog. Mater Sci. 52, 699 (2007).
- Huang et al. (2009) X. H. Huang, S. Neretina, and M. A. El-Sayed, Adv. Mater. 21, 4880 (2009).
- Gonzalez-Valls and Lira-Cantu (2009) I. Gonzalez-Valls and M. Lira-Cantu, Energ. Environ. Sci. 2, 19 (2009).
- Zuo and Wendelken (1997) J. K. Zuo and J. F. Wendelken, Phys. Rev. Lett. 78, 2791 (1997).
- Krug et al. (2000) J. Krug, P. Politi, and T. Michely, Phys. Rev. B 61, 14037 (2000).
- Zhou and Huang (2008) L. G. Zhou and H. Huang, Phys. Rev. Lett. 101, 266102 (2008).
- Wang and Huang (2005) J. Wang and H. Huang, Nano. Lett. 5, 2505 (2005).
- Ye et al. (2004) D.-X. Ye, T. Karabacak, B. K. Lim, G.-C. Wang, and T.-M. Lu, Nanotechnology p. 817 (2004).
- Tang et al. (2005) F. Tang, T. Karabacak, P. Morrow, C. Gaire, G. C. Wang, and T. M. Lu, Phys. Rev. B 72, 165402 (2005).
- Wang (2004) Z. L. Wang, J. Phys.: Condens. Matter 16, R829 (2004).
- Wang et al. (2001) M. Wang, S. Zhong, X.-B. Yin, J.-M. Zhu, R.-W. Peng, Y. Wang, K.-Q. Zhang, and N.-B. Ming, Phys. Rev. Lett 86, 3827 (2001).
- Witten and Sander (1983) T. A. Witten and L. M. Sander, Phys. Rev. B 27, 5686 (1983).
- Zhang and Lagally (1997) Z. Y. Zhang and M. G. Lagally, Science 276, 377 (1997).
- Tersoff et al. (1994) J. Tersoff, A. W. D. van der Gon, and R. M. Tromp, Phys. Rev. Lett. 72, 266 (1994).
- (15) D. J. Shu and et. al., submitted.
- Krug (1997) J. Krug, J. Stat. Phys. 87, 505 (1997).