1\Yearpublication\Yearsubmission2010\Month\Volume\Issue
later
Can major solar flares excite high-frequency global waves in the Sun ?
Abstract
The study of low-degree high-frequency waves in the Sun can provide new insight into the dynamics of the deeper layers of the Sun. Here, we present the analysis of the velocity observations of the Sun obtained from the Michelson and Doppler Imager (MDI) and Global Oscillations at Low Frequency (GOLF) instruments on board Solar and Heliospheric Observatory (SOHO) spacecraft for the major flare event of 2003 October 28 during the solar cycle 23. We have applied wavelet transform to the time series of disk-integrated velocity signals from the solar surface using the full-disk Dopplergrams obtained from MDI. The wavelet power spectrum computed from MDI velocity series clearly shows that there is enhancement of high-frequency global waves in the Sun during the flare. We do observe this signature of flare in the Fourier Power Spectrum of these velocity oscillations. However, the analysis of disk-integrated velocity observations obtained from GOLF shows only feeble effect of flare on high-frequency oscillations.
keywords:
Sun: atmosphere – oscillations – flares1 Introduction
The normal modes of oscillations of the Sun peak in the frequency regime 2-4 mHz and are known as modes. Apart from the normal modes, researchers have found the presence of high-frequency oscillations (frequencies higher than the solar-photospheric acoustic cut off at 5.3 mHz) in the solar-acoustic spectrum (Libbrecht & Kaufman, 1988; Libbrecht, 1988; García et al., 1998; Chaplin et al., 2003; , Jiménez et al.2005; Karoff & Kjeldsen, 2008). Unlike the modes, the driving force for these high-frequency solar oscillations is still not clearly understood. On one hand, Balmforth & Gough (1990) suggest that the high-frequency waves are partly reflected by the sudden change in temperature at the transition region between the chromosphere and the corona, while Kumar & Lu (1991) explain these high-frequency waves as an interference phenomenon between ingoing and outgoing waves from a localized source just beneath the photosphere.
Just after the advent of helioseismology in 1970s, Wolff (1972) suggested that large solar flares can stimulate free modes of oscillation of the entire Sun, by causing a thermal expansion that would drive a compression front to move into the solar interior. First of all, Haber et al. (1988) reported an average increase in the power of intermediate-degree modes after a major flare (of class X13/3B) using a few hours of solar-oscillations data. However, Braun & Duvall (1990) could not detect acoustic-wave excitation from an X-class flare. Kosovichev & Zharkova (1998) reported the first detection of “solar quakes” inside the Sun, caused by the X2.6 flare of 1996 July 9. Following this result, Donea et al. (1999) found an acoustic source associated with a flare using seismic images produced with helioseismic-holography technique. Application of ring-diagram analysis showed that the power of the global modes appears to be larger in several flare-producing active regions as compared with the power in non-flaring regions of similar magnetic field strength (Ambastha et al., 2003).
Further, Donea & Lindsey (2005) have reported emission of seismic waves from large solar flares using helioseismic holography. Some of the large solar flares have been observed to produce enhanced high-frequency acoustic velocity oscillations in localized parts of active regions (Kumar & Ravindra, 2006). Venkatakrishnan et al. (2008) observed co-spatial evolution of seismic sources and H-alpha flare kernels and large downflows in the seismic sources during the flare event of 28 October 2003. A search for a correlation between the energy of the low-degree modes and flares using velocity observations of the Sun remained inconclusive (Foglizzo et al., 1998; Gavryusev & Gavryuseva, 1999; Chaplin et al., 2004; Ambastha & Antia, 2006). The study of low-degree high-frequency (LDHF) waves in the Sun is important as this can bring more constraints on the rotation profile between 0.1 and 0.2 (García et al., 2008; Mathur et al., 2008). The study of the effect of flares on such LDHF waves can provide a clue for the origin of these waves.
Recently, Karoff & Kjeldsen (2008) have reported that the correlation between X-ray flare intensity and the energy in the acoustic spectrum of disk-integrated intensity oscillations (as observed with VIRGO (Variability of Solar IRradiance and Gravity) (Fröhlich et al. (1995)) instrument on board SOHO) is stronger for high-frequency waves than for the well known 5-minute oscillations. In this study, we have searched for the effects of flares in the time series of disk-integrated velocity signals from the solar surface using the full-disk Dopplergrams obtained from the MDI instrument. We have also looked for these effects in disk-integrated velocity observations obtained from the GOLF (Global Oscillation at Low Frequency) (Gabriel et al., 1995, 1997) instrument on board SOHO. These studies have been applied to the major solar flare of 2003 October 28 (of class X17.6/4B) that occurred in the solar cycle 23. Wavelet and Fourier analyses of MDI velocity observations clearly indicate the enhancement in high-frequency global waves in the Sun during the flare. However, this signature of flare is weaker in the case of GOLF as compared to MDI data.
2 DATA ANALYSIS AND RESULTS
(a) (b)
(a) (b)


2.1 DATA USED FROM MDI
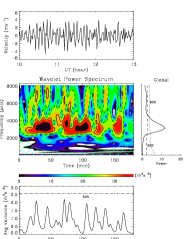
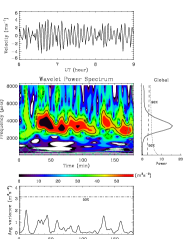
In normal mode of observation, MDI obtains full-disk Dopplergrams of the Sun at a cadence of 60 s and spatial sampling rate of 2 arcsec per pixel. We have used a sequence of such Dopplergrams for three hours (10:00–13:00 UT) spanning the flare obtained on 2003 October 28. We have also used three hours of MDI Dopplergrams for a quiet period (non-flaring condition) as control data. In order to compare the temporal behaviour with the disk-integrated intensity observations by VIRGO, we have summed up the velocity signals over all the pixels of the MDI full-disk Dopplergrams. A two-point backward difference filter (difference between two consecutive measurements) is applied to these sequences of images to enhance the velocity signals from the modes and high-frequency waves above the other solar background features. The sequence of these filtered Doppler images are then collapsed into a single velocity value, excluding the noisy pixels along the solar limb. This process is applied to the time series of Doppler images for the aforementioned flare event as well as the quiet period. It is believed that by collapsing the full-disk Doppler images, the acoustic modes with maximum =0,1,2,3 remain while the modes higher than these are averaged out. Thus, the collapsed velocity value should be the representative of the global acoustic modes. The temporal evolution of these disk-integrated velocity signals for three hours spanning the flare is shown in the upper panel of Figure 1(a) and that for the quiet period is shown in Figure 2(a).
2.2 DATA USED FROM GOLF
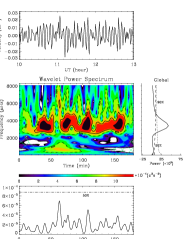
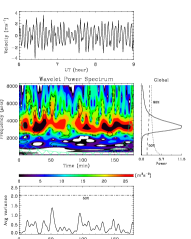
The GOLF instrument measures the disk-integrated line-of-sight velocity of the Sun at a cadence of one raw count every 10 s. However, we have rebinned the velocity data from GOLF for every 60 s to match with MDI. We have used the same periods of data for both instruments for the flare event of 2003 October 28, as well as for the non-flaring condition. We have worked with the standard velocity time series (García et al., 2005; Ulrich et al., 2000) as well as the original raw-counting rates. We have also checked if there was any anomalous behavior during the analyzed periods of time in the housekeeping data. Indeed, during the flare event of 2003 October 28, GOLF raw-counting rates of both photomultipliers suffered an increase in the measurements probably as a consequence of the impact of high-energetic particles. Due to these contaminations, the standard velocity time series have been filtered out during this period and thus, we have been obliged to work with the raw observations obtained by GOLF during the aforementioned flare event. A two-point backward difference filter is applied to the velocity series to remove the effect of the rotation and other slowly varying solar features. The temporal evolution of these filtered velocity signals for three hours spanning the flare is shown in the upper panel of Figure 1(b) and that for the quiet period is shown in Figure 2(b).
2.3 WAVELET ANALYSIS OF VELOCITY DATA
In order to examine the influence of flares on the high-frequency acoustic modes with time, we have applied the Wavelet transform (Torrence & Compo, 1998) on the velocity time series obtained from MDI and GOLF as described in the previous Sections. We have used the Morlet wave as mother wavelet. Wavelet Power Spectrum (WPS) is computed, which yields the correlation between the wavelet with a given frequency and the data along time. We limit our study to the region inside a “cone of influence” corresponding to the periods of less than 25% of the time series length for reliability of the periods (c.f., Mathur, Garcia, & Regulo et al. (2010)). Finally, we have also calculated two confidence levels of detection corresponding to the probability of 90% and 50% that the power is not due to noise. Thus, we have outlined the regions in the WPS where power lies above these confidence levels and these regions are shown in middle panels of the Figures 1-2(a)&(b). A comparison of the WPS for the flare event with that of the quiet period clearly indicates the enhancement of high-frequency waves during the flare as seen in the data from MDI instrument. However, in the case of GOLF data, some short-lived high-frequency waves are sporadically observed during the flares.
The WPS is collapsed along time to obtain the Global-wavelet power spectrum (GWPS). If some power is present during the whole length of our time series, it would be easily seen in the GWPS. This is nearly similar to the commonly used power spectral density. In the Figures 1-2(a)&(b), the GWPS shows a strong peak of the normal modes which are well known to be existing all the time. However, if the power of high-frequency waves increases only a few times along the three hours of the studied data this would not appear as a strong peak in the GWPS. In case of MDI data, the GWPS for the flare event do show a bump corresponding to the high-frequency waves (above 5 mHz). However, the GWPS estimated from the MDI velocity data during a quiet period (Figure 2(a)) doesn’t show any peak beyond 5 mHz. This supports the idea that the increase of power in the high frequency regime of the GWPS is indeed caused by the flare. In the case of GOLF data, we do not observe this signature in the GWPS estimated for the flare event as the overall high-frequency signal is weak in these observations.
To see when the high-frequency waves have an increased power during the flare, we have calculated the scale-average time series in the frequency regime 5-8 mHz. Basically, it is a collapsogram of the WPS along the frequency of the wavelet in the chosen range. For this quantity, we have calculated the confidence level for a 50% probability. These are shown in the lower panels of the Figures 1-2(a)&(b). Here, we observe peaks corresponding to the presence of high-frequency waves in the WPS. In general, the MDI data show more closely spaced high-amplitude peaks as compared to the GOLF data for the flare event, but still mainly around 50% confidence level. A comparison with the same analysis performed for a quiet period (non-flaring condition) neither shows a high-frequency bump beyond 5 mHz in the GWPS (for MDI data) nor high-amplitude peaks in the scale-average time series (for both, MDI and GOLF data). Thus, in spite of the small confidence levels found during this analysis, it indicates a possible relationship between these excess high-frequency power and the flares.
2.4 FOURIER ANALYSIS OF VELOCITY DATA
We have also estimated the Fourier Power Spectrum (FPS) from the velocity time series obtained by the MDI and GOLF instruments for the aforementioned flare event and the quiet period. The FPS spectra obtained from the MDI and GOLF data are respectively shown in the left and right panels of Figure 3. The FPS shown in the Figure 3 depicts dominant power in the 3 mHz band which is due to the normal modes. These FPS also show significant spikes in the higher frequency band (above 5 mHz) as estimated from MDI data for the flare event. However, the GOLF data shows marginal signature for the flare event. At the same time, these spikes are very weak in the case of a quiet period, as seen in both the data sets (c.f., bottom panels of Figure 3).
The difference found between the measurements of the two instruments could be a direct consequence of the different heights of the solar atmosphere sampled by each instrument (Ni I v/s Sodium doublet).
3 DISCUSSION AND CONCLUSIONS
Earlier attempts to find a correlation between the energy of these high-frequency oscillations and flares using disk-integrated velocity observations of the Sun had remained inconclusive (Gavryusev & Gavryuseva, 1999; Chaplin et al., 2004). In our analysis, the enhancement of high-frequency power is clearly seen in the MDI velocity data (and a feeble enhancement is also seen in the GOLF velocity data) during the major flare event of 2003 October 28. It is in good agreement with the flare related enhancements reported by Karoff & Kjeldsen (2008) in disk-integrated intensity oscillations as observed with VIRGO. Although, in our results the flare induced enhancement signals are seen with a low probability (around 50%), this signature is larger than that seen in non-flaring condition for both the MDI and GOLF data.
It is evident from the various models proposed for the generation of high-frequency waves that the amount of energy that is stored in the high-frequency waves is extremely low compared to the amount of energy stored in the normal modes which are powered by the strong turbulence in the convection zone of the Sun. Therefore, it is believed that the flare energy will have a larger relative effect at high frequency as the other sources of its excitation are much smaller. A more detailed discussion on this can be found in Kumar et al. (2010).
These observations provide us the opportunity to further investigate the possible excitation of global high-frequency waves by local tremors due to major solar flares. As a future study, we plan to correlate the epochs of enhancement of high-frequency waves with episodes of flare energy release seen in hard X-ray observations of the Sun.
Acknowledgments
The use of data from the MDI and the GOLF instruments on board SOHO spacecraft is gratefully acknowledged. The SOHO is a joint mission under cooperative agreement between ESA and NASA. This work has been partially supported by the CNES/GOLF grant at the Service d’Astrophysique (CEA/Saclay). We are thankful to Douglas Gough, John Leibacher, Frank Hill, P. Scherrer, Robertus Erdelyi, H. M. Antia, A. Kosovichev and Christoffer Karoff for useful discussions related to this work.
References
- Ambastha et al. (2003) Ambastha, A., Basu, S., Antia, H. M.: 2003, Sol. Phys.218, 151
- Ambastha & Antia (2006) Ambastha, A., Antia, H. M.: 2006, Sol. Phys.238, 219
- Balmforth & Gough (1990) Balmforth, N. J., Gough, D. O. 1990, Sol. Phys., 128, 161
- Braun & Duvall (1990) Braun, D. C., Duvall, Jr., T. L. 1990, Sol. Phys., 129, 83
- Chaplin et al. (2003) Chaplin, W. J., Elsworth, Y., Isaak, G. R., et al. 2003, in GONG+ 2002. Local and Global Helioseismology: the Present and Future, ed. H. Sawaya-Lacoste, ESA-SP, 517, 247
- Chaplin et al. (2004) Chaplin, W. J., Dumbill, A. M., Elsworth, Y. P., et al. 2004, Sol. Phys., 220, 307
- Donea et al. (1999) Donea, A.-C., Braun, D. C., Lindsey, C. 1999, ApJ, 513, L143
- Donea & Lindsey (2005) Donea, A.-C., Lindsey, C. 2005, ApJ, 630, 1168
- Foglizzo et al. (1998) Foglizzo, T., et al. 1998, A&A, 330, 341
- Fröhlich et al. (1995) Fröhlich, C., et al. 1995, Sol. Phys., 162, 101
- Gabriel et al. (1995) Gabriel, A. H., Grec, G., Charra, J., et al. 1995, Sol. Phys., 162, 61
- Gabriel et al. (1997) Gabriel, A. H., Charra, J., Grec, G., et al. 1997, Sol. Phys., 175, 207
- García (1994) García, H. A. 1994, Sol. Phys., 154, 275
- García et al. (1998) García, R. A., Palle, P. L., Turck-Chieze, S., et al. 1998, ApJ, 504, L51
- Gavryusev & Gavryuseva (1999) Gavryusev, V. G., Gavryuseva, E. A. 1999, MNRAS, 303, L63
- García et al. (2005) García, R. A., Turck-Chièze, S., Boumier, P., et al. 2005, A&A, 442, 385
- García et al. (2008) García, R. A., Mathur, S., Ballot, J., , et al. 2008, Sol. Phys., 251, 119
- Haber et al. (1988) Haber, D. A., Toomre, J., Hill, F. 1988, in Advances in Helio- and Asteroseismology, eds. J. Christensen-Dalsgaard & S. Frandsen, IAU Symposium, 123, 59
- (19) Jiménez, A., Jiménez-Reyes, S. J., García, R. A., et al. 2005, ApJ, 623, 1215
- Karoff & Kjeldsen (2008) Karoff, C., Kjeldsen, H. 2008, ApJ, 678, L73
- Kosovichev & Zharkova (1998) Kosovichev, A. G., Zharkova, V. V. 1998, Nature, 393, 317
- Kumar & Lu (1991) Kumar, P., Lu, E. 1991, ApJ, 375, L35
- Kumar & Ravindra (2006) Kumar, B., Ravindra, B. 2006, Journal of Astrophysics & Astronomy, 27, 425
- Kumar et al. (2010) Kumar, B., Mathur, S., García, R. A., Venkatakrishnan, P. 2010, ApJ, 711, L12
- Libbrecht (1988) Libbrecht, K. G. 1988, ApJ, 334, 510
- Libbrecht & Kaufman (1988) Libbrecht, K. G., Kaufman, J. M. 1988, ApJ, 324, 1172
- Mathur et al. (2008) Mathur, S., Eff-Darwich, A., García, R. A., et al. 2008, A&A, 484, 517
- Mathur, Garcia, & Regulo et al. (2010) Mathur, S., García, R. A., Regulo, T., et al. 2010, A&A, in press (arXiv:0912.3367)
- Scherrer et al. (1995) Scherrer, P. H., Bogart, R. S., Bush, R. I., et al. 1995, Sol. Phys., 324, 1172
- Torrence & Compo (1998) Torrence, C., Compo, G. P. 1998, Bulletin of the American Meteorological Society, 79, 61
- Ulrich et al. (2000) Ulrich, R. K., García, R. A., Robillot, J. -M. 2000, A&A, 364, 799
- Venkatakrishnan et al. (2008) Venkatakrishnan, P., Kumar, B., Uddin, W. 2008, MNRAS, 387, L69
- Wolff (1972) Wolff, C. L. 1972, ApJ, 176, 833