Localization and One-Parameter Scaling in Hydrogenated Graphene
Abstract
We report a metal-insulator transition in disordered graphene with low coverages of hydrogen atoms. Hydrogen interacting with graphene creates short-range disorder and localizes states near the neutrality point. The energy range of localization grows with increasing of H concentration. Calculations show that the conductances through low-energy propagating channels decay exponentially with sample size and are well fitted by one-parameter scaling function, similar to a disorder-driven metal-insulator transition in 2-dimensional disordered systems.
pacs:
71.30.+h, 72.80.Vp, 73.20.Fz, 73.20.HbGraphene, a single layer of graphite, has its unique electronic structure with a zero gap and quasiparticles described by massless Dirac fermions.Novo02 ; Zhang The linear dispersion relation near two inequivalent Brillouin zone corners leads to very unusual transport phenomena. Dirac fermions can perfectly transmit through a potential barrier at normal incidence due to the absence of backscattering,Ando so called the Klein paradox.Klein The metallic conduction of graphene is robust against long-range disorder, whose potential varies slowly on the scale of the interatomic distance.Bardarson ; Nomura01 Thus, Dirac fermions cannot be generally localized by long-range disorder, in contrast to the Anderson localization theory,Abrahams ; Lee while a metal-insulator transition of Kosterlitz-Thouless type was recently reported in graphene with strong long-range impurities.YYZhang On the other hand, random short-range disorder induces the intervalley scattering between the two valleys, eventually leading to localization.Aleiner ; Altland
The chemical reaction of atoms and molecules with graphene can give rise to a short-range disorder potential. Several experiments reported that graphene undergoes a metal-insulator transition by dosing with atomic hydrogenElias ; Bostwick or molecules such as NO2.Zhou At high coverages of adsorbates, the electronic structure of graphene may be significantly modified due to the change in hybridization from to . According to first-principles calculations,Sofo when all C atoms react with hydrogen, graphene turns into a new insulating material with the band gap of about 3.5 eV, known as graphane. Other theoretical studies showed that chemisorbed molecules such as H and OH suppress the conductivity on one side of the Dirac point and derive the system further towards the localized state at higher adsorbate concentrations.Robinson As the insulating behavior of hydrogenated graphene was observed at substantially low doses,Bostwick there is other possibility that short-range disorder by hydrogen induces a localized insulating state.Elias
In this paper we perform numerical calculations to investigate the localization behavior of disordered graphene by hydrogenation using a simple tight-binding model. To exclude the formation of a band insulating graphene, we consider low coverages of atomic hydrogen. We find that conductances in a narrow range of energies near the Dirac point are well described by one-parameter scaling function, exhibiting a metal-insulator transition.
Our calculations are performed using a combined approach of the density functional theory and the tight-binding (TB) method. As the electron conduction takes place by hopping along the C orbitals, we consider a single-band TB Hamiltonian to describe interactions between graphene and hydrogen,
| (1) |
| (2) |
Here (= 2.6 eV) is the hopping integral between the nearest-neighbor C orbitals, () is the annihilation (creation) operator on the th site of graphene lattice, is the coupling strength between the C and H orbitals, is the H on-site energy, () is the annihilation (creation) operator on the adsorbate site, and is the host site bonded to the H atom. The parameters, (= 5.72 eV) and (= 0 eV), are determined by fitting to the first-principles band structure of hydrogenated graphene. In first-principles calculations, we use the generalized gradient approximation (GGA)GGA for the exchange-correlation potential and ultrasoft pseudopotentialsUS for the ionic potentials, as implanted in the VASP code.VASP The wave functions are expanded in plane waves with an energy cutoff of 400 eV. We test various hexagonal supercells with different sizes, which contain up to four H atoms, and find good agreements between the TB and GGA band structures, without including the second nearest-neighbor hopping parameter in the TB model.
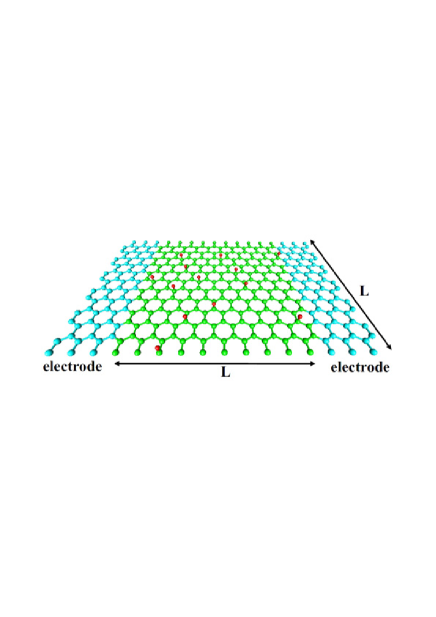
To describe the transport properties of hydrogenated graphene, we set up a device model such that disordered graphene is sandwiched between two semi-infinite graphene electrodes, as shown in Fig. 1. In the device region, a square shaped sample with the length is assumed, with periodic boundary conditions imposed in the transverse direction to remove the effect of the edge states in sample. For various coverages, hydrogen atoms are placed on one side of graphene because the TB approach cannot distinguish the difference between both sides. For large systems, we use the recursive Green’s function methodMacKinnon to calculate the density of states and the two-terminal conductance, , where is the transmission matrix and the factor 2 accounts for spin degeneracy.Datta
A single H atom on graphene breaks the sublattice symmetry, opening a band gap and creating a localized level at the Dirac point. The wave function amplitude of the localized state is zero in the same sublattice as the C atom bonded to hydrogen, whereas it decays rapidly with distance from the adsorbate in the opposite sublattice, similar to an ideal C-vacancy.Pereira01 This similar behavior results from the formation of a covalent C-H bond involving the orbital of the C site where H is adsorbed, effectively removing one C atom from the lattice. If a small amount of H is adsorbed on graphene, the formation of localized levels strongly depends on the type of adsorption sites due to their unique wave function amplitudes. The densities of states and two-terminal conductances are compared for graphene samples with various H densities ( up to 10 %) in Fig. 2, where is defined as the ratio of the number of adsorbates to the total number of the C atoms in graphene. We consider two different configurations for the positions of adsorbates, which are in the same sublattice ( or ) or in both the and sublattices with equal amounts. For each concentration, the adsorbate sites are chosen at random, with the H atoms on top of the host atoms. In the former configuration, all the localized states induced by adsorbates are positioned at the same energy, = 0 [Fig. 2(a)], because these states are decoupled in the same sublattice. The van Hove singularities which appear at in clean graphene become softened as increases. Although the selective dilution of adsorbates is unlikely to occur, it is interesting to note that adsorbates develop the gap opening. The energy gap has a tendency to increase with increasing .JKang In the gap region, the densities of states are zero, except for strong peaks by the localized states, and conductances are severely suppressed [Fig. 2(c)], indicating that hydrogenated graphene becomes a band insulator.
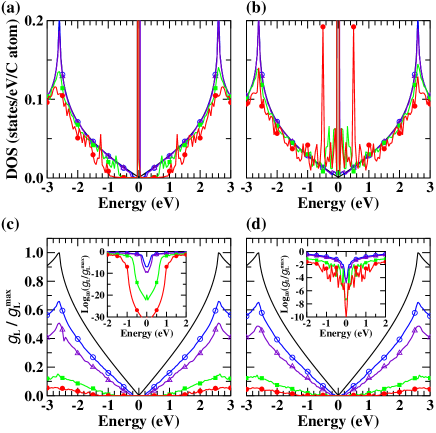
When adsorbates are random in both the and sublattices, the localized states have nonzero wave function amplitudes at the opposite sublattice sites. Due to the level splitting by interactions, the gap opening is suppressed, with several sharp peaks superimposed on the finite density of states near the Dirac point. This feature is very similar to the case of random vacancy defects.Pereira01 In the region of high energies, the variation of normalized conductances with energy is similar to that for the H adsorption in the same sublattice, regardless of the H concentration. The logarithmic plot of normalized conductances shows clear differences, especially in the low energy region, where the finite density of states is formed. The logarithmic conductances severely fluctuate, indicating a signature of localization, as shown in Fig 2(d). The energy range of fluctuating conductances grows with increasing of the H concentration. In addition, although conductances are larger than those for adsorbates in only one sublattice, they are much suppressed due to scattering between the localized states.
To see more precisely the localization behavior of low energy states, we examine the hypothesis of one-parameter scaling which has been widely used in 2-dimensional (2D) disordered electronic systems.Lee In the scaling theory of localization, we consider the intrinsic conductance ,Braun which is given by the relation, , where is the number of channels at the energy and is the contact resistance. Using the dimensionless conductance , the scaling function () is defined asAbrahams ; Lee ; Slevin
| (3) |
Here … denotes the ensemble average of over configurations chosen for the random distribution of adsorbates in both the and sublttices of graphene sample with the size . We test various system sizes up to = 44 nm, which contains 7.5104 sites. For each adsorbate concentration in a given sample size, we use 300 to 1000 configurations, which ensure the numerical convergence in the average.
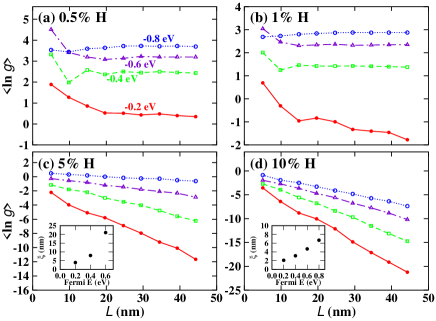
Figure 3 shows the variation of with the sample size for different energies to within 0.8 eV from the neutrality point, in which the density of states is greatly affected by adsorbates. When adsorbate densities are low, 0.5 %, conductances are slightly fluctuated due to small sample sizes for nm [Figs. 3(a) and 3(b)]. For = 0.5 %, remains nearly constant with increasing , regardless of the energy in the vicinity of the Dirac point. This result is consistent with the fact that the density of states is not significantly affected at low densities of adsorbates, with only sharp peaks at the Dirac point [Fig. 2(b)]. As increases to 1.0 %, with eV starts to decrease with , while no change occurs for higher energy channels. The decreasing behavior of with eV becomes significant for high adsorbate densities of 5 and 10 %, as shown in Figs. 3(c) and 3(d). It is interesting to note that the energy range, in which decreases with , increases with increasing . For = 10 %, we find the linearly decreasing behavior of for all the propagating channels down to eV, with different slopes. As the conductance decays exponentially with respect to the sample size, the slope represents the inverse of localization length (). The localization lengths are estimated to be in the range of 2 to 7 nm for = 10 %, exhibiting the increasing behavior with the channel energy. This result indicates that the disorder effect on conductance becomes more significant for low energies [Figs. 3(c) and 3(d)]. In addition, for a given channel energy, the localization length tends to decrease with increasing . Thus, it is expected that a metal-to-insulator transition occurs as the adsorbate density increases. The charge density plots for the conducting channels also show the characteristics of localization. For hydrogenated graphene with = 14 nm, the charge densities of the states around eV are compared for different adsorbate densities in Figs. 4(a) and 4(b). For the low density of 1 %, the energy states near eV exhibits the extended charge densities over the whole sample. Thus, this channel has the metallic conduction, with the localization length much larger than the sample size. As increases to 10 %, the localization is extended to higher energy states, reducing the localization length to a few nanometers. The localized behavior of the energy states around eV is clearly seen in the plot of charge densities.
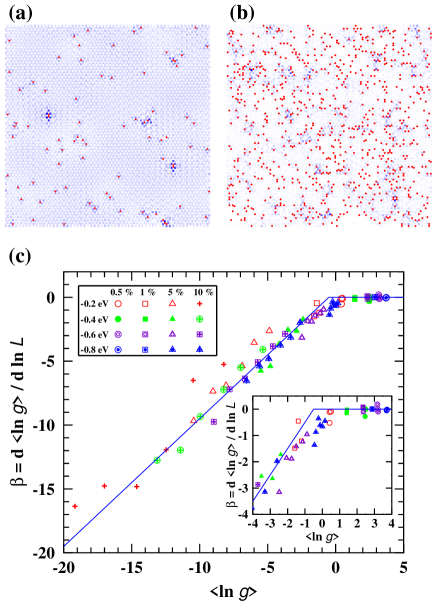
From the results for in Fig. 3, the scaling function is drawn as a function of in Fig. 4(c). The calculated values for for different adsorbate concentrations and different energies are well fitted by an one-parameter function. For , is nearly zero, implying that graphene is in the 2D metallic phase, in which conductance is almost independent of the sample size. For , as is linearly proportional to with a slope of 1, the conductance follows the localization function, , in the insulating phase. In the intermediate region, , is smoothly connected from the metallic to insulating phase, satisfying the hypothesis of the scaling function.
We point out that is always negative in Fig. 4(c), while its value is very small for . Thus, the conductance tends to decrease continuously with increasing , suggesting that an infinitely large graphene with H adorbates would act as an insulator. Note that our scaling function for short-range disorders is very different from those obtained in graphene subject to long-range disorders,Bardarson ; Nomura01 while it is similar to that derived for strong long-range impurities.YYZhang In the presence of long-range potential, the intervalley scattering of the Dirac fermions is generally suppressed, resulting in the positive beta function which increases with decreasing whereas converges to zero for large . Thus, the conductance increases with sample size, robust against disorder, because none of the states can be localized. In contrast, hydrogen adsorbates in graphene act as short-range scatters and manifest the intervalley scattering. Due to significant backscattering, the Dirac fermion states are localized, giving vanishing conductance for a large system.
In summary, our study shows that, even with low hydrogen concentrations of %, a metal-insulator transition can occur by the localization of electron states. We find that the conductance decays exponentially with increasing of the sample size, satisfying the one-parameter scaling function in the 2D localization theory. This result provides an explanation for the recent observation of a metal-insulator transition on graphene-terminated SiC(0010) surface decorated with small amounts of atomic hydrogen.Bostwick If the adsorbate density increases higher, the gap opening is likely to be a major cause for the insulating behavior, as observed by experiments.Elias ; Sofo There is also the possibility that adsorbate atoms are clustered at high densities, modifying the Dirac fermion nature into an insulating phase. Finally we point out that other adsorbates such as F atoms and CH3, C2H5, CH2OH, and OH molecules may also induce a metal-insulator transition, which satisfies the beta function in Fig. 4(c). Recent theoretical calculationsWehling ; Wehling02 showed that CH3, C2H5, and CH2OH molecules on graphene give rise to localized states in the midgap, similar to that of an H adsorbate, and low conductances around the Dirac point. Similarly, adsorbates such as F and OH directly interact with the host atoms, forming localized levels. As these defect levels are rather dispersive, there may be an asymmetry in conductance with respect to the neutrality point.
Acknowledgements.
This work was supported by National Research Foundation of Korea under Grant No. NRF-2009-0093845.References
- (1) K. S. Novoselov, A. K. Geim, S. V. Morozov, D. Jiang, M. I. Katsnelson, I. V. Grigorieva, S. V. Dubonos, and A. A. Firsov, Nature 438, 197 (2005).
- (2) Y. Zhang, Y.-W. Tan, H. L. Stormer, and P. Kim, Nature 438, 201 (2005).
- (3) T. Ando and T. Nakanishi, J. Phys. Soc. Jpn. 67, 1704 (1998); T. Ando, T. Nakanishi, and R. Saito ,ibid. 67, 2857 (1998).
- (4) M. I. Katsnelson, K. S. Novoselov, and A. K. Geim, Nature Phys. 2, 620 (2006).
- (5) J. H. Bardarson, J. Tworzydło, P. W. Brouwer, and C. W. J. Beenakker, Phys. Rev. Lett. 99, 106801 (2007).
- (6) K. Nomura, M. Koshino, and S. Ryu, Phys. Rev. Lett. 99, 146806 (2007).
- (7) E. Abrahams, P. W. Anderson, D. C. Licciardello, and T. V. Ramakrishnan, Phys. Rev. Lett. 42, 673 (1979).
- (8) P. A. Lee and T. V. Ramakrishnan, Rev. Mod. Phys. 57, 287 (1985).
- (9) Y.-Y. Zhang, J. Hu, B. A. Bernevig, X. R. Wang, X. C. Xie, and W. M. Liu, Phys. Rev. Lett 102, 106401 (2009).
- (10) I. L. Aleiner and K. B. Efetov, Phys. Rev. Lett. 97, 236801 (2006).
- (11) A. Altland, Phys. Rev. Lett 97, 236802 (2006).
- (12) D. C. Elias, R. R. Nair, T. M. G. Mohiuddin, S. V. Morozov, P. Blake, M. P. Halsall, A. C. Ferrari, D. W. Boukhvalov, M. I. Katsnelson, A. K. Geim, and K. S. Novoselov, Science 323, 610 (2009).
- (13) A. Bostwick, J. L. McChesney, K. V. Emtsev, T. Seyller, K. Horn, S. D. Kevan, and E. Rotenberg, Phys. Rev. Lett. 103, 056404 (2009).
- (14) S. Y. Zhou, D. A. Siegel, A. V. Fedorov, and A. Lanzara, Phys. Rev. Lett. 101, 086402 (2008).
- (15) J. O. Sofo, A. S. Chaudhari, and G. D. Barber, Phys. Rev. B 75, 153401 (2007).
- (16) J. P. Robinson, H. Schomerus, L. Oroszlány, and V. I. Fal’ko, Phys. Rev. Lett. 101, 196803 (2008).
- (17) J. P. Perdew, K. Burke, and M. Ernzerhof, Phys. Rev. Lett. 77, 3865 (1996).
- (18) D. Vanderbilt, Phys. Rev. B 41, R7892 (1990).
- (19) G. Kresse and J. Furthmüller, Comput. Mater. Sci. 6, 15 (1996).
- (20) A. MacKinnon, Z. Phys. B 59, 385 (1985).
- (21) S. Datta, Electronic Transport in Mesoscopic Systems (Canmbridge University Press, Cambridge, England, 1995).
- (22) V. M. Pereira, F. Guinea, J. M. B. Lopes dos Santos, N. M. R. Peres, and A. H. Castro Neto, Phys. Rev. Lett. 96, 036801 (2006); V. M. Pereira, J. M. B. Lopes dos Santos, and A. H. Castro Neto, Phys. Rev. B 77, 115109 (2008).
- (23) J. Kang, J. Bang, B. Ryu, and K. J. Chang, Phys. Rev. B 77, 115453 (2008).
- (24) D. Braun, E. Hofstetter, G. Montambaux, and A. MacKinnon, Phys. Rev. B 55, 7557 (1997).
- (25) K. Slevin, P. Markoš, and T. Ohtsuki, Phys. Rev. Lett. 86, 3594 (2001).
- (26) T. O. Wehling, M. I. Katsnelson, and A. I. Lichtenstein, Phys. Rev. B 80, 085428 (2009).
- (27) T. O. Wehling, S. Yuan, A. I. Lichtenstein, and M. I. Katsnelson, arXiv:1003.0609.