Numerical study of Q-ball formation in gravity mediation
Abstract
We study Q-ball formation in the expanding universe on 1D, 2D and 3D lattice simulations. We obtain detailed Q-ball charge distributions, and find that the distribution is peaked at , which is greater than the existing result by about 60. Based on the numerical simulations, we discuss how the Q-ball formation proceeds. Also we make a comment on possible deviation of the charge distributions from what was conjectured in the past.
pacs:
98.80.Cq, 11.27.+d, 11.30.FsI Introduction
If scalar fields are ubiquitous in nature, some of them may remain light in the early universe. Such scalar fields could be deviated from the low-energy minimum due to quantum fluctuations during inflation and/or modification of the scalar potential through gravitationally suppressed interactions with the inflaton. At a later time when the expansion rate becomes smaller than the mass, the scalar will start to roll down and oscillate about the potential minimum. The dynamics of such a scalar can exhibit rich phenomena in cosmology.
We focus on a complex scalar field with a global U(1) symmetry at the potential minimum. The U(1) symmetry is not necessarily exact, and could be violated at high energy scales; our arguments apply if it is a good symmetry at low energy. If supersymmetry (SUSY) is realized in nature, there may be many such scalar fields. In Ref. Coleman:1985ki Coleman found that, if the scalar potential is shallower than a quadratic potential, there is a non-trivial field configuration that minimizes the energy for a fixed U(1) charge . Since the solution has a spherical symmetry, the solution is named Q-ball. A Q-ball is a non-topological soliton whose stability is supported by the U(1) symmetry.
It was noticed in Refs. Kusenko:1997zq ; Dvali:1997qv ; Kusenko:1997si ; Enqvist:1997si that Q-balls play an important role in a context of the Affleck-Dine (AD) mechanism Affleck:1984fy . The mechanism utilizes a flat direction of the supersymmetric standard model (SSM), which possesses a non-zero baryon (or lepton) number. A flat direction responsible for the AD mechanism is referred to as the AD field (denoted by in the following). The AD field develops a large expectation value during inflation, and it starts to oscillate after inflation when the cosmic expansion rate becomes comparable to its mass. The baryon number is effectively created at the onset of the oscillations. Finally, decays into the ordinary quarks, leaving the universe with a right amount of the baryon asymmetry. It was realized however that, soon after the onset of oscillations, the AD field experiences spatial instabilities and deforms into clumpy Q-balls Kusenko:1997si . Later it was shown in Kasuya:2000wx that most of the baryon asymmetry is absorbed into Q-balls. Its non-linear property necessitates numerical approach to the formation and the subsequent evolution.
The properties of Q-balls crucially depend on the size of the U(1) charge . For instance, the mass per unit charge is a decreasing function of in case of gauge-mediation type Q-balls; for a large enough , the Q-ball can be absolutely stable against the decay into nucleons and therefore contribute to dark matter Kusenko:1997si . In the case of unstable Q-balls, the decay rate depends on the charge, and Q-balls can be very long-lived in a cosmological time scale for a sufficiently large Enqvist:1998xd , since the Q-ball decay process takes place only in the vicinity of the surface Cohen:1986ct . Thus it is of utmost importance to determine the charge distribution of the Q-balls at the formation.
There is a number of numerical studies on the Q-balls. The Q-ball formation has been first examined by Kasuya and one of the authors (MK) on 3D lattice simulations in a context of gauge mediation Kasuya:1999wu ; Kasuya:2001hg and gravity mediation Kasuya:2000wx , taking account of the cosmic expansion. They found that most of the baryon number is absorbed into the largest Q-balls in the lattices and estimated the typical Q-ball charge. However, the estimated charge might have been affected by relatively coarse spatial resolution due to the limited computational power at that time. The Q-ball charge distribution was studied in 2D Enqvist:2000cq and 3D Multamaki:2002hv lattices, with an emphasis on negative Q-balls formed for an orbit with a large ellipticity. In gravity mediation, however, the AD field naturally acquires a large kick into the phase space, leading to an orbit with a comparatively small ellipticity. As we will see later, the formation of negative Q-balls are also observed in our simulations for a large ellipticity. However, the final charge distribution does not fit well the empirical formula conjectured in Ref. Enqvist:2000cq based on the entropy argument. The difference may be attributed to the fact that the charge re-distribution through exchanges of small secondary Q-balls seems less efficient in our simulations. Also the finite grid size could have affected the Q-ball evolution especially at a very late time when one Q-ball was represented by a single grid point. In our analysis we stop following the evolution once the spatial resolution becomes insufficient to describe the Q-ball solution, in order to avoid any artificial effects due to the finite grid size. Recently Tsumagari studied the Q-ball formation and thermalization processes in a great detail in a Minkowski space neglecting the cosmic expansion Tsumagari:2009na . In an expanding universe, however, the thermalization processes through Q-ball interactions may be weakened, and the resultant Q-ball configuration could be quite different. We will see in the following that the cosmic expansion indeed plays an essential role in the Q-ball formation.
In this paper we study the Q-ball formation in a scalar potential motivated by the AD mechanism in gravity mediation and obtain the Q-ball charge distribution on 1D, 2D and 3D lattice simulations with the cosmic expansion for different values of ellipticity and strength of instabilities. We develop a sophisticated numerical code based on the 6th-order symplectic integrator equipped with a new Q-ball identification algorithm.
The paper is organized as follows. In Sec. II, we summarize the governing equation of Q-balls in the gravity-mediation model. In Sec. III, we briefly mention the numerical scheme used in the simulations and, in Sec. IV, we show numerical results obtained from simulations in 1D, 2D and 3D configurations. After that, Sec. V is devoted to some applications of our numerical results, and we conclude in Sec. VI.
II Q-ball dynamics
In the gravity-mediated SUSY breaking model, the AD field typically has a potential of the following form,
| (1) |
where is a complex scalar field parametrizing the flat direction, a coupling constant of the non-renormalizable term, the Hubble parameter, a positive constant, a cutoff scale of the theory, the renormalization point defining the mass of scalar field , and is the contribution from the one-loop correction chiefly due to gauginos Enqvist:1997si . The cut-off scale is typically taken as the GUT scale GeV or the Planck scale. Note that the potential (1) is invariant under the phase rotation of . The effect of the U(1)-violating term will be taken into account in the initial condition of .
The evolution equation of the scalar field is given by . With the above potential, the explicit form of the governing equation of becomes
| (2) |
where is the spatial dimension, the dot indicates a time derivative, and is defined as the Laplacian with respect to the comoving coordinate. In this paper, we restrict our analysis to the epoch between the end of inflation and the reheating era, where the scale factor behaves as like the matter-dominant case. In addition, the non-renormalizable term (the last term being proportional to ) does not directly contribute to the late-time evolution of the scalar field, so we fix , and, for simplicity, .
The charge density of the AD field is given by
| (3) |
The charge and energy of a Q-ball are given by
| (4) | ||||
| (5) |
where denotes the -dimensional volume of the Q-ball. Note that, from the dimensional analysis, these quantities in 1D and 2D should be regarded as the densities per unit area and length, respectively.
For a negative value of , the potential (1) is shallower than the quadratic potential , for which there exists a non-trivial field configuration that minimizes the energy for a fixed charge . We can find the solution using the Lagrange multiplier method, and the minimum energy state turns out to be a spherical field configuration inside which the scalar field is rotating in a circular orbit in the phase space Coleman:1985ki . This object is called Q-ball.
There is an instability band for the potential with . From a simple linear analysis Kasuya:2000wx one can show that the instability band is given by 111In Ref.Kasuya:2000wx , there is an error in the instability band. One of the authors has rederived the instability band with a more plausible assumption in Ref.Enqvist:2002si .
| (6) |
The small fluctuations within the above instability band will therefore grow into Q-balls with a typical size . Since the Q-ball formation is a highly nonlinear phenomenon, we need to rely on numerical simulations to understand how it proceeds.
III Simulation setup
The potential (1) is invariant under the U(1) rotation of , and therefore the charge is preserved. In general, however, there is a U(1)-violating term arising from the A-term . This term kicks the AD field into the angular direction at the onset of oscillations, giving a nonzero U(1) charge, or equivalently, the angular momentum in the complex plane [see Eq. (3)]. Since the amplitude of the oscillations decreases due to the Hubble friction term, such non-renormalizable U(1)-violating terms soon become negligible. Thus, the main role of the A-term is to give an initial angular momentum. To take account of the effect, we parametrize the initial condition of the homogeneous mode as
| (7) |
The initial charge density is then . In the following analysis we take and . Also we add small fluctuations to the above initial condition, , following Ref. Kasuya:2000wx .
We use a comoving box as a computational domain whose physical size at the initial time is , where is the Hubble parameter at the initial time, and is a dimension-less parameter defining the box size. We choose the normalization of the scale factor as where is the initial time, . We adopt a value between . In all simulations except for the partial cases (1D2, 1D3, 1D4 in Table 1) in 1D, we use the equation of motion in an expanding background with an initial condition . In the non-expansion case, coincides with the physical scale. As for the computational grid, we use the homogeneous grid, where is the dimension and for , for and for . Other numerical parameters we used are tabulated in Tables 1-3. On the boundaries, we impose the periodic boundary condition.
As the universe expands, the spatial resolution gets worse. The physical Q-ball size is given by Enqvist:1997si , and the grid spacing is . Requiring during the simulations, we obtain the critical time after which Q-balls are no longer resolved,
| (8) |
where measures the time normalized by from the beginning of the simulation, i.e., . For example, we can resolve Q-balls until for and . In all simulations we have chosen the number of grids so that Q-balls are resolved until .
To evolve , we implement the 7 stages 6th-order symplectic integrator developed by Yoshida Yoshida:1990zz . This scheme conserves the charge and energy of the target field, and the higher-order scheme is expected to suppress the global error, at least, until the epoch of the Q-ball formation. The spatial derivatives, i.e. the Laplacian operator in Eq. (2), are estimated with the second-order finite difference. We also implemented the Fourier collocation method, and confirmed that the final results do not depend on the scheme of derivative.
In order to identify the formed Q-balls, we developed an algorithm based on the Marching Cube method Lorensen:1987 . We briefly summarized the algorithm in Appendix B. Our algorithm regards the region in which the charge density exceeds a critical value, , as a Q-ball. This criterion is determined so that is sufficiently larger than the background field but smaller than the typical peak density. We set to be a fraction of when the fluctuations first enter the non-linear regime.
In addition, we use OpenDX to visualize the Q-balls in the 2D and 3D cases opendx .
IV Numerical results
IV.1 1D
IV.1.1 the effect of cosmic expansion
Let us begin with the time-evolution of the AD field in 1D. For the sake of seeing the effect of the cosmic expansion particularly in 1D, we have performed simulations both with and without the cosmic expansion.
First, we show the result with the cosmic expansion and explain how to identify Q-balls. Fig. 1 shows the charge density of the AD field at and with the parameter set 1D1 (see Table 1). There are lots of peaks to be regarded as Q-balls. These Q-balls were formed at in this simulation when the background charge density has been decreased to where is the initial value of given in Eq. (7). Once a Q-ball is formed, its charge density at the center remains virtually unchanged unless there are significant collisions and mergers, since its physical size does not change in time and the total charge is preserved under the theory we consider here. Actually, we can see that the peak values are more or less unchanged between (red solid) and (green dashed) in Fig. 1.
At the formation, the modes in the instability band (6) grow and become non-linear, and proto-Q-balls are formed. Those proto-Q-balls absorb the surrounding charges, and the charge density outside Q-balls are quickly damped. Therefore if we set to be a fraction of , we can collect the Q-balls. Throughout this paper, we choose . The explicit value of depends on each simulation. In the present case, , which is drawn as the blue dotted line in Fig. 1.
Using this criterion, we show the time evolution of the number of Q-balls in Fig. 2. The vertical axis is the number of Q-balls in unit (comoving) length of the computational domain, . We found that there are approximately 5 Q-balls in the unit comoving length (normalized by ), that is, totally Q-balls in the whole domain with . To reduce the statistical error, we averaged 50 realizations. We can see that, after Q-balls are formed at about , the number of Q-balls remains constant for a while and then gradually decreases. The decrease is probably due to the merger or disruption process through collisions. In the 1D simulations, collisions among Q-balls are expected to occur more frequently than in the cases with 2D or 3D, which enhances the probability that multiple Q-balls merge into a large one. Note that this is not due to the finite box effect, as will become clear from the following argument.
| ID | of grid | expansion | realization | |||
|---|---|---|---|---|---|---|
| 1D1 | 1024 | 5 | 0.005 | -0.1 | yes | 50 |
| 1D2 | 256 | 100 | 0.05 | -0.1 | no | 50 |
| 1D3 | 1024 | 400 | 0.05 | -0.1 | no | 50 |
| 1D4 | 4096 | 1600 | 0.05 | -0.1 | no | 20 |


Identifying each Q-ball, we can estimate its charge and energy. The charge distribution of Q-balls at (blue dotted), (green dashed) and (red solid) is shown in Fig. 3. The vertical axis is the number multiplied by the charge. Note that the number here means the one in a logarithmic bin in a unit comoving length, . The charge distribution does not significantly change in time except for a temporal bimodal feature at , and the Q-balls mainly contributing to the total charge in the computational domain are those with . Note that should be interpreted as the charge density per unit area, and so, it has a mass dimension two. Moreover we have found that the Q-ball charge ranges over about one order of magnitude, .
In Ref. Kasuya:2000wx , it was concluded that based on the 3D simulation, a small number of very large Q-balls absorb most of the charge that the AD field originally possessed. We however have found that the charge has a distribution with a finite width shown in Fig. 3. Therefore, in this paper, we regard the typical charge of Q-balls as that at the peak of the charge distribution instead of the rare largest Q-balls.

So far, we consider the case with the cosmic expansion. In the non-expansion case, the spatial resolution does not change during simulations. So, it may sound good for the purpose of numerical simulation and there are some past works assuming the non-expanding background, e.g. Tsumagari:2009na . However, there are several crucial differences.
Fig. 4 shows the time evolution of the number of Q-balls in the non-expansion cases with the parameters 1D2, 1D3 and 1D4 tabulated in Table 1. The red solid, green dashed and blue dotted lines are the results with a different box size: and , respectively. The vertical axis is the total number of Q-balls in a simulation box. These simulations have the same spatial resolution . In order to reduce the statistical fluctuations, we average over 50 realizations for and 20 realizations for . The Q-balls are formed at , and their number monotonically decreases due to merger and disruption through collisions. The decrease may be similar to what we observed in the case with the cosmic expansion. However, at about for , respectively, the Q-ball number starts to rapidly decay. In fact, the numbers tend to converge to 1, and the convergence time as well as the time when the rapid decay starts get delayed for a larger box. This observation shows that the large Q-balls sweep the whole computational domain many times, absorbing other small Q-balls, until one very large Q-ball is formed. This is clearly the artificial volume effect. Therefore the numerical results in the non-expansion cases can be trusted only before the time when the numbers start to rapidly decay.


The difference between the non-expansion and expansion cases can be manifestly seen from Fig. 5. This figure shows the trajectories of Q-balls in the case with the cosmic expansion (1D1 in Table 1) [right] and without (1D3) [left]. In the non-expansion case, we found that the Q-balls interact many times with one another, and Q-balls go across the boundaries of the domain again and again. Through the interactions among Q-balls, large Q-balls tend to become even larger by ingesting other slow-moving Q-balls, resulting in the decrease of the number of Q-balls. Since the background spacetime is static, the process will never stop until all the charge is absorbed into one large Q-ball. Hence, in order to avoid the artificial volume effect, a large computational box must be prepared.
In the expanding background, Q-balls are dragged by the cosmic expansion and thus less frequently interact with other Q-balls. In fact, as shown in the right panel of Fig. 5, the number does not change so much even with a quite small box. The cosmic expansion clearly suppresses the interactions among Q-balls, and the merger and disruption processes do not frequently take place; they are considered to be decoupled at a certain point. In the 2D and 3D cases, the finite box effect may look weaker than in the case of 1D, since the collisions are expected to take place less frequently. However, the intrinsic problem of neglecting the cosmic expansion mentioned above still exists even in these cases, and it is quite likely that such a crude approximation significantly affects the Q-ball formation and the final Q-ball charge distribution. Thus we hereafter will treat only the cases with the cosmic expansion.
IV.2 2D
IV.2.1 Filamentary structure
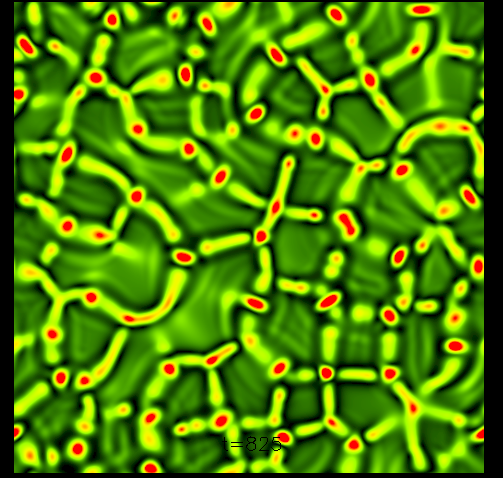
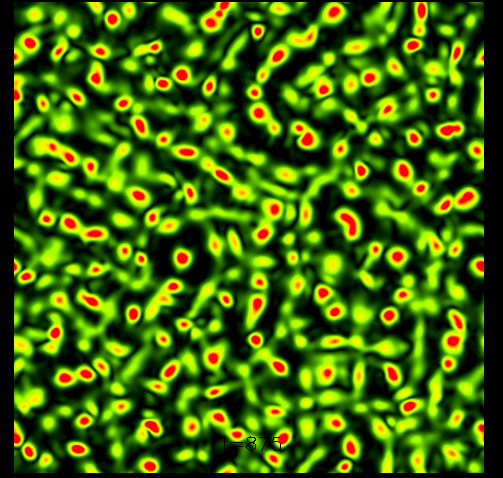
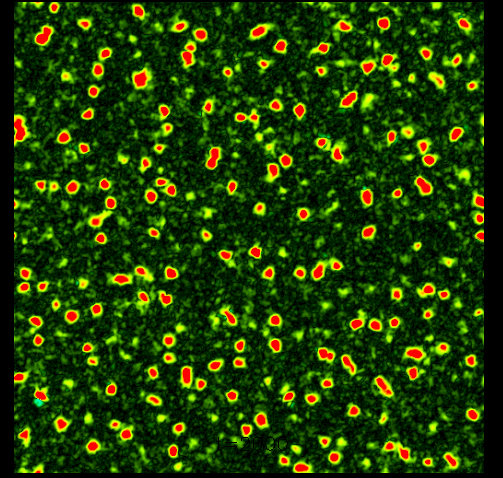
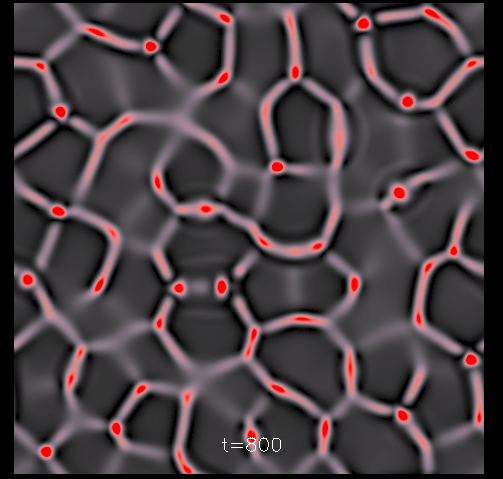
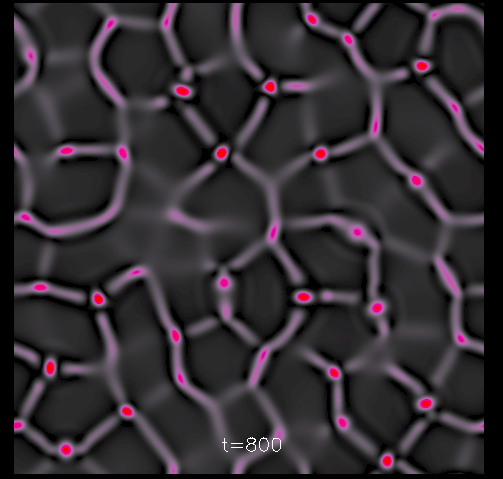
Let us next consider the 2D system. The parameter sets used in our analysis are shown in Table 2. We first show the result with the parameter set 2D1. The snapshots of the spatial charge distribution during the Q-ball formation are shown in Fig. 6. In this figure, the panels (a)–(d) correspond to and , respectively, and the red indicates the large positive charge and the black . We can clearly see the filamentary structure just before the Q-ball formation [see (a)(b)], which was noted in Ref. Enqvist:2000cq . Our point here is that the filamentary structure plays an important role in the Q-ball formation. In order to help understanding the formation process, we classify the Q-balls into those formed at intersections, sides and voids of the filamentary structure, in the order of the charges and the formation time. 222Note that this classification is obscure especially for small Q-balls; significant Q-ball interactions are considered to occur locally, which makes it difficult to chase the origin of those Q-balls. However it is still useful to keep in mind such classification because those small Q-balls do not significantly contribute to the peak of the charge distribution. At , large proto-Q-balls are formed at the intersections of the filaments, as one can see in (b). These proto-Q-balls will chiefly become the largest Q-balls forming the peak in the final distribution. Shortly after the formation of the proto-Q-balls at the intersections, the filaments start to be torn to smaller pieces, which will in the end become Q-balls with smaller charges. In addition, small Q-balls are formed in the void regions of the filamentary structure almost at the same time [see (c)]. The Q-balls formed from the sides and the voids will account for the tail of the charge distribution left to the peak. These classification may become vague after mergers and disruptions through collisions, but it is clear from Fig. 6 that the filamentary structure strongly affects the spatial charge distribution even at late times. This argument is reinforced by the observation that major collisions are less frequent in the expanding background, as we have seen in the case of 1D (see Fig. 5). Also we can explicitly see that the number of Q-balls is preserved soon after the Q-balls from the sides and voids are formed, as shown in Fig. 7.
| ID | grid size | ||||
|---|---|---|---|---|---|
| 2D1 | 5122 | 2.5 | 0.005 | -0.1 | 1 |
| 2D2 | 5122 | 2.5 | 0.005 | -0.07 | 1 |
| 2D3 | 5122 | 3.0 | 0.005 | -0.04 | 1 |
| 2D4 | 5122 | 2.5 | 0.005 | -0.1 | 0.1 |
| 2D5 | 5122 | 2.5 | 0.005 | -0.1 | 0.01 |
 (a)
(a)
 (b)
(b)
|
 (c)
(c)
 (d)
(d)
|

IV.2.2 Charge distribution
Fig. 8 shows the charge distribution of Q-balls for the 2D1 simulation. We set the criterion for the identification of Q-balls. The distribution does not significantly change once the Q-balls of the three types are formed. This is consistent with our observation that major collisions are rare in the expanding universe. The distribution has a sharp peak at and the typical charge ranges over one order of magnitude .
Let us compare the existing result with ours. The maximal charge observed in the simulation of Ref. Kasuya:2001hg reads in our setup333Please notice that in Ref. Kasuya:2001hg , the treatment of 1D and 2D Q-balls is different from ours. The 2D Q-balls in Ref. Kasuya2001hg has an infinitely long sylindrical shape in 3D space.. This agrees very well with the above peak value.
We confirmed that the Q-balls formed at the intersections account for the largest Q-balls, especially those around the peak, while the Q-balls created from the sides and the voids form a long tail toward smaller charges. Thus we conclude that it is the filamentary structure that determines the charge distribution, for an orbit with a small ellipticity.

IV.2.3 Relationships among charge, energy and size
The gravity-mediation type Q-ball satisfies a relation between the charge and the energy, . To check this relation, we plot in the left panel of Fig. 9 the charge and the energy of the Q-balls in the 2D1 simulation. This figure shows that these quantities are strongly correlated, having an almost linear relation, for , as expected. Thus, it confirms that our numerical algorithm for the formation and the identification of Q-balls work well. We note however that the proportional coefficient is smaller than 1, which means that the orbit of the AD field in the phase space is not completely circular. Strictly speaking, those objects we have identified as Q-balls are not the Q-ball solution but slightly excited states of the Q-balls Enqvist:1999mv . This excitation may be due to the Hubble friction at the early time for the simulation. At the initial time, we set the initial field so that [see Eq. (7)]. The field, however, cannot generally keep the circularity of its orbit in the phase space while the Hubble friction works efficiently. Also, we will see the dimensional effect on the proportional coefficient in Sec. IV.3.3.
We have seen no further relaxation process toward the true Q-ball solution in our numerical simulations. This is a limitation of our analysis. However, since the coefficient is relatively close to , we expect that those objects will gradually approach the Q-ball solution in a much longer time scale 444The relaxation time may be extremely long due to an approximate adiabatic invariant Kasuya:2002zs ., without significantly affecting the charge distribution obtained here.
Before showing the relation between the charges and the sizes, we mention the definition of diameter of a Q-ball in this paper. The shape of a Q-ball identified by our algorithm is generically a distorted disk (ball in the 3D system). So, our procedure to calculate the diameter of a Q-ball is as follows. First, we measure the area (the volume in the 3D system) of the region on the grid in which the charge density is larger than the criterion. At this stage, the location of the boundary of a Q-ball is specified by the linear interpolation using the two values of at the adjacent grid points between which is realized. Then the definition of the diameter of a Q-ball in this paper is the diameter of the disk (a ball) with the same area (volume) as measured above, which is given in Eq. (23). For details, see Appendix B.

In the right panel of Fig. 9, we plot the relation between the size (diameter ) and the charge. The Q-ball solution has a certain size determined from the instability band shown in Eq. (6). We have found that all the Q-balls at least above have an almost same size, . This is another evidence that our numerical scheme correctly follows the Q-ball formation and collects the Q-balls. The spatial resolution in this simulation is presented as an arrow standing on the horizontal axis of Fig. 9, being much smaller than the typical size of a Q-ball. Hence the Q-balls are successfully identified on the lattices with sufficient spatial resolution.
IV.2.4 K-dependence
The strength of the instability is controlled by the coefficient of the one-loop corrections, . For a larger value of , the instability gets stronger and the Q-ball size becomes smaller. Thus, the final Q-ball charge distribution may depend on the value of .
Figure 10 shows the charge distributions at with and , corresponding to 2D1, 2D2 and 2D3, respectively, in Table 2. Although the charge distribution seem to shift toward larger values of Q as , no significant difference was observed.

The size (diameter ) and the charge of Q-balls in simulations 2D1-2D3 are shown in Fig. 11. Focusing on the large Q-balls with in each result 555The reason why we select the large ones is that the error in measuring the size is considered to be minimized. Smaller Q-balls tend to have smaller radius in our Q-ball identification algorithm due to the presence of the ambient background fluctuations., we can read the typical sizes as for , respectively. Thus we confirmed that the size approximately scales as . More specifically, we obtain at .

IV.2.5 Initial elliptic orbit
So far we have concentrated on the cases with [see Eq. (7) for its definition]. If the parameter is smaller than , the Q-ball formation and the charge distribution are significantly changed. However, the filamentary structure is still essential to understand the final distribution.
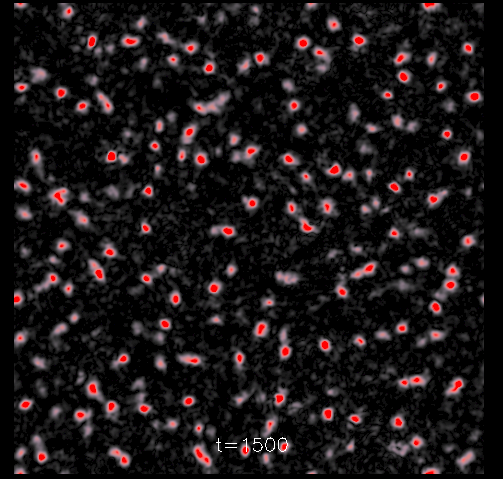
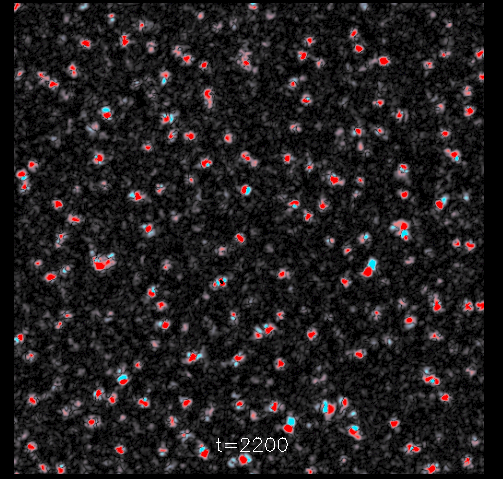
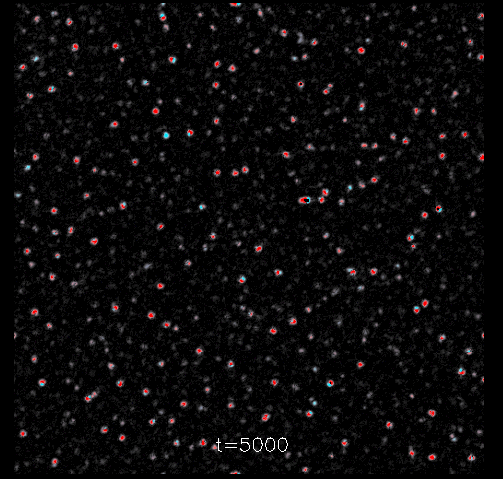
For , the initial orbit of the AD field becomes elliptic. It has been known that negative Q-balls, namely, Q-balls with a negative charge, appear in this case Kasuya:2000wx ; Enqvist:2000cq . This is because the AD field cannot grow into the Q-balls while keeping the energy-to-charge ratio . (Recall that the Q-ball solution satisfies .) Thus, the AD field must somehow discard its excessive energy to reach the Q-ball solution, while the total charge is conserved. This can only be achieved by changing the ratio locally; in reality, this results in producing negative Q-balls.
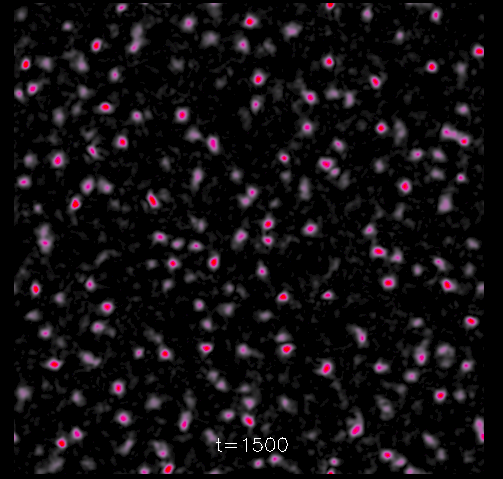
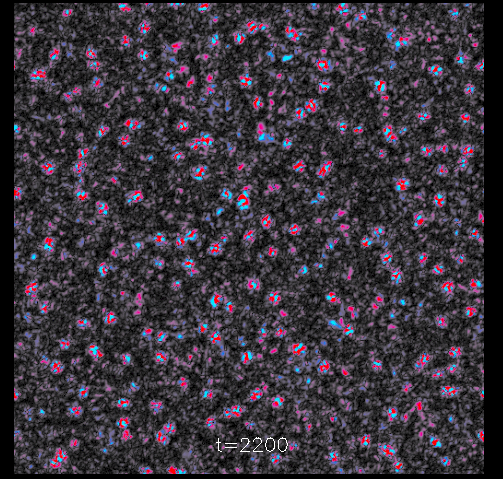
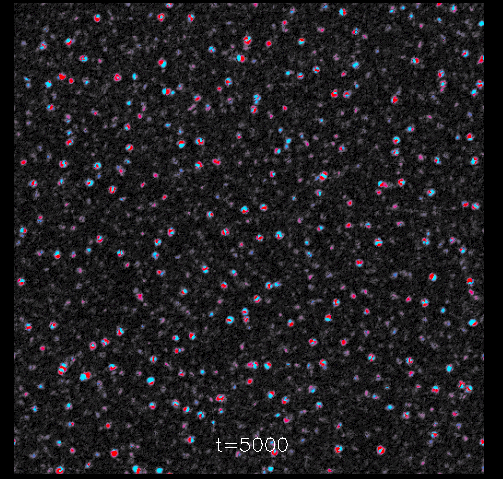
We have performed numerical simulations with (2D4) and (2D5). The snapshots of the spatial charge distribution at and are shown in Figs. 12 and 13, respectively. In these figures, the red represents the positive Q-balls and the cyan the negative ones. Let us first explain how the formation proceeds in the case of . As in the case of , the filamentary structure appears first [see the panel (a)]. As the field grows, the filaments are torn to smaller pieces and the proto-Q-balls are formed from intersections, sides and voids of the filaments. Similarly to the case of , the largest Q-balls are those from the intersections. At this stage, we call these Q-balls first-generation Q-balls. Almost all the first-generation Q-balls have a positive charge, as can be seen in the panel (b). Note that the first-generation Q-balls are in a highly excited state in a sense that they have large ratio. Around [the panel (c)], negative Q-balls (cyan) begin to be formed. The point to be emphasized here is that the negative (as well as positive) Q-balls, especially larger ones, appear around the existing first-generation Q-balls. If one takes a closer look, one may notice that a pair of positive and negative Q-balls is produced from one first-generation Q-ball. This observation clearly shows that the highly excited first-generation Q-balls release the excessive energy in a form of positive and negative Q-ball pairs. At [the panel (d)], the relaxation process has been almost finished. We call these Q-balls second-generation Q-balls to distinguish them from the first-generation Q-balls. We can see some isolated negative second-generation Q-balls, but most of them are still paired with the positive ones.
In the case of , the evolution is quite similar until the first-generation Q-balls are formed (the panel (b) in Fig. 13). The production of the negative Q-balls are more violent as can be seen from the panel (c). We can see multiple positive and negative Q-balls are produced from one first-generation Q-ball. This should be contrasted to the previous case that a pair of positive and negative Q-balls is produced. Most of the large negative and positive Q-balls remain paired even at . Note that the largest (positive or negative) Q-balls are produced from the largest first-generation Q-balls, which chiefly arise at the intersections of the filamentary structure. In the void regions, many small Q-balls appear in comparison with the case of . This may be induced by the energy released from the first-generation Q-balls in the violent relaxation process.
 (a)
(a)
 (b)
(b)
|
 (c)
(c)
 (d)
(d)
|
 (a)
(a)
 (b)
(b)
|
 (c)
(c)
 (d)
(d)
|
We expect that the filamentary structure also affects the final charge distribution, since it played an essential role in the Q-ball formation. Fig. 14 shows the charge distributions of positive and negative Q-balls. The upper panels are the result with , and the lower ones that with . We take the critical charge being proportional to as , since the initial charge density is proportional to . In the case of , most Q-balls are positive, and negative Q-balls are subdominant. The peak charge is approximately which indicates the scaling as . (Recall that the peak charge is for . See Fig. 8.) On the other hand, in the case of where the initial orbit is highly eccentric, almost the same number of positive and negative Q-balls are produced after . The peak charge is approximately until which agrees with the scaling. However, the scaling of the peak charge is no longer valid at Kasuya:2001hg .

In order to study how the Q-balls in an excited state approach toward the Q-ball solution, we show the energy and the charge of the Q-balls in the left panels of Fig. 15 and 16, and the relation between the size (diameter) and the charge in the right panels. In the figures, the green symbols (‘*’) represent the energy and charge of the first-generation Q-balls at , implying . Besides, the dependence of the size on the charge is somewhat large. These facts indicate the first-generation Q-balls shown here are highly excited states from the static Q-ball solution. The red symbols (‘’) and the blue ones (‘’) represent the positive and the negative Q-balls at , respectively. We can see that the energy-to-charge ratio decreases as time goes, while roughly keeping the proportionality between and , and the sizes become almost universal. The Q-balls seem to stop evolving after the ratio reaches . These figures manifestly show the relaxation process from the Q-balls in an excited state to a state with a lower value of .
The relaxation process of an excited state of Q-balls is a highly non-linear phenomenon, which can be studied only by numerical simulations. From our results shown above, we have reached conclusion that Q-balls in an excited state, namely having a large , continue to transform the excessive energy into multiple (positive and negative) Q-balls, until the ratio becomes as small as 666The Q-balls might have some amount of the angular momentum. However, we looked into the kinetic, potential and gradient energy of the Q-balls and found that the angular momentum is not the main source for the large ratio.. In the case of , or equivalently, , therefore, both positive and negative Q-balls are produced in the relaxation process, forming an almost symmetric charge distribution.
In the case with , we pointed out that the ratio is larger than 1 due to the Hubble friction. In the present case, however, the Hubble friction is no longer relevant at the formation of the second-generation Q-balls. Hence the fact that the second-generation Q-balls have somewhat large may be due to the highly non-linear interaction during the secondary formation process. To find out the reason, more detailed investigations on the secondary formation process are required, which is beyond the scope of this paper.


IV.3 3D
| ID | of grid | ||||
|---|---|---|---|---|---|
| 3D1 | 1283 | 1.0 | 0.005 | -0.1 | 1.0 |
| 3D2 | 1283 | 1.0 | 0.005 | -0.07 | 1.0 |
| 3D3 | 1283 | 1.6 | 0.005 | -0.04 | 1.0 |
| 3D4 | 1283 | 1.0 | 0.005 | -0.1 | 0.1 |
| 3D5 | 1283 | 1.0 | 0.005 | -0.1 | 0.01 |
IV.3.1 Filamentary structure
In this final section, we move on to 3D simulations. The parameter sets used are tabulated in Table 3.
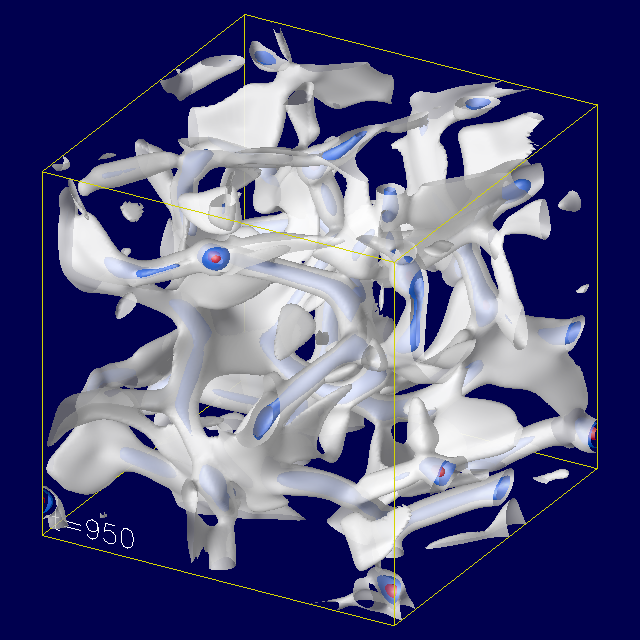
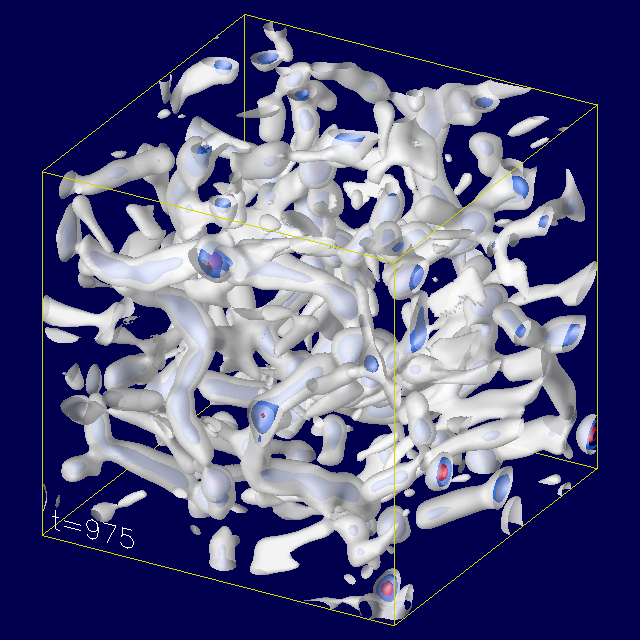
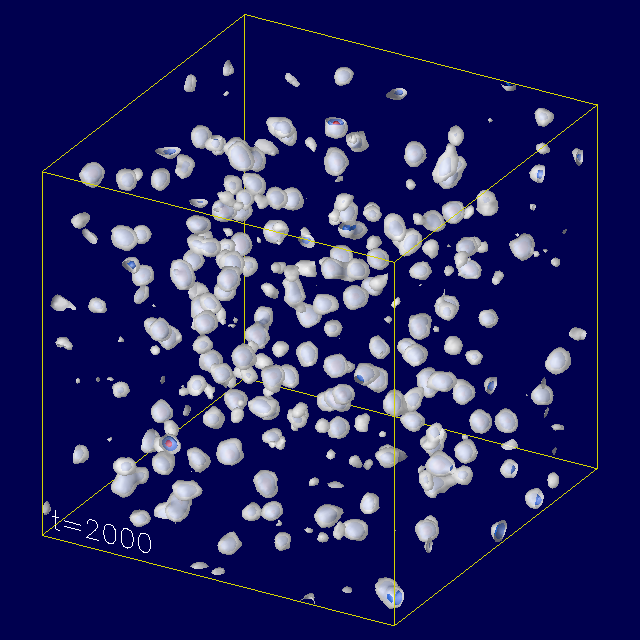
The snapshots of the spatial charge distribution with the parameter set 3D1 are shown in Fig. 17. The surfaces in the figures represent the isodensity surfaces of the charge density (white), (blue), and (red). The panels (a)–(d) correspond to and , respectively. As we have seen in the 2D results, we observed the filamentary structure that appears just before the Q-ball formation, and at each intersection, proto-Q-balls are formed represented by blue surfaces in the panel (a). At , Q-balls appear also on the sides, and at the same time, the Q-balls at the intersections grow which are represented by red surfaces. In the next panel (c), the filaments start to be torn to small pieces which eventually become small Q-balls. This panel shows manifestly that the Q-balls formed at the intersections hold large charges also in the 3D system, and thus they mainly contribute to the charge distribution. At the end of the simulation, , we observed that the number of Q-balls in a unit volume becomes shown in Fig. 18.
The authors of Ref. Kasuya:2000wx concluded that only a few number of Q-balls hold almost all charge of the whole simulation box. In contrast to this, our result indicates that, although the box size is smaller than that used in their simulations, there are quite large number of Q-balls with almost same size. This discrepancy may come from the difference of the spatial resolutions. In fact, while the resolution of the smaller box in their simulation is given by at the initial time, the one in our simulation is . Moreover, even at the formation epoch, the resolution is given by , and thus Q-balls are resolvable at the epoch. In compensation for the fine resolution, the box size in our simulation is smaller than the past one. Nevertheless, Fig. 17 indicates that the Q-ball formation caused by the collapse of the filamentary structure proceeds without being affected by the finite volume effect.
 (a)
(a)
 (b)
(b)
|
 (c)
(c)
 (d)
(d)
|

IV.3.2 Charge distribution
Fig. 19 shows the charge distribution of Q-balls for the 3D1 simulation. We set the criterion, . Basically, the Q-ball charges have a distribution similar to the 2D cases, and those mainly contributing to the total charge range over an order of magnitude, namely, . In Sec. V.1, we will perform the fitting of this distribution in consideration of the Poisson error of the number of Q-balls in each bin. As a result, the typical Q-ball charge is , which is somewhat larger than the previous result obtained by Kasuya et al. Kasuya:2000wx where they have concluded for , when expressed in terms of our terminology.

IV.3.3 Relationships among charge, energy and size
Following the previous discussion in Sec. IV.2.3, we investigate the relations among the charge and energy, and size. The left panel of Fig. 20 shows the charge and the energy of the Q-balls in the 3D1 simulation. Also in this 3D system, we can confirm that these quantities are strongly correlated, having an almost linear relation, for , as expected. Note however that the proportional coefficient is smaller than the one in the 2D cases. This small coefficient arises from the fact that the cosmic friction term in Eq. (2) is given by the spatial dimension. Thus the AD field tends to have a larger ellipticity in the 3D case compared to the 2D case, for a given initial condition in the phase space. As pointed out in Sec. IV.2.3, these objects we identified as Q-balls may be slightly excited states of the Q-balls, and it is expected that those objects will gradually approach the Q-ball solution in a much longer time scale than the current limitation of our numerical analysis.
In the right panel of Fig. 20, we plot the relation between the size (diameter ) and the charge (for the definition of the diameter, see the second paragraph in Sec. IV.2.3). The Q-ball solution has a certain size determined from the instability band shown in Eq. (6). We have found that all the Q-balls at least above have an almost same size, , and that the size is insensitive to the dimension since this is almost same as the one in the 2D system. The spatial resolution in this simulation is presented as an arrow standing on the horizontal axis of Fig. 20, being much smaller than the typical size of a Q-ball. Hence the Q-balls can be successfully identified on lattices also in the 3D system.

IV.3.4 K-dependence
The authors of Ref. Kasuya:2001hg have claimed that the largest charge of Q-balls in the 3D system depends on as . To investigate this, we plot the charge distributions with and in Fig. 21. These parameter sets are shown as 3D1, 3D2 and 3D3 in Table 3. Note that, in case with , the size of Q-ball becomes also larger. Hence we take a larger box than the other cases.
From Fig. 21, we cannot see any significant difference among different values of . Suffice it to say that the distribution for might be marginally skewed to large charges. However, to make this point clear, more realizations are required. If this is true, the deviation from the result of Ref. Kasuya:2000wx may rather widen because their result, for , would be smaller in the case with .

The size (diameter ) and the charge of Q-balls in simulations 3D1-3D3 are shown in Fig. 22. Focusing on the large Q-balls with in each result, we can read the typical sizes as for , respectively. Thus we confirmed that the size approximately scales as . More specifically, we obtain at .

IV.3.5 Initial elliptic orbit
As discussed in Sec. IV.2.5, for , the initial orbit of the AD field becomes elliptic in the phase space. The resultant extreme energy-to-charge ratio becomes smaller as a result that the Q-balls discard the excessive energy. In this process, the negative Q-balls are produced to conserve the total charge.
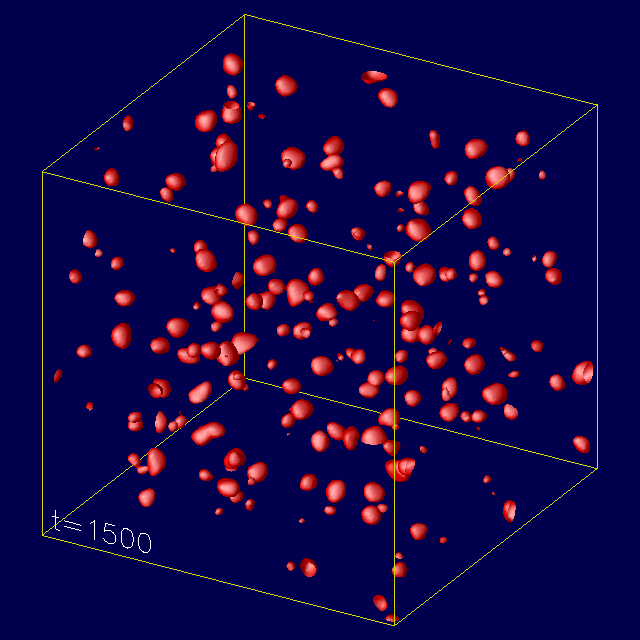
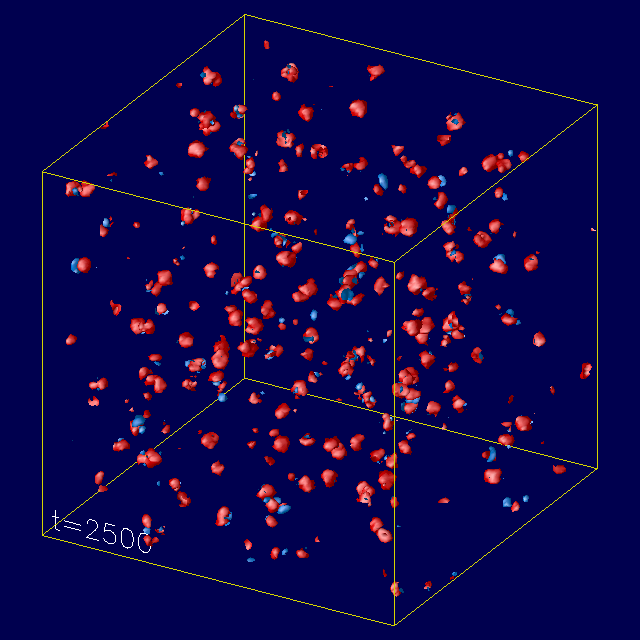
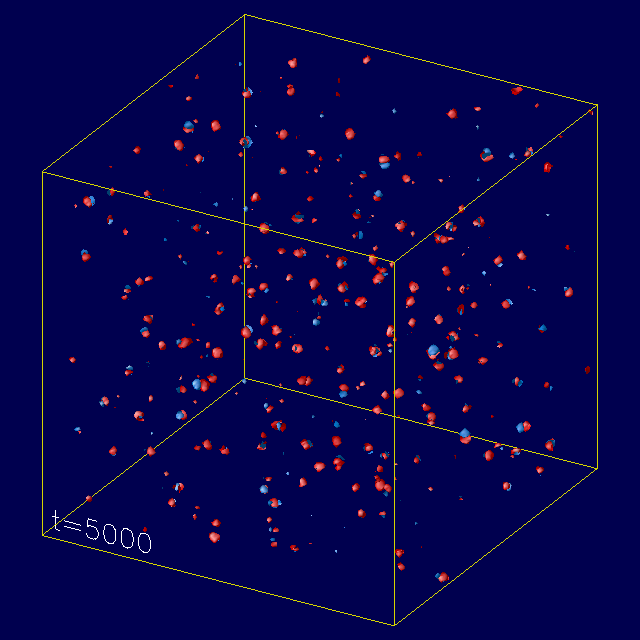
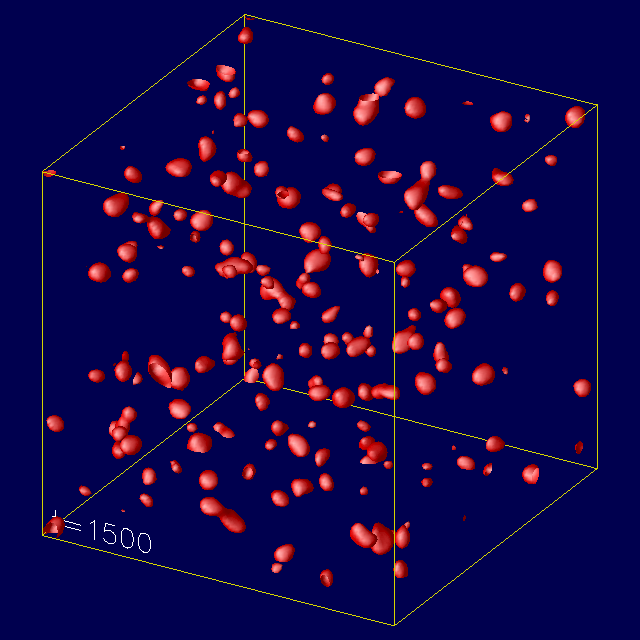
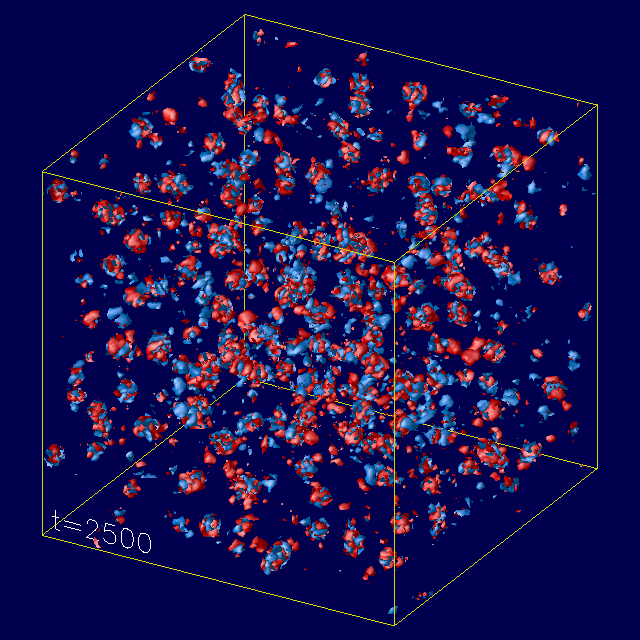
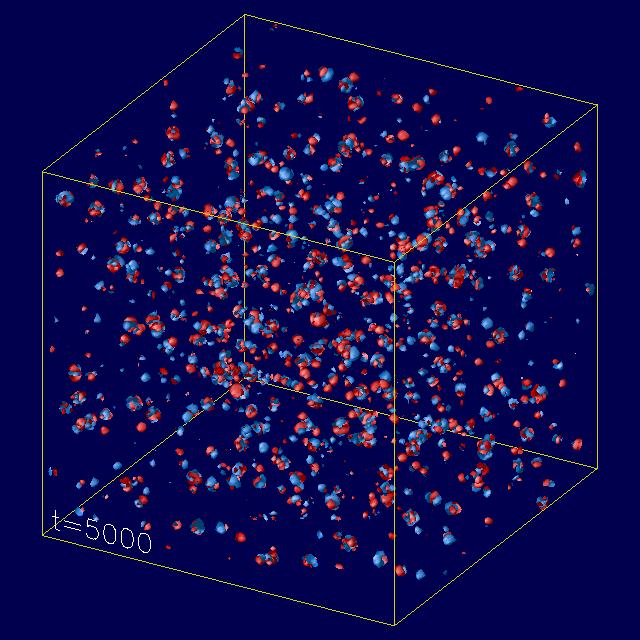
We have performed numerical simulations with (3D4) and (3D5). The snapshots of the spatial charge distribution at and are shown in Figs. 23 and 24, respectively. The first formation take place around , when the filamentary structure is constructed and torn to small pieces, as in the case with . Hence we omit the corresponding plots. The surfaces shown in these figures are the isodensity surfaces with , and the red indicates the positive Q-balls and the cyan the negative ones.
In the panel (a), we can see the first-generation Q-balls. As is same as the 2D cases in Sec. IV.2.5, the all Q-balls have positive charges. After that, the energy release from the them is started at , and as a result, the negative Q-balls appear around the first-generation Q-balls, which is shown in the panel (b). This process becomes more violent if is smaller.
At [the panel (c)], the relaxation process has been almost finished. We can see some isolated negative Q-balls, but most of them are still paired with the positive Q-balls. This process to form the second-generation Q-balls is quite similar to the cases in the 2D system. Due to the larger spatial dimension, however, it is observed that a larger number of the negative Q-balls appeared around one first-generation positive Q-ball.
 (a)
(a)
 (b)
(b)
 (c)
(c)
|
 (a)
(a)
 (b)
(b)
 (c)
(c)
|
Fig. 25 shows the charge distributions of the positive and negative Q-balls. The upper panels are the result with , and the lower ones that with . We take the critical charge . In the case of , almost all the Q-balls are positive, and negative Q-balls are subdominant. The peak charge is approximately which indicates the scaling as . (Recall that the peak charge is for . See Fig. 19.) On the other hand, in the case of , almost same number of positive and negative Q-balls are produced after . The peak charge is approximately until which agrees with the scaling. However, the scaling of the peak charge becomes invalid at . We have confirmed that it is the Q-balls at the intersections that give dominant contribution to the peak of the charge distributions. In particular, large positive and negative Q-balls are found at the intersections in the case of .

To see the relaxation process where the excited Q-balls change to the states having lower values of , we show the energy and the charge of the Q-balls in the left panels of Fig. 26 and 27, and the relation between the size (diameter) and the charge in the right panels. In the figures, the green symbols (‘*’) represent the energy and charge of the first-generation (excited) Q-balls at , implying , and the red symbols (‘’) and the blue ones (‘’) represent the positive and the negative Q-balls at , respectively.
As is similar to the 2D system discussed in Sec. IV.2.5, we can see that the energy-to-charge ratio decreases as time goes, while roughly keeping the proportionality between and , and the sizes become almost universal. Looking closely, we found that the minimum energy-to-charge ratio is approximately at , and there seems to be a barrier which forbids Q-balls to take a smaller value of . As is pointed out in Sec. IV.2.5, this ratio may be determined by the highly non-linear interaction during the secondary formation process. The relaxation process in which the value of eventually becomes proceeds quite slowly even though there is such a process. Hence it can be concluded that, in general, the second-generation Q-balls acquire values of .
To summarize this section, we have observed that the filamentary structure plays an essential role both in the Q-ball formation and in the final charge distribution. Large (positive and negative) Q-balls are created at the intersections of the filaments, while small ones in the sides and voids.


V Applications
In this section we show how the Q-ball charge distribution obtained in our numerical simulations affects the cosmological impact of the Q-balls. We consider the decay and evaporation processes in the following.
V.1 Fitting formula
First let us give a fitting formula of the charge distribution. For simplicity we hereafter focus on the case of . The distribution function is defined such that the number density of Q-balls with a charge between and at the time is equal to . In terms of , the number of Q-balls with a charge in a comoving volume, it is written as
| (9) |
Recall that the scale factor is normalized as , where . The numerical result of is shown in Fig. 19. In order to obtain a fitting formula, we adopt the following form,
| (10) |
where . Assuming that the dominant source for the statistical error comes from following the Poisson distribution, we have fitted the above form to the charge distribution at shown in Fig. 19, and obtained obtained , , and . The fitting function and the charge distribution are shown in Fig. 28 where the vertical axis is at , being equivalent to Fig. 19. Note that the above fitting formula is valid only for and the charge between . According to the fitting formula, the charge distribution at is peaked at
| (11) |
which is greater than the result of Ref. Kasuya:2000wx by about .

V.2 Decay
The decay of the Q-balls proceeds only in the vicinity of the surfaces, and the decay rate is known to be bounded above Cohen:1986ct ,
| (12) |
where is the surface area and denotes the energy per unit charge of the Q-ball, respectively. According to Ref. Cohen:1986ct , the decay rate is indeed almost saturated. In the case of the gravity-mediation type Q-ball, the decay rate is then given by
| (13) |
where we have used and . Note that the decay rate is a decreasing function of ; larger Q-balls are more long-lived.
Now let us estimate the Q-ball contribution to the total energy at the decay. Those Q-balls between and decay when , emitting the radiation density :
| (14) |
where denotes the total energy density at the decay. Using (10), the distribution at the decay is given by
| (15) |
where denotes the Hubble parameter at the reheating. Thus the fractional contribution is proportional to , which is multiplied by an additional factor with the charge distribution. Although the peak may be shifted due to the additional factor , we may neglect it in practice. We may use the charge at the peak to estimate the decay rate of the Q-ball. The decay rate then turned out to be about smaller than the existing result Kasuya:2000wx .
V.3 Evaporation
Through the interaction with the ambient thermal plasma, some amount of charges are evaporated from Q-balls Laine:1998rg ; Banerjee:2000mb . For a given thermal history, we can estimate the evaporated charge . For the gravity-mediation type Q-balls, the evaporated charge is given by
| (16) |
if the reheating temperature is higher than the weak scale.
Before our work, it was customary to assume that almost all the charge is absorbed into the largest Q-balls with a charge close to . Then the fraction of the evaporated charge is estimated by . Since we have obtained a fitting formula for the charge distribution, (the time variable is dropped for simplicity), we can estimate the fraction more precisely as
| (17) |
Using the result (10), the fraction of the evaporated charge reads and for and , respectively. Thus the evaporated charge turns out to be larger than the previous result.777Note that we here focus on the difference arising only from the crude approximation of neglecting the charge distribution. If we take account of the difference in , the discrepancy becomes larger, but in the opposite direction. Since the fitting formula may underestimate the charge distribution for , the discrepancy may be actually much greater for . If this is the case, it may be an obstacle for realizing a large hierarchy between the baryon and lepton asymmetries through the Q-balls Kawasaki:2002hq .
VI Conclusion
In this paper, we have studied physical properties of the gravity-mediation type Q-balls in the AD mechanism on 1D, 2D and 3D lattice simulations with the cosmic expansion.
We have found that including cosmic expansion has a crucial effect on the Q-ball formation and its subsequent evolution, using the 1D lattice simulations. In the non-expanding background, the Q-ball interactions through collisions never decouple until one large Q-ball is formed. In fact, we confirmed the finite box effect in our simulations without cosmic expansion. On the other hand, in the expanding background, the major collisions among large Q-balls do not occur frequently. Even in the cases of the 2D and 3D simulations, we expect that, without the cosmic expansion, the Q-ball evolution would be quite different.
In various setups with the cosmic expansion, we have performed simulations in 2D and 3D systems to obtain the charge distributions of the Q-balls. For the initial circular orbit with , the charge at the peak of the distribution is and .
We have found that filamentary structure is formed when the initial fluctuation becomes of order unity, as pointed out in Ref. Enqvist:2000cq . One of our new observations is that this filamentary structure plays an important role in the Q-ball formation and affects the final charge distribution. In particular, the Q-balls forming the peak of the distribution are mainly produced at the intersections of the filaments, while Q-balls produced from the side and void region have generically small charges and do not give main contribution to the charge distribution. Note however that these small Q-balls overwhelm the large Q-balls in the number. This argument holds true for a small value of , in which large positive and negative Q-balls are mostly produced from the excited Q-balls at the intersections. (We call the latter as the first generation Q-balls and the former as the second generation Q-balls in the text.)
We have compared the empirical formula derived in Ref. Enqvist:2000cq to our numerical results on the charge (not number) distribution on the 2D lattice and found that, if we fit the formula at the peak of the charge distribution, it underestimates the charge distribution at smaller . In contrast to the claim made by Ref. Enqvist:2000cq , therefore, we conclude that these small Q-balls do not play any significant role to determine the Q-ball distribution. We also mention here that we stopped following the evolution once the Q-balls become no longer resolved compared with our simulation grid size, in order to avoid mis-identification of background fluctuations with the Q-balls as well as unphysical effects on the Q-ball evolution. This also may be the reason for the difference of ours from the results in the past.
Our findings, especially detailed charge distribution of the Q-balls, will be very important for the AD baryogenesis and related topics, because the Q-balls are an essential ingredient of the mechanism. For instance, the Q-ball decay temperature is modified accordingly, which affects the resultant dark matter density in a scenario that the lightest SUSY particles are produced from the Q-ball decay. Also the charge distribution gives a lower bound on the evaporated charge, which in turn makes it difficult to realize a large hierarchy between the baryon and lepton asymmetries in the scenario using the L-balls.
Lastly we mention the limitation of our numerical simulations. Strictly speaking, the Q-balls we identified in the simulations are in a excited state, in a sense that the ratio is slightly larger than . We expect that these Q-balls will in the end relax to the Q-ball solution, emitting the excessive energy. Also we have neglected the interactions of the AD field with gauge fields and other matter fields. We leave these issues as well as further exploration of the application of our results for future work.
Acknowledgements.
We thank S. Kasuya for helpful discussions. The work of F.T. was supported by JSPS Grant-in-Aid for Young Scientists (B) (21740160). M.K. and F.T. were supported by the Grant-in-Aid for Scientific Research on Innovative Areas (No. 21111006). This work was supported by World Premier International Center Initiative (WPI Program), MEXT, Japan.Appendix A Numerical schemes
The Q-balls are formed through the dynamical instability of the tiny fluctuations induced at the initial time. Until the formation epoch of the Q-balls, it takes a long time, typically a few hundreds of oscillation periods of the background field. Hence a higher-order numerical scheme is required so that the results does not suffer from the global error when we follow the evolution of the AD field. In this paper, we used a 6th-order symplectic integrator developed by Yoshida Yoshida:1990zz .
If we write the time evolution for a time step as a mapping, , the well-known 2nd-order leap-frog scheme can be described as
| (18) |
where is the time step, and the operators and map the field and its time-derivative at a time slice to those at the next time slice ,
| (19) | ||||
| (20) |
In Eq. (20), the second derivative of is replaced by and using the equation of motion of [see Eq. (2)]. Using this symbolic representation, we can describe the 6th-order scheme as Yoshida:1990zz
| (21) |
where the coefficients and are given in Table 4 and . As implied in Eq. (20), the function evaluation, in the present case, is included only in . Therefore this scheme is 7 stages.
As for the spatial derivative, i.e. the Laplacian operator in Eq. (2), we used the finite difference scheme called as 3-, 5- and 7-point formulas for 1D, 2D and 3D, respectively. For example, in the 3D cases, we replace the Laplacian by
| (22) |
where . This derivative is computed at each stage just before the function evaluation.
Appendix B identification of Q-balls
In order to identify a Q-ball in the simulation box, we developed an identification method based on the Marching Cube algorithm with some modifications. The Marching Cube method has been frequently used in imaging analyses Lorensen:1987 .
We obtain the field data, , from the simulations, and can easily compute the charge density, , on the grid. In this charge density field, we regard the region in which the charge density exceeds the critical value, , as a Q-ball. In accordance with the sign, we call positive Q-ball and negative Q-ball ().
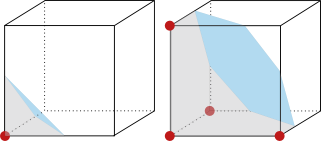
Looking closely at a grid cell containing a portion of Q-ball boundaries, the boundary piece lies in the grid cell as shown, for example, in Fig. 29. The left cell in the figure is an example of the case where there is only a grid point exceeding the critical value, represented by red sphere. The cyan triangle is a piece of the boundary of a Q-ball, and the gray region represents the inner region of the Q-ball. The right cell in the figure is an example of a case where there are four points exceeding the critical value. The location of the boundary, namely, the spatial coordinate satisfying on the sides of the grid cell, is determined by the linear interpolation between the adjacent grid points.
In accordance with the spatial dimension, there are several patterns of the shape of Q-ball boundary pieces in a grid cell. In the 1D case, there are only 1 pattern in which the boundary cuts a line segment (1D cell). In the 2D cases, we have 4 patterns: a triangle (or, inversely, a pentagon), a trapezoid, a hexagon, and two triangles in a 2D cell. Note that the last pattern indicates that there are parts of two Q-balls in the cell. In the 3D cases, we have 14 patterns including Fig. 29. The all patterns in 3D are shown in Figure 3 in Ref. Lorensen:1987 .
Our algorithm identifying Q-balls is quite simple. First we seek local peaks of the charge density field satisfying , which are candidates of center of individual Q-balls. Then we seek the boundary outward from the cell containing the peak. At the same time, the energy density and charge density of each grid cell are computed. Coming to the boundary, we classify the grid cell in the patterns mentioned in the previous paragraph, and compute the location of the boundary piece. Finally, integrating the charge density and energy density over the region identified as a Q-ball, we obtain the charge, energy and the (-dimensional) volume of the Q-ball. The size (diameter) of the Q-ball is calculated assuming that the shape of the Q-ball is disk (2D) or ball (3D) with the same area (2D) or volume (3D). Hence the diameter of the Q-balls is given by
| (23) |
where is the -dimensional volume.
If by chance there are more than two peaks of the charge density field in the region satisfying , the present scheme counts redundantly multiple Q-balls. Hence, at the final stage of this algorithm, the redundant Q-balls are eliminated.
References
- (1) S. R. Coleman, Nucl. Phys. B 262, 263 (1985) [Erratum-ibid. B 269, 744 (1986)].
- (2) A. Kusenko, Phys. Lett. B 405, 108 (1997) [arXiv:hep-ph/9704273].
- (3) G. R. Dvali, A. Kusenko and M. E. Shaposhnikov, Phys. Lett. B 417, 99 (1998) [arXiv:hep-ph/9707423].
- (4) A. Kusenko and M. E. Shaposhnikov, Phys. Lett. B 418, 46 (1998) [arXiv:hep-ph/9709492].
- (5) K. Enqvist and J. McDonald, Phys. Lett. B 425, 309 (1998) [arXiv:hep-ph/9711514].
- (6) I. Affleck and M. Dine, Nucl. Phys. B 249, 361 (1985); M. Dine, L. Randall and S. D. Thomas, Nucl. Phys. B 458, 291 (1996) [arXiv:hep-ph/9507453].
- (7) S. Kasuya and M. Kawasaki, Phys. Rev. D 62, 023512 (2000) [arXiv:hep-ph/0002285].
- (8) K. Enqvist and J. McDonald, Phys. Lett. B 440, 59 (1998) [arXiv:hep-ph/9807269]; Nucl. Phys. B 538, 321 (1999) [arXiv:hep-ph/9803380].
- (9) A. G. Cohen, S. R. Coleman, H. Georgi and A. Manohar, Nucl. Phys. B 272, 301 (1986).
- (10) S. Kasuya and M. Kawasaki, Phys. Rev. D 61, 041301 (2000) [arXiv:hep-ph/9909509].
- (11) S. Kasuya and M. Kawasaki, Phys. Rev. D 64, 123515 (2001) [arXiv:hep-ph/0106119].
- (12) K. Enqvist, A. Jokinen, T. Multamaki and I. Vilja, Phys. Rev. D 63, 083501 (2001) [arXiv:hep-ph/0011134].
- (13) T. Multamaki and I. Vilja, Phys. Lett. B 535, 170 (2002) [arXiv:hep-ph/0203195].
- (14) M. I. Tsumagari, Phys. Rev. D 80 (2009) 085010 [arXiv:0907.4197 [hep-th]].
- (15) K. Enqvist, S. Kasuya and A. Mazumdar, Phys. Rev. D 66 (2002) 043505 [arXiv:hep-ph/0206272].
- (16) H. Yoshida, Phys. Lett. A 150 (1990) 262.
- (17) W.E. Lorensen and H.E. Cline, Comput. Graph. 21 (1987) 163.
- (18) http://www.opendx.org
- (19) K. Enqvist and J. McDonald, Nucl. Phys. B 570, 407 (2000) [arXiv:hep-ph/9908316].
- (20) S. Kasuya, M. Kawasaki and F. Takahashi, Phys. Lett. B 559, 99 (2003) [arXiv:hep-ph/0209358].
- (21) M. Laine and M. E. Shaposhnikov, Nucl. Phys. B 532, 376 (1998) [arXiv:hep-ph/9804237].
- (22) R. Banerjee and K. Jedamzik, Phys. Lett. B 484, 278 (2000) [arXiv:hep-ph/0005031].
- (23) M. Kawasaki, F. Takahashi and M. Yamaguchi, Phys. Rev. D 66, 043516 (2002) [arXiv:hep-ph/0205101].