Long-term Evolution of Protostellar and Protoplanetary Disks. I. Outbursts
Abstract
As an initial investigation into the long-term evolution of protostellar disks, we explore the conditions required to explain the large outbursts of disk accretion seen in some young stellar objects. We use one-dimensional time-dependent disk models with a phenomenological treatment of the magnetorotational instability (MRI) and gravitational torques to follow disk evolution over long timescales. Comparison with our previous two-dimensional disk model calculations (Zhu et al. 2009b, Z2009b) indicates that the neglect of radial effects and two-dimensional disk structure in the one-dimensional case makes only modest differences in the results; this allows us to use the simpler models to explore parameter space efficiently. We find that the mass infall rates typically estimated for low-mass protostars generally result in AU-scale disk accretion outbursts,as predicted by our previous analysis (Zhu et al. 2009a, Z2009a). We also confirm quasi-steady accretion behavior for high mass infall rates if the values of -parameter for the magnetorotational instability is small, while at this high accretion rate convection from the thermal instability may lead to some variations. We further constrain the combinations of the -parameter and the MRI critical temperature, which can reproduce observed outburst behavior. Our results suggest that dust sublimation may be connected with full activation of the MRI. This is consistent with the idea that small dust captures ions and electrons to suppress the MRI. In a later paper we will explore both long-term outburst and diskevolution with this model, allowing for infall from protostellar envelopes with differing angular momenta.
Subject headings:
accretion disks, stars: formation, stars: pre-main sequence1. Introduction
In the standard model of low-mass star formation, a molecular cloud core collapses to a protostar over timescales of yr (e.g., Shu, Adams, & Lizano 1987), consistent with observations (Kenyon et al. 1990; Enoch et al. 2008). However, steady accretion of this mass onto central stars with a plausible mass-radius relationresults in accretion luminosities that are larger than those observed in low-mass protostars (Kenyon et al. 1990, 1994; Enoch et al. 2009). One solution to this “luminosity problem” is that most infalling matter first falls to the circumstellar disk and then is accreted to the star during short-lived outbursts; in this model protostars are usually observed in quiescence. The FU Orionis objects provide direct evidence for this type of behavior, with maximum accretion rates of over periods of decades to centuries (Hartmann & Kenyon 1996), which also directly suggests 10-2 M⊙ in the disk at 1 AU.
A number of theories have been proposed to explain FU Orionis outbursts, including thermal instability in the inner disk (Bell Lin 1994), binary interactions (Bonnell & Bastien, 1992), and gravitational clumping at several AU (Vorobyov Basu 2005, 2006). In a recent paper (Z2009a), we explored the possibility that outbursts might result because of a mismatch between the mass fluxes that can be transported by the magnetorotational instability (MRI) in the inner disk, and the gravitational instability (GI) in the outer disk. Using steady thin disk theory, we argued that outbursts are to be expected when disks are driven by mass addition lower than 10, as initially found by Armitage, Livio, & Pringle (2001). We then developed a two-dimensional model of FU Orionis disks, which verified that outbursts of accretion similar to those observed could be produced using reasonable parameters for MRI transport when thermal ionization dominates (Z2009 b).
The computationally-intensive nature of two-dimensional (let alone three-dimensional) simulations of outbursts makes it difficult to conduct studies of the effects of differing parameters on disk evolution over significant timescales. We have therefore developed one-dimensional disk models to follow disk evolution. While such models have limitations, they can serve as a starting point to investigate the landscape of possible disk evolutionary pathways. The diversity of disk properties among stars of nearly the same age and mass (e.g., Hartmann 2009) is plausiblythe result of differing initial conditions, and models of the type we explore here can begin to address this possibility.
In §2 we describe our 1-D, two-zone model, and compare its outburst properties with our 2-D models in §3. In §4 we present the results of a parameter study designed to show when outbursts occur and how the outburst strength and frequency depend on the adopted parameters. We present our discussion and conclusions in §5 and §6. The present work, in which we assume constant mass addition to the outer disk, serves as a starting point for our subsequent investigation of long-term disk evolution with mass addition due to infall from a rotating protostellar envelope in a following paper.
2. One-dimensional two-zone models
In this paper we adopt a version of the “layered accretion” disk model originally put forward by Gammie (1996). In this model, unless the disk is warm enough that thermal ionization is sufficient to couple the magnetic field effectively to the neutral disk material, only an upper layer of the disk can sustain the MRI due to non-thermal ionization by cosmic and/or X-rays. A significant amount of work has been done to study the properties of the active layer (e.g. Sano et al. 2000, Turner & Sano 2008, Bai & Goodman 2009), however due to the complex physics and chemistry involved, further theoretical or even observation study is needed. Here, we assume that the mass column density which can be ionized is roughly constant with radius (see, e.g., Glassgold, Najita & Igea 2004). If the total disk surface density in the “cold” regions is less than the limiting active layer column density , the disk is assumed to be completely viscous with a given viscosity parameter due to MRI activity. On the other hand, if the disk surface density is higher than this limit, then only the surface layers are assumed to exhibit the MRI.
Our one-dimensional, two-zone models (1D2Z) thus in general exhibit two layers: the surface layer and the central or “dead” zone 111Here ”dead” refers to magnetically dead without MRI but it could transport angular momentum due to the gravitational instability. with surface density . The dead zone is assumed to have little or no MRI activity, though it may exhibit transport due to GI (see below). The temperatures Ta and Td are averages which characterize the corresponding layers.
The surface density evolves according to the mass conservation and angular momentum conservation equations,
| (1) |
| (2) |
where is the radial mass flux in the disk, the stress , and subscript denotes either ’a’ (active layer) or ’d’ (dead zone).
Assuming Keplerian rotation, equations (1) and (2) can be simplified to
| (3) |
where . The constant infall rate is set as an inflow outer boundary condition with =10-4, 10-5, and 10-6.
The parameter is the maximum non-thermally ionized surface density, assumed constant during each calculation. If at a given timestep , the excess mass of the active layer (-) is added to the dead zone (=+-). Conversely, if and , part of the dead zone is assumed to be non-thermally ionized, in which case is set to be and decreases to . Setting is a crude approximation; it is likely that varies with radius and depends on the local abundance of dust and flux of ionizing radiation.
The temperatures are determined by the balance between the heating and radiative cooling,
| (4) |
where the heat capacity is =. For the active layer, the cooling rate is determined by
| (5) |
where is the Stefan-Boltzmann constant, represents the irradiation from the central star, and is the optical depth of the active layer. The final factor in equation (5) is an approximate form which accommodates both optically thin and thick cooling. We assume
| (6) |
where is the total luminosity of the star and accounts for the non-normal irradiation of the disk by the central star; here we set . The active layer optical depth is given by
| (7) |
where is the Rosseland opacity derived from Z2009a at the active layer density and temperature, , , and and are the scale height of the active layer and the dead zone.
The dead zone has a cooling rate similar to that of the active layer. If the active layer is optically thick, the incident radiation flux into the dead zone from the active layer is T. Thus the cooling rate is
| (8) |
with
| (9) |
However, if the active layer is optically thin, the incident flux becomes (T+T), and
| (10) |
With increasing temperature the radiative cooling time, which constrains the numerical timestep, becomes small. For computational efficiency we then make the equilibrium approximation
| (11) |
when the disk midplane temperature is K.
The heating rate of the dead zone is just the viscous heating rate, while, in the active layer, the heating rate consists of its own viscous heating and the radiation from the underlying dead zone:
| (12) |
In the case when the active layer is optically thin, this equation is modified to
| (13) |
The viscous heating term is
| (14) |
where . To evaluate the viscosity , we have considered both MRI and GI transport. The net viscosity is the sum of both,
| (15) |
where and
| (16) |
The MRI viscosity is assumed to have a fixed value of whether the region in question is thermally or non-thermally ionized. We assume that above some critical temperature the MRI is fully activated throughout the disk with viscosity parameter . The Toomre instability parameter is evaluated using the disk central (midplane) temperature Td, the total surface density (+), and assuming Keplerian rotation. The form of is motivated by a desire to make gravitational torques significant only when , as indicated by global three-dimensional simulations (e.g., Boley et al 2006).
There are uncertainties in adopting the above approach to transport. GIs involve large scale density waves that cannot be captured with a local viscous treatment, although local treatments are adequate under some circumstances (Lodato & Rice, 2004; Cossins et al., 2009). As discussed in Z2009a, the essential properties of this treatment are the assumptions that disks with GI have -values of order unity, and that the GI produce local dissipation of the accretion energy. Under these assumptions, the precise form of will not affect the disk’s evolution, as long as is a steeply declining function of Q near 1.5. To make this point clear, we ran the same simulation for a test case but with the prescription of Lin & Pringle (1987,1990). As expected, the different forms of have no effect on the disk outbursts.
Similarly, whether the MRI can be fully activated in a non-thermally-ionized layer depends in part upon whether small dust grains have been sufficiently depleted (e.g., Sano et al. 2000). This is a complicated problem with substantial observational and theoretical uncertainties; we therefore adopt the simplest possible approach. It turns out that the value of is unimportant for understanding large outbursts (Z2009a), as long as the GI in the dead zone transports more mass than the active layer; but does have important effects on the long-term disk evolution at low accretion rates, as discussed in a following paper.
It is now clear that the magnetic fields that give rise to diffuse radially (Lesur & Longaretti 2008, Guan & Gammie 2009, Fromang & Stone 2009) and take time to build up and decay (e.g. Hirose et al. 2009). To account for these effects we introduce an evolution equation for :
| (17) |
where is the equilibrium value for . The first term permits to relax up, or down, as is crossed. The second term corresponds to radial diffusion of the magnetic field. For numerical reasons we set the dimensionless radial diffusion coefficient to (the radial diffusion coefficient is actually a function of distance from the midplane).
3. Outburst behavior
In the protostellar phase, the disk is unlikely to transport mass steadily from 100 AU all the way to the star at an accretion rate matching the mass infall rate from the envelope to the outer disk. This mismatch leads to outbursts which are qualitatively similar to that found by Armitage et al. (2001), Book & Hartmann (2005), and in our 2-D hydrodynamic simulations (Z2009b). In summary, before the outburst, mass added to the outer disk moves inwards due to GI, but piles up in the inner disk as GI becomes less effective at smaller radii. Eventually, the large and energy dissipation leads to enough thermal ionization to trigger the MRI at several AU. The MRI front quickly moves in across the inner disk and the inner disk accretes at a higher mass accretion rate, resembling FU Orionis-type outbursts. This high mass accretion rate during the outburst also makes the inner disk thermally unstable. After the inner disk has been drained by the outburst and becomes too cold to sustain the MRI, the disk returns to the low state. With the mass continuously accreted from the outer radii (or from an infalling envelope), the disk evolves to conditions leading to another outburst. This MRI triggered by GI outburst can also be understood as the classical thermal instability, but the S-curve is formed primarily by the variation of near TM, rather than variations in opacity and assumed variation in near hydrogen ionization (e.g. Bell & Lin (1994)).
To test how 1D2Z models simulate the outbursts compared with 2-D simulations, we set up a test case with all the parameters adopted from our previous 2-D simulations (Z2009b). In both 1-D and 2-D simulations, we have used an updated opacity from Z2009a and TM=1500 K . Because Z2009b do not consider irradiation, the irradiation factor f in equation (6) for the 1D2Z simulation is set to be 0. The inner radius in both cases is set to 0.2 AU.
Figure 1 shows the mass accretion rate as a function of time for both 1-D and 2-D simulations. As shown, the 1-D simulations closely resemble 2-D simulations at the equilibrium states, such as the state before the outburst is triggered and the state during the outburst. For some rapid, or small scale, disk variations, such as the MRI front propagation and the convective eddies in the hot inner disks, the 2-D simulations exhibit more complex behavior than the 1-D simulations, so the outbursts differ in detail. In particular the 1-D simulations show an initial high peak at the beginning of the outburst that is not seen in 2-D. The 1-D simulations also show “drop outs” in accretion that do not occur in 2-D.
In detail, starting from the MRI activation at 2 AU, the MRI active region moves inwards. During this process, mass piles up at the inner boundary of the active region, because the disk is MRI active beyond this boundary and has a higher mass accretion rate than the MRI inactive disk at smaller radius. In 1-D simulations, which do not capture the effects of radial pressure gradients, mass piles up at this boundary. When this mass eventually accretes on to the central star there is a sharp peak in .
The drop-outs during outbursts in the 1-D simulations are related to the thermal instability associated with hydrogen ionization. The drop-outs occur when the inner disk returns to the TI low state in 1-D; in 2-D radial and vertical convection smooths out variations in the accretion rate and allows the inner disk to remain in the high state.
Despite the initial peak and the drop-outs in the 1-D model, the outburst timescale, , and consequently the total mass accreted during one outburst are similar in 1-D and 2-D simulations (Fig. 1). This similarity is due to the fact that the outburst timescale and are just determined by the radius where the MRI is triggered and by ; the total mass accreted during one outburst is the mass difference before and after the outbursts, which are both equilibrium states.
4. Parameter study
Having tested that the 1-D models reproduce the general properties of the outbursts (maximum , duration time, etc.), we next turn to a parameter study with 1-D models to test the predictions of Z2009a using steady state models.
The radial range considered is from 0.2 AU to 30 AU. We adopt a constant inflow boundary condition at 30 AU. The inner boundary 0.2-0.3 AU is chosen to avoid instabilities which occur at the smallest radius where there is a transition between thermal and non-thermal activation of the MRI, here called .
We find that, at least for our phenomenological model, is unstable. Wünsch et al. (2006) has also found even with a 2-D radiative transfer hydrodynamic layered model, this instability still occurs. oscillates around a mean radius, with thermal fronts washing inward and outward. This is similar to thermal instability but due to variations between the dead zone and the inner MRI active region (Wünsch et al., 2006). However, we should be cautious in this instability, especially since dust may be sublimated before MRI activation. Then the inner disk may become optically thin due to the low opacity of the gas, and direct irradiation from the central star would ionize the dust wall. A proper treatment of needs a 3-D MHD simulation with irradiation, dust physics, and ionization physics. Because this treatment is impractical, we set the inner boundary of our model just outside . depends on a variety of parameters (central star luminosity, the irradiation angle to the disk’s surface, active layer surface density, the MRI trigger temperature and its viscosity parameter). Generally, increases as the heating rate increases. In the end we set the inner boundary to AU if =0.01 and 0.3 AU if =0.1.
The infall is treated as a constant mass inflow at the disk outer edge at 30 AU. This assumption may not be applicable to study the disk’s long-term evolution during the entire infall stage (105 years) since the infall centrifugal radius increases with time; this is explored extensively in Paper II (Zhu et al. 2010b). Over the timescale of a single outburst, as studied in this paper, this assumption is a good approximation as long as the infall centrifugal radius is larger than the MRI stable radius (RM 1-10 AU in Figure 8).
Because protostars are thought to form over few yr, the average infall rate should be 10-6-10 (Stahler 1988; Hartmann et al. 1997); numerical simulations suggest the infall rate could be up to 10 at the earliest stages (Bate et al. 2003). Thus we study the disk evolution with infall rates varying from 10 to 10.
We neglect any change in the central star mass over the outburst timescale, which is a reasonable approximation. The effect of changing central mass over longer evolutionary timescales is included in Paper II.
What is ? Observations of dwarf novae, X-ray binaries, and FU Ori suggest (King et al. 2007; Zhu et al. 2007). T Tauri disk observations suggest (Hartmann et al. 1998). MHD simulations suggest , with the precise value depending on the resolution, treatment of small-scale dissipation, stratification, and treatment of radiation transport (e.g. Fromang & Papaloizou 2007, Guan et al. 2009, Davis et al. 2009, Shi et al. 2009; Hartmann et al. 1998). Because the situation is not yet resolved, we will consider cases with and .
The MRI activation temperature is not known precisely (it depends on the location of alkali metals, their ionization rate, the abundance of small grains, and the threshold ionization fraction for MRI turbulence), so we consider cases with =1400 K and 1800 K. These values are chosen, consistent with our opacity prescription, to represent cases with and without dust.
4.1. Dependence on
Figures 2 – 4show the outbursts with different infall rates varying from 10 to 10. For a given set of disk parameters (, TM), the disk accretes quasi-steadily if the infall rate is high enough (small variations could still appear due to the classical thermal instability, as discussed in §5.1). If , the disk accretes steadily if the infall rate is , while outbursts appear with smaller infall rates. With a bigger , the disk accretes nonsteadily/in outburst for all the cases with infall rates -. This is consistent with our predictions from the steady state models (Z2009a).
The outbursts become shorter with smaller infall rates . For example, with =0.1 and TM=1400 K, the outbursts last 800, 500, and 400 years for , , and .This can be explained by the fact that the MRI is triggered at larger radii with larger and thus the outburst (viscous) timescale is longer (§5.1). The simple analytical calculation in the Appendix shows that the outburst timescale is
| (18) |
for TM=1400 K, where is the GI-induced MRI activation radius which will be discussed in §5. This agrees with the numerical simulations reasonably well. The mass accretion rates during the outbursts are similar.
The infall rate also determines the outburst frequency. The time between two outbursts issignificantly shorter with than with, because the mass accreted to the star during all the outbursts should be equal to the mass from infall integrated over the same period of time. Since the outburst timescale is insensitive to the infall rate (), we assume each outburst transports , which is suggested by the observation of FU Ori, and thus the timescale between two outbursts is 0.03 M⊙/. Therefore higher infall rates lead to more frequent outbursts.
4.2. Dependence on and TM
The effect of on the outburst can be seen by comparing the upper and lower panels ofFigures 2-4. For a given and , with a higher the outburst is shorter and stronger. This is because the outburst timescale is close to the viscous timescale, which is inversely proportional to while the mass accretion rate is proportional to . This can be understood using Equation (18) and
| (19) |
as shown in the Appendix for the =1400 K case.
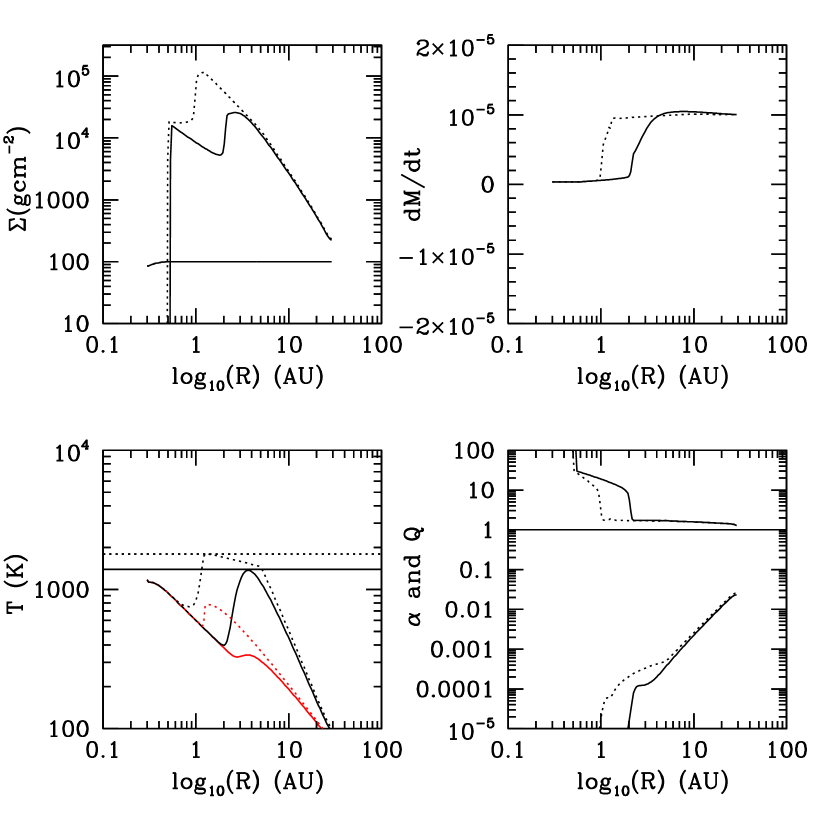
On the other hand, comparing the left and right panels of Figures 2 - 4,we find that the disks with higher have shorter but stronger outbursts. The outburst is shorter because the MRI is triggered at a smaller radius if is higher, resulting in a shorter viscous timescale. Figure 5 shows the disk’s condition just before the MRI is triggered in the case =1400 K (the solid curve) and =1800 K (the dotted curve). The MRI is triggered at 3 AU with =1400 K and 1.5 AU with =1800 K. The outburst is stronger with higher TM because the surface density at the MRI trigger radius with =1800 K (1 AU) is much higher than the surface density at the MRI trigger radius with =1400 K (3 AU) (upper left panel in Fig. 5). Thus, with higher TM, the smaller but more massive inner disk leads to shorter but stronger outbursts.
Our simulations also indicatethat the outbursts with higher accrete less mass than those with lower no matter what the infall rate is (Table 1), because the outbursting inner disk extends to smaller radii, and thus contains less mass, for a higher .
4.3. Dependence on and
Protostars have a variety of masses, most of which are less than 1 M⊙. We also calculated results for central star masses ( 0.3, and 0.1 M⊙) with the same TM (1400 K) and =0.1, and the infall rate .The mass accretion rates with time for these cases are shown in Figure 7. The outbursts have similar mass accretion rates, but the outburst is slightly shorter with a less massive central star, as suggested by equation (18). In addition the mass accreted during an outburst is not significantly affected by its central star mass (Table 1). The outbursts are broadly similar, even though the central star masses differ by a factor of 10.
Another uncertainty in a layered disk model is , which depends on the flux of ionizing radiation and the abundance and size distribution of the dust. In protostars with mass infall rates from 10 to 10, most of the infall mass is transported to the inner disk by the GI in the dead zone, and mass transport through the active layer is negligible. Thus has little effect on the unsteady accretion and the outburst (Fig. 6), but it does affect the mass accretion rate in the low state. The mass accretion rate in a layered disk is determined by the active layer mass accretion rate at . At the disk is MRI active due to thermal ionization. Thus the disk mass accretion rate should be proportional to , which is shown in Figure 6.
5. Discussion
5.1. Unsteady accretion region
The above parameter study can be simply summarized in the plane as shown in Figure 8, which builds upon the steady state vertical structure calculations (Z2009a; an analytical analysis is given in the Appendix). The shaded regions in Figure 8 are the radii at which disk accretion is expected to be unsteady if the mass infall rate is constant.
The solid curve farthest to the lower right in the Figure (labeled ) is the radius where the central temperature of a pure GI-driven disk (Q=1 disk) would reach (e.g. 1400 K). In other words, at a given infall rate , pure GI disks can accrete steadily beyond by the GI, but within the MRI will be activated. Up and to the left of in Figure 8 another solid curve, labeled , denotes the radii at which a pure MRI disk of the given would have a central temperature of TM. If the disk is MRI active, it can accrete steadily purely by the MRI within , but beyond the MRI will be turned off. When and cross a smooth transition between the GI and MRI exists and steady accretion is possible. From the left panel of Figure 8, we see thatthe disk can accrete steadily with =0.01 and . This is observed in the time evolution discussed in §4.1 and Figure 2 (see also Armitage et al. (2001)).
We predict that in the shaded regions matter will pile up through the action of GI, trigger the MRI, and produce an outburst. The dotted curve shows and if TM=1800 K (at which temperature all dust has sublimated). and at 1800 K are smaller than they are at 1400 K because of the temperature plateau around the dust sublimation temperature (Z2009a; also can be seen at R 2-10 AU in Figs. 5). Thus if is higher, outbursts are expected to be shorter because the outburst drains the small inner disk () on a shorter viscous timescale (as demonstrated in Figures 2-4). The effect of can also be seen by comparing the left and right panels of Figure 8.
The classical thermal instability will also be triggered at the infall phase as shown by the upper left shaded band in Figure 8. Even the ‘steady’accretion case discussed above with =0.01 and is subject to thermal instability at . The two lines shown in Figure 8 correspond to the two limiting values of the “S curve” (e.g., Faulkner, Lin, & Papaloizou 1983) at which transitionsto the high (rapid accretion) state and the low (slow accretion) state occur. The instability depends on the disk’s vertical structure (different “S curves”) which behavesdifferently in 2-D than in 1-D, as discussed in §3. We expect nature to behave somewhat more like the 2-D than the1-D case, so for the steady accretion model discussed above convection will add small variations in andwe refer to these steady accretion cases as quasi-steady. Generally, the thermally unstable region is distinctive at , which suggests the TI may be common for protostellar disks.
The solid dots in Figure 8 are the MRI trigger radii from our 1-D simulations when K. Although the trigger radii do not fall precisely on RQ, most of them are in the shaded region, indicating that this plane has predicted non-steady accretion, with potential outbursts, to occur for infall rates for and for . For and , the MRI-GI instability won’t occur based on this plane, which agrees with the 1-D simulations. Generally, our plane results provide a good guide to the parameters for which unsteady accretion occurs.
The outbursts and TI inquasi-steady accretion could provide a much hotter thermal history for the protostellar disks, which may have imprints on meteorites and the chemicals in the protostellar disks.
5.2. Steady vs Non-steady accretion
The non-steady disk accretion in our model is the result of the inability of the inner disk to transport mass inward at the same rate as mass is fed in from the outer disk by infall, . This mass pileup eventually leads to MRI activation and outbursts. Even after infall ends, the dead zone evolves with time if the mass addition from the outer disk due to GI and viscous stresses exceeds what can be carried inward by the active layer.
Terquem (2008) was able to construct steady-state disk accretion solutions with active layers and ”dead” zones. The difference is due to the assumptions of both finite, non-GI viscosity in the dead zone and to assuming a very much lower mass accretion rate, . At such low accretion rates, even very low non-GI dead zone viscosities and comparable active layer properties suffice to transport mass at these rates through the inner disk, which is not possible in our disks driven on the outside at high mass infall rates (except for small centrifugal radii, in which case the disk becomes fully MRI-active).
5.3. Constraints from observations of FU Orionis objects
FU Orionis objects are outbursting systems withmaximum disk accretion rates 10 and a decay time of decades to hundreds of years (Hartmann & Kenyon 1996). These properties constrain our parameter space.
The outbursts produced by 1D2Z models are sensitive to and TM. Figures 2-4 show that =0.1, TM=1800 K leads to outbursts that are too strong (=10), while =0.01, TM=1400 K leads to outbursts that are too long (3000 yr) 222The observed decay time is ( is the flux; thus is an e-folding time). In principle the outburst could have nonexponential time dependence and the duration of the outburst could differ from . In our models, however, the luminosity exceeds the preoutburst luminosity for a time only slightly longer than .. If TM=1400 K, the outburst start at 3 AU (Figure 5), so needs to be large to produce the correct decay timescale. If K the outburst is triggered at AU, so is required to maintain the correct outburst timescale.
One uncertainty here is that in a non-thermally ionized active layer may not be the same as in a thermally ionized, dust free, fully conducting medium. Thus we mostly constrain in the latter (outburst stage) from the decay timescale; in the active layer is not well-constrained by outbursts.
Another uncertainty is related to our assumption of constant . If is instead a function of radius the disk’s long term evolution will change. At early stages, however, if the GI in the outer disk dominates the disk’s accretion, variation of will have little effect on the outburst mechanism discussed here.
The central star mass and infall rate do not significantly change the outbursts. This agrees with the observation that FU Orionis outbursts occur for protostars with different infall rates (Quanz et al. 2007 and Zhu et al 2008 found that FU Orionis objects could be either Class 0 or Class I objects.).
Zhu et al. (2007) argued that the decay timescale for FU Ori implies 0.02-0.2. This conclusion can be tested with our 1-D simulations. The last column in Table 1 shows the viscous timescale calculated using and :
| (20) |
where
| (21) |
and are calculated with and .
Comparing with the outbursts’ duration in column 6, we see the viscous time is close to the outburst time for TM=1400 K. If TM=1800 K, the viscous time is 2-3 times longer than the outburst time, which may be due to the disk’s temperature during the outburst being higher than TM if the MRI is triggered at smaller radius as TM=1800 K case. However, since constraining by using the viscous timescale is anorder of magnitude estimate, our simulations are consistent with the Zhu et al (2007) estimate.
6. Conclusions
In this paper, we have evolved a one-dimensional layered disk model including both MRI and GI to study the unsteady disk accretion of protostars. The 1-D models reproduce the general properties of 2-D (axisymmetric) outbursts reasonably well, such as the outbursting mass accretion rate, durationand the accreted mass during one outburst. Because the 1-D model is faster, itenables us to study outbursts in an extended parameter space.
Our results confirm that the disk can accrete steadily with high infall rates (10-4 if =0.01; Armitage et al. (2001)). This steady accretion may still have short timescale variations, however, due to the thermal instability in the inner disk, as suggested by our earlier, 2-D simulations.
We also confirm the prediction by Z2009a that protostars are likely to accrete unsteadily/in outbursts for infall rates with and for . Outbursts are triggered at AU for protostellar infall rates . The outbursts are stronger and shorter with larger or TM. The total mass accreted during one outburst mainly depends on TM. While the outbursts are slightly shorter for more massive central stars, the outburst is nearly independent of central star mass. The active layer surface density only affects the mass accretion rate inthe low state; it has little effect on the outburst.
By comparing with the mass accretion rate and duration ofobserved FU Orionis events, we can constrain a combination of and TM. If is low (0.01), TM needs to be high (1800 K, higher than the dust sublimation temperature); if is high (0.1) then needs to be low (1400 K).
Our results show that 1-D, two zone models can capture the basic features of disk evolution, given our assumptions about the action of the MRI and GI. In a later paper we will address disk evolution over a much longer timescale, explicitly taking into account mass infall from a rotating protostellar cloud.
| (1) |
Using the form for and using=, where H is the disk scale height,
| (2) | |||||
or equivalently
| (3) |
where is the angular velocity at R, is the Boltzmann constant and mH is the unit molecular mass.
Then with Q=cs/G, and inserting equation (3) into Q to derive the relationship between R and at a given Q and
| (4) | |||||
The dust opacity fitting from Z2009a suggests, at T K, =0.738, =0 and C=0.053. If we plot the relationship between R and by given Tc=TM=1400 K and Q=1.5, we find
| (5) |
which corresponds well with the RQ calculated in Figure 8.
Since RQ for =1400 K case, the outburst timescale is roughly
| (6) |
where is calculated for Tc=TM=1400 K. During outburst, however, Tc could be higher than the MRI trigger temperature TM, especially in the inner part of the disk.
If we further assume the outburst (this is the steady accretion disk solution which may not be true in the time-dependent case), we find
| (7) |
Here we explicitly distinguish between the sound speed cso during the outburst and the sound speed cst before MRI activation. For an order of magnitude estimate we assume and so
| (8) |
which agrees with the numerical simulations for TM=1400 K reasonably well considering we are using a steady state assumption.
We have only applied the above equations for theTM=1400 K case, since the detailed vertical structure is important if TM=1800 K where the midplane is dust-free while the surface has dust. Also the outburst is triggered at a smaller radius for TM=1800 K, and thus the disk temperature during the outburst can be much higher than the MRI trigger temperature.
References
- Armitage et al. (2001) Armitage, P. J., Livio, M., & Pringle, J. E. 2001, MNRAS, 324, 705
- Bai & Goodman (2009) Bai, X.-N., & Goodman, J. 2009, ApJ, 701, 737
- Bate et al. (2003) Bate, M. R., Bonnell, I. A., & Bromm, V. 2003, MNRAS, 339, 577
- Bell & Lin (1994) Bell, K. R., & Lin, D. N. C. 1994, ApJ, 427, 987
- Boley et al. (2006) Boley, A. C., Mejía, A. C., Durisen, R. H., Cai, K., Pickett, M. K., & D’Alessio, P. 2006, ApJ, 651, 517
- Bonnell & Bastien (1992) Bonnell, I., & Bastien, P. 1992, ApJ, 401, 654
- Book & Hartmann (2005) Book, L. G., & Hartmann, L. 2005, Bulletin of the American Astronomical Society, 37, 1287
- Cossins et al. (2009) Cossins, P., Lodato, G., & Clarke, C. J. 2009, MNRAS, 393, 1157
- Enoch et al. (2008) Enoch, M. L., Evans, N. J., II, Sargent, A. I., Glenn, J., Rosolowsky, E., & Myers, P. 2008, ApJ, 684, 1240
- Enoch et al. (2009) Enoch, M. L., Evans, N. J., Sargent, A. I., & Glenn, J. 2009, ApJ, 692, 973
- Faulkner et al. (1983) Faulkner, J., Lin, D. N. C., & Papaloizou, J. 1983, MNRAS, 205, 359
- Fromang & Stone (2009) Fromang, S., & Stone, J. M. 2009, arXiv:0906.4422
- Gammie (1996) Gammie, C. F. 1996, ApJ, 457, 355
- Gammie (2001) Gammie, C. F. 2001, ApJ, 553, 174
- Glassgold et al. (2004) Glassgold, A. E., Najita, J., & Igea, J. 2004, ApJ, 615, 972
- Guan et al. (2009) Guan, X., Gammie, C. F., Simon, J. B., & Johnson, B. M. 2009, ApJ, 694, 1010
- Guan & Gammie (2009) Guan, X., & Gammie, C. F. 2009, ApJ, 697, 1901
- Hartmann et al. (1997) Hartmann, L., Cassen, P., & Kenyon, S. J. 1997, ApJ, 475, 770
- Hartmann et al. (2009) Hartmann, L., Heitsch, F., & Ballesteros-Paredes, J. 2009, Revista Mexicana de Astronomia y Astrofisica Conference Series, 35, 66
- Hartmann & Kenyon (1996) Hartmann, L., & Kenyon, S. J. 1996, ARA&A, 34, 207
- Hirose et al. (2009) Hirose, S., Krolik, J. H., & Blaes, O. 2009, ApJ, 691, 16
- Hubeny (1990) Hubeny, I. 1990, ApJ, 351, 632
- Kenyon et al. (1990) Kenyon, S. J., Hartmann, L. W., Strom, K. M., & Strom, S. E. 1990, AJ, 99, 869
- Kenyon et al. (1994) Kenyon, S. J., Gomez, M., Marzke, R. O., & Hartmann, L. 1994, AJ, 108, 251
- King et al. (2007) King, A. R., Pringle, J. E., & Livio, M. 2007, MNRAS, 376, 1740
- Lesur & Longaretti (2009) Lesur, G., & Longaretti, P.-Y. 2009, A&A, 504, 309
- Lin & Pringle (1987) Lin, D. N. C., & Pringle, J. E. 1987, MNRAS, 225, 607
- Lin & Pringle (1990) Lin, D. N. C., & Pringle, J. E. 1990, ApJ, 358, 515
- Lodato & Rice (2004) Lodato, G., & Rice, W. K. M. 2004, MNRAS, 351, 630
- Quanz et al. (2007) Quanz, S. P., Henning, T., Bouwman, J., van Boekel, R., Juhász, A., Linz, H., Pontoppidan, K. M., & Lahuis, F. 2007, ApJ, 668, 359
- Shu et al. (1987) Shu, F. H., Adams, F. C., & Lizano, S. 1987, ARA&A, 25, 23
- Stahler (1988) Stahler, S. W. 1988, ApJ, 332, 804
- Sano et al. (2000) Sano, T., Miyama, S. M., Umebayashi, T., & Nakano, T. 2000, ApJ, 543, 486
- Stone et al. (1996) Stone, J. M., Hawley, J. F., Gammie, C. F., & Balbus, S. A. 1996, ApJ, 463, 656
- Turner & Sano (2008) Turner, N. J., & Sano, T. 2008, ApJ, 679, L131
- Vorobyov & Basu (2005) Vorobyov, E. I., & Basu, S. 2005, ApJ, 633, L137
- Vorobyov & Basu (2006) Vorobyov, E. I., & Basu, S. 2006, ApJ, 650, 956
- Wünsch et al. (2006) Wünsch, R., Gawryszczak, A., Klahr, H., & Różyczka, M. 2006, MNRAS, 367, 773
- Zhu et al. (2007) Zhu, Z., Hartmann, L., Calvet, N., Hernandez, J., Muzerolle, J., & Tannirkulam, A.-K. 2007, ApJ, 669, 483
- Zhu et al. (2008) Zhu, Z., Hartmann, L., Calvet, N., Hernandez, J., Tannirkulam, A.-K., & D’Alessio, P. 2008, ApJ, 684, 1281
- Zhu et al. (2009) Zhu, Z., Hartmann, L., & Gammie, C. 2009, ApJ, 694, 1045 (Z2009a)
- Zhu et al. (2009) Zhu, Z., Hartmann, L., Gammie, C., & McKinney, J. C. 2009, ApJ, 701, 620 (Z2009b)


| M∗ | infall rate | TM | outburst aathe mass accretion rate at the half-time of the outburst | duration | accreted massbbthe mass accreted during one outburst | RMccthe MRI trigger radius | viscous timeddThe viscous timescale is calculated by using RM and TM. | |
|---|---|---|---|---|---|---|---|---|
| M⊙ | K | yr | M⊙ | AU | yr | |||
| 1 | 10-4 | 0.1 | 1400 | 210-4 | 700 | 0.7 | 6 | 428 |
| 1 | 10-4 | 0.1 | 1800 | 10-3 | 50 | 0.02 | 1.8 | 182 |
| 1 | 10-5 | 0.1 | 1400 | 210-4 | 400 | 0.057 | 3.5 | 327 |
| 1 | 10-5 | 0.1 | 1800 | 10-3 | 40 | 0.024 | 1.2 | 150 |
| 1 | 10-5 | 0.01 | 1400 | 510-5 | 4000 | 0.045 | 3.2 | 3127 |
| 1 | 10-5 | 0.01 | 1800 | 810-5 | 400 | 0.01 | 1.2 | 1490 |
| 1 | 10-6 | 0.1 | 1400 | 210-4 | 350 | 0.08 | 1.9 | 240 |
| 1 | 10-6 | 0.1 | 1800 | 10-3 | 50 | 0.02 | 0.85 | 125 |
| 1 | 10-6 | 0.01 | 1400 | 510-5 | 3000 | 0.04 | 2.1 | 2533 |
| 1 | 10-6 | 0.01 | 1800 | 810-5 | 800 | 0.015 | 0.87 | 1268 |
| 0.3 | 10-5 | 0.1 | 1400 | 210-4 | 300 | 0.04 | 2.3 | 145 |
| 0.1 | 10-5 | 0.1 | 1400 | 210-4 | 250 | 0.025 | 1.43 | 66 |