Long-term Evolution of Protostellar and Protoplanetary Disks. II. Layered Accretion with Infall
Abstract
We use one-dimensional two-zone time-dependent accretion disk models to study the long-term evolution of protostellar disks subject to mass addition from the collapse of a rotating cloud core. Our model consists of a constant surface density magnetically coupled active layer, with transport and dissipation in inactive regions only via gravitational instability. We start our simulations after a central protostar has formed, containing 10% of the mass of the protostellar cloud. Subsequent evolution depends on the angular momentum of the accreting envelope. We find that disk accretion matches the infall rate early in the disk evolution because much of the inner disk is hot enough to couple to the magnetic field. Later infall reaches the disk beyond 10 AU, and the disk undergoes outbursts of accretion in FU Ori-like events as described in Zhu et al. 2009c. If the initial cloud core is moderately rotating most of the central star’s mass is built up by these outburst events. Our results suggest that the protostellar “luminosity problem” is eased by accretion during these FU Ori-like outbursts. After infall stops the disk enters the T Tauri phase. An outer, viscously evolving disk has structure that is in reasonable agreement with recent submillimeter studies and its surface density evolves from to . An inner, massive belt of material– the “dead zone” – would not have been observed yet but should be seen in future high angular resolution observations by EVLA and ALMA. This high surface density belt is a generic consequence of low angular momentum transport efficiency at radii where the disk is magnetically decoupled, and would strongly affect planet formation and migration.
Subject headings:
accretion disks, stars: formation, stars: pre-main sequence1. Introduction
In the picture of low-mass star formation from large, cold protostellar clouds, any small initial rotation of the cloud will lead to the formation of an accretion disk to conserve angular momentum; thus much, if not most, of the mass of low-mass stars is probably accreted from disks. However, if disks transport the infalling mass steadily to the central star, accretion luminosities are considerably higher than typically observed protostellar luminosities (Kenyon et al. 1990, 1994; Enoch et al. 2008; Evans et al. 2009). This “luminosity problem” can be alleviated if disks spend most of their evolution accreting slowly, undergoing episodic accretion outbursts where most of the mass is added to the central stars. One implication of non-steady accretion is that mass may pile up in specific regions of disks, which could have significant consequences for understanding planet formation.
Over the past decade, disk angular momentum transport by the magnetorotational instability (MRI) (Balbus & Hawley 1998) and by the gravitational instability (GI) (Durisen et al. 2007) has become much better understood. It seems likely that both types of instability need to be considered to understand protostellar accretion. At early evolutionary stages the disk is likely to be quite massive with respect to the central protostar, suggesting that GI may be important; in addition, these disks are so cold that thermal ionization cannot sustain the MRI, which requires coupling of the magnetic field to the mostly-neutral gas through collisions (e.g., Reyes-Ruiz Stepinski 1995). On the other hand, external ionizing sources (cosmic and/or X rays) can provide the necessary ionization for MRI activitation up to a limiting surface density, ionizing the outer surfaces of the disk and leading to accretion in an “active layer”, leaving a “dead zone” in the midplane (Gammie 1996). In addition, at high accretion rates, the inner disk can become thermally-ionized, as in FU Ori outbursts (Zhu et al. 2007, 2009b).
Mismatches in the transport rate between the GI and MRI can lead to outbursts of accretion (Armitage et al. 2001, Zhu et al. 2009 bc). In Zhu et al. 2010 (Paper I), we constructed one-dimensional, time-dependent disk models to study the protostellar unsteady accretion. These models assume both thermally-activated and layered MRI-driven accretion along with a local treatment of the GI. We further adopted steady mass addition at a specified outer disk radius to drive the system. We found that accretion in protostellar disks is unsteady over a wide range of parameters because of a mismatch between GI transport in the outer disk and MRI transport in the inner disk. Our results for outburst behavior in these one-dimensional model were sufficiently comparable to our previous two-dimensional simulations of outbursts (Zhu et al. 2009c), confirming the utility of the faster 1D simulations to explore wider ranges of parameter space.
In this paper we extend our results from Paper I to study long-term disk evolution from the protostellar phase to the T Tauri phase, using a more self-consistent treatment for infall from a collapsing, rotating cloud core. This allows us to study the effect of the initial core rotation and different disk accretion configurations (layered accretion, GI-only accretion, and constant- accretion) on the disk formation and evolution. Rice, Mayo, & Armitage (2009) have also investigated somewhat similar one-dimensional models but do not assume layered accretion.
Our models treat the same phase of evolution as Vorobyov & Basu (2005, 2006, 2007) investigated with two-dimensional models. They also argue that protostellar accretion is generally non-steady, but for a different reason, specifically the accretion of clumps created by gravitational instabilities. Kratter et al. (2009) have also investigated the protostellar accretion phase with three-dimensional numerical simulations. Although our treatment of the core collapse and the GI is much more schematic than used in the above investigations, we are able to treat radiative cooling more realistically, and can follow disk evolution to much smaller radii, where the (thermally-activated) MRI can become important. Furthermore, our two-zone disk model allows us to study the effects of different disk accretion configurations efficiently. The variety of disk structures predicted by our simulations with different initial cloud core rotations and disk accretion mechanisms can be tested by future EVLA and ALMA observations, which will help us to better understand disk accretion and planet formation.
We describe our one-dimensional, two-zone model with self-consistent infall in §2. In §3 we explore the behavior of the disk models with infall. In §4 we discuss the implications of our results, and summarize our conclusions in §5. We defer all derivations to the Appendix.
2. 1D2Z models with infall
The one-dimensional two zone (1D2Z) disk model has been introduced in Paper I. It consists of two vertically averaged layers (the surface layer and the “dead zone”) evolving independently. The surface density evolves according to the mass and angular momentum conservation equations in cylindrical coordinates,
| (1) |
| (2) |
where is the total surface density, is the angular frequency, is the radial mass flux in the disk, , is the viscosity, and denotes ‘a’ (active layer) or ‘d’ (dead zone). 2 and The terms 2 are the mass and angular momentum flux brought by the infalling matter into the disk (Cassen & Moosman 1981). Assuming instantaneous centrifugal balance, 111The validity of this assumption with infall has been shown in Appendix B in Cassen & Moosman (1981). Instantaneous centrifugal balance is a good approximation in our simulations because the change of the central star mass on an orbital time is very small. equations 1 and 2 can be simplified to
| (3) | |||||
where is the sum of the mass of the central star (Mc) and the disk mass within R, using the approximation of the gravitational potential adopted by Lin Pringle (1990). The first term in equation 3 represents disk accretion due to viscosity; the second term is due to the central star mass changing with time; and the third term is due to the infalling matter (Cassen & Moosman 1981). Since the infalling matter only falls onto the surface of the disk, we assume and are 0, thus and can be written as and for short. The effect of the infalling matter onto the disk is limited to just two free functions: g(R,t) and .
The surface densities and exchange mass as described in Paper I to maintain , where is the maximum MRI active layer surface density and is assumed to be a constant throughout the disk (Gammie 1996). We solve equation 3 and 1 sequentially: is calculated with the current disk temperature and , and then it is inserted into equation 1 to update at the next timestep.
The disk temperature is determined by the balance between the heating and radiative cooling. Here the external temperature , which represents the heating effect of the irradiation from the central star is assumed to be
| (4) |
where is the total luminosity of the star and changes with the central star mass by
| (5) |
which is a fit to the T-Tauri star birthline from Kenyon & Hartmann(1995). The change of luminosity has little effect on the disk evolution in our simulations. is the Stefan-Boltzmann constant, and is the coefficient, which accounts for the non-normal irradiation from the central star at the disk’s surface. We assume =0.1 in this paper. The viscous heating rate of the disk is
| (6) |
where the stress assuming Keplerian rotation. Both gravitational and magneto-rotational instabilities are considered. The anomalous viscosity is
| (7) |
where are the sound speed of the active layer and the dead zone, and
| (8) |
The Toomre parameter is calculated using the disk central temperature (Td) and the total surface density (+). The form of is motivated by a desire to make gravitational torques become important only when , as indicated by global three-dimensional simulations (e.g., Boley et al 2006). The parameter is set to be 0.01 when the disk temperature is above the preset critical MRI temperature for thermal activitation (TM=1500 K is assumed in this paper) or at the surface active layer. Since the rise time of MRI is about the orbital timescale (Stone et al. 1996), we assume that the MRI viscosity grows on the orbital timescale up to whenever the temperature is above the critical temperature (TM). The effects of different values of , TM, and on outbursts are discussed in Paper I. The treatment of radiative cooling is the same as in Paper I.
Recent observations suggest that the density structure of protostellar molecular cores, when circularly-averaged, can be approximated by static Bonnor-Ebert spheres (Alves et al. 2001; di Francesco et al. 2007; Ward-Thompson et al. 2007). Though real clouds have more complex structure (e.g., Benson & Myers 1989), resulting in more complicated patterns of infall (Kratter et al. 2009), we adopt this simplified structure to limit the number of model parameters. This leads us to use an approximate model of infall corresponding to that expected from a critical Bonnor-Ebert sphere, which exhibits similarities to that of the collapse of the singular isothermal sphere (Terebey, Shu, & Cassen 1984).
Analytical and numerical studies ( Foster & Chevalier 1992; Henriksen et al. 1997; Gong & Ostriker 2009) have shown that the collapse of the critical Bonnor-Ebert sphere can be divided into two stages. In the first stage, the roughly constant-density inner region collapses to the central regions nearly simultaneously; then in the second stage, infall from the remaining cloud core ( region 222In this paper, R denotes the cylindrical radius in the disk while r denotes the radius in the cloud core.) is at a rate similar to c/G (csc is the sound speed at the cloud core temperature) of the singular isotheral sphere (SIS) collapse model (Shu 1977). We assume that our simulation starts at the end of the first stage of very rapid collapse of low-angular momentum material, so the central star initially has the mass of the inner flat region of the Bonnor-Ebert sphere, and the collapse of the remaining cloud follows the singular isothermal sphere solution (Shu 1977).
We use a two-component density profile to represent the Bonnor-Ebert sphere as in Henriksen et al. (1997). The two density components are
| (9) |
| (10) |
where is the central density, r is in the normalized unit , is the sound speed of the cloud and is the density profile of the SIS model. =6.5 corresponds to the critical Bonnor-Ebert sphere radius and the radius of the flat density region corresponds to =. The total mass of each component is
| (11) |
| (12) |
The total mass with this simplified density profile is , which is close to the mass of a real critical Bonnor-Ebert sphere . Since the flat inner region has 10% mass of the region, we assume the flat region has 0.1 and the rest of the Bonnor-Ebert sphere has 1 .
The rest of the 1 cloud core beyond collapses in a manner similar to that of the singular isothermal sphere, in which case the inner regions collapse first due to their shortest free-fall times and this free-fall zone extends outwards linearly with time (m0csct, where =0.975.) (Shu 1977; Terebey, Shu, & Cassen 1984). Thus, the mass infall rate is =m0c/G, which is constant during the collapse. At time t, all the material collapsing to the center was originally at the cloud radius r0=(m0/2)csct+ric, where the addition of ric (the radius of the flat density region in the Bonnor-Ebert sphere) is due to the fact that we define t=0 as the time when the flat region in the Bonnor-Ebert sphere has already collapsed to the central star. If the protostellar cloud core is initially in uniform rotation with angular velocity , the material falling in from different directions will have different angular momenta and arrive at the midplane at differing radii within the so called “centrifugal radius” (Cassen & Moosman 1981)
| (13) |
where Mc is the central star mass. Assuming Mc increases with t , , similar to that found by Terebey, Shu, & Cassen (1984) for the singular isothermal sphere collapse.
We use the Cassen & Moosman (1981) solution for the infall to the disk at a given time from a spherical cloud initially in uniform rotation. We start the infall from the transition radius at . Then the mass flux and the angular momentum brought by the infalling matter for a uniformly-rotating singular isothermal sphere is,
| (14) |
| (15) |
and
| (16) |
| (17) |
where = (m0c/G) is the infall rate and Rc is the centrifugal radius defined in equation 13. Inserting equations 14-17 into equations 1-3, we can simulate the disk evolution under the infall.
3. Layered accretion with infall
In all cases we start with Mc= 0.1 M⊙ and a cloud mass of 1 M⊙. We adopt a temperature of 20K for the envelope. This parameter enters in setting the infall rate =; thus the infall lasts 2.4 yr, roughly consistent with observations (Kenyon et al 1990, 1994; Evans 2009). This leaves only one parameter to vary, the initial angular velocity of the cloud , which affects the maximum centrifugal radius onto the resulting disk. For a singular isothermal sphere (SIS) core,
| (18) |
where we have assumed that the central star mass at the end of infall is approximately the cloud core mass (Mco); thus
| (19) |
Since Rcmax directly constrains the disk size after the infall, it is the most important parameter determining the initial disk properties.
3.1. Fiducial model
We take as our fiducial model one with =100 g cm-2, =0.01, and = so that R AU.
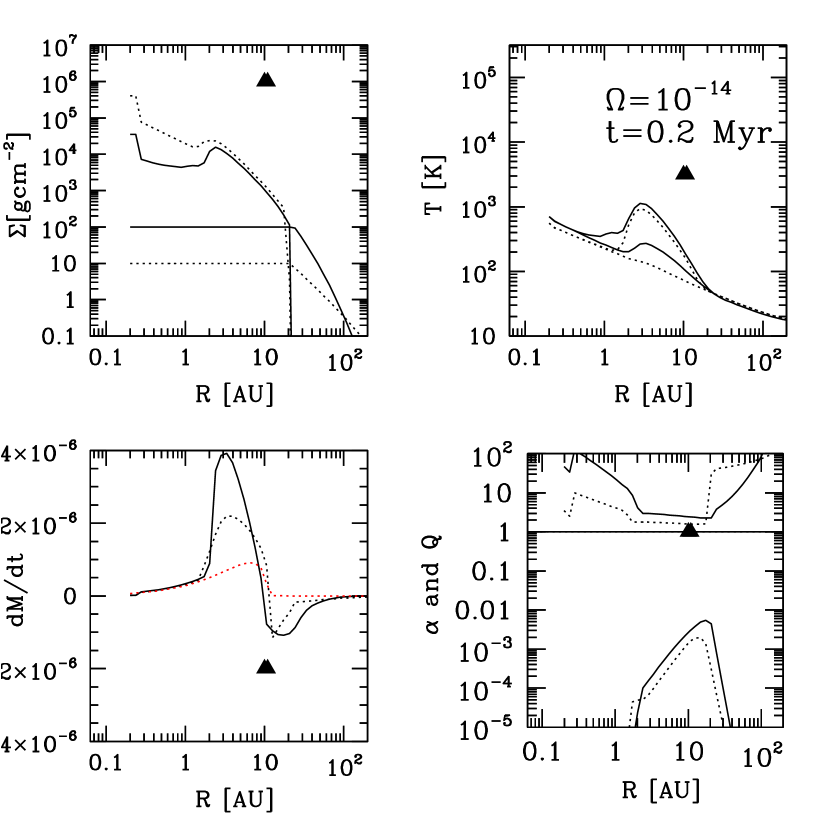
Figure 1 shows the fiducial model’s mass accretion rate and the central star and disk masses as a function of time. The overall evolution can be divided into three distinct stages. Initially there is a phase of quasi-steady disk accretion, with the accretion rate matching the infall rate (). This occurs because the infall is to small radii where the disk can become hot enough to sustain the MRI thermally. As infall proceeds, thermal activation of the MRI cannot be sustained, and gravitational instability takes over as the main mechanism of mass transfer. However, the GI is inefficient at these radii and so matter piles up. Eventually, the disk becomes opaque enough that the radiative trapping of the energy dissipated by the GI raises the central disk temperature sufficiently to thermally-activate the MRI, and an outburst of accretion occurs. As shown in Paper I, the result is cycles of outbursts transferring material inward; the GI moves material in slowly until enough mass is accumulated with enough viscous dissipation to trigger the thermal MRI outbursts. Finally, after infall stops, the disk is not massive enough to sustain GI, and it accretes only from the MRI active layer. Since the outer disk has a surface density smaller than the maximum surface density that can be ionized by cosmic and/or X rays, it becomes fully viscous due to the MRI; this leads to continued expansion of the outer disk, with a slow draining of material into the inner disk and central star. During the T Tauri phase, the layered accretion itself may also trigger outbursts, depending on the detailed layered structure (see below).
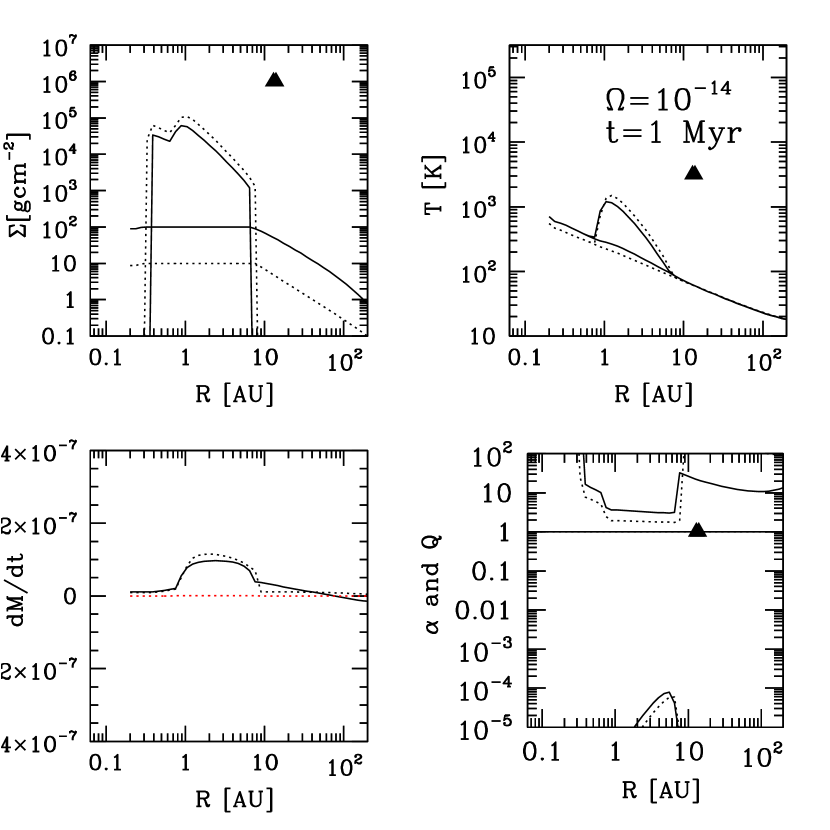
The disk structure during the outburst stage is illustrated in Figure 2, shown at the time when the centrifugal radius (Rc) is 10 AU (labeled by the triangle). Although the infall ends at , the disk extends far beyond due to the outward mass transfer by the active layer. With the continuous infall, the disk is marginally gravitationally stable within Rc, and the energy dissipation due to the GI has significantly heated the disk so that the outburst will be triggered at 2 AU (the upper right panel shows that Tc is approaching 1500 K). At the time when infall ends, the region between 1 AU and 20 AU is still marginally gravitationally unstable, although the disk within 1 AU has been depleted by the previous outburst (Figure 3).
The innermost disk (R0.1 AU) is purely MRI active due to the high temperature there produced by viscous heating and irradiation. Due to the efficient mass transport by the MRI, this inner region can be depleted rapidly, but is limited by the accretion from the outer active layer. Eventually, a balance is achieved, and the inner disk behaves like a constant- disk with mass accretion rate equal to the mass accretion rate of the innermost active layer (e.g., Gammie 1996).
In the standard layered accretion model, the disk mass accretion rate is set as the active layer accretion rate at the dead zone inner radius where the MRI becomes thermally activated (e.g., Gammie 1996). We use the modification of the accretion rate including irradiation derived by Hartmann et al. (2006; see also the Appendix)
| (20) | |||||
where is defined in equation 4. At the sublimation radius, f may be significantly larger than 0.1. With our numerical inner boundary 0.2 AU, the simulation shows the disk has a mass accretion rate 10 in the quiescent state, which agrees with the above estimate.
As discussed in Paper I, we find unstable behavior at the dead zone inner radius because of the rapid change in . This accounts for the modest but significant variability seen during the quasi-steady state333Although we avoided this instability at the T Tauri phase by choosing the inner numerical boundary at 0.2 AU, this instability is present in our simulation in the first 105 years (short variations in Figure 1) when the dead zone inner radius is larger than 0.2 AU. . This instability cannot be reliably treated in our model, due to the complexity of the processes involved including MRI activation and dust sublimation; thus the precise nature of the variations in accretion during this phase is uncertain.
A massive, marginally gravitationally unstable dead zone remains well after the end of infall (upper left and lower right panels in Figure 3). This dead zone is maintained because the active layer mass accretion rate increases with radius (Gammie 1996). From the mass conservation equation one can derive the time dependence of the total surface density =+,
| (21) | |||||
Thus and . The disk surface density thus increases linearly with time, more rapidly at smaller radii. When the surface density increases to the extent that the disk becomes gravitationally unstable, self-gravity transfers the excess mass and self-regulates the disk to an approximate Q1 state. From equation 21 one can see that it only takes 105 yr for the disk at 10 AU to become gravitationally unstable by layered accretion. Thus, active-layer accretion can maintain a dead zone that is marginally gravitationally unstable well after infall stops.
A sharp density drop appears at the outer radius of the dead zone RD (also shown in Reyes-Ruiz(2007) and Matsumura et al.(2009)) and RD starts at the maximum centrifugal radius after the infall and gradually moves inward with time, so that the dead zone becomes increasingly narrow as the system evolves (see the Appendix). In the outer disk beyond RD where only the active layer is present, the disk surface density evolves from a distribution to an asymptotic distribution at large times. This result can be understood by modeling it as a pure disk but with a fixed inner boundary, as discussed in the Appendix.
3.2. Varying core rotation
The initial disk size is constrained by the maximum infall radius Rcmax. We next consider the results for rad s-1 and rad s-1.
Figure 4 shows the accretion behavior of these models during the first 2 Myr. In the slowly-rotating case, all of the mass is accreted in a quasi-steady fashion, and the remaining disk mass is very small, whereas the collapse of the rapidly-rotating core results in very little quasi-steady accretion, an extended period of outbursts lasting well beyond the end of infall, and a very massive disk.
The differing behavior of the three models can be understood with reference to Figure 5, which is a modification of the vs. plane discussed by Zhu et al. (2009b). For the slowest-rotating core model, R AU (equation 19). Reference to Figure 5 shows that this radius is just within the maximum radius for steady MRI-driven accretion at . In this region, the disk can maintain a temperature greater than the critical value for MRI activation; the disk then accretes on to the star as a typical -disk, with modest oscillations due to the instability at the inner disk edge described in the previous section (see also Paper I). In the case of our fiducial model, R AU; this places the disk well beyond the region where the mismatch between GI and MRI occurs, resulting in outbursts. The fiducial model accretes quasi-steadily for the first yr; at this point AU. For the rapidly-rotating case, R AU; very little mass infalls to radii within the MRI-steady region, and most of the mass then gets accreted during outbursts. Because the mass transport is dominated by the GI at large radii, a relatively massive disk results. Note that the outer regions of the disk reside near the limit where gravitational fragmentation rather than simple transport might occur (Appendix; §4.4).
Thus the range of rotations chosen here (given our assumed model for the initial cloud core) approximately span the extremes of disk evolution; at smaller , the accretion is almost spherical and occurs quasi-steadily, while for larger values of gravitational fragmentation is likely to occur, considerably modifying disk evolution.
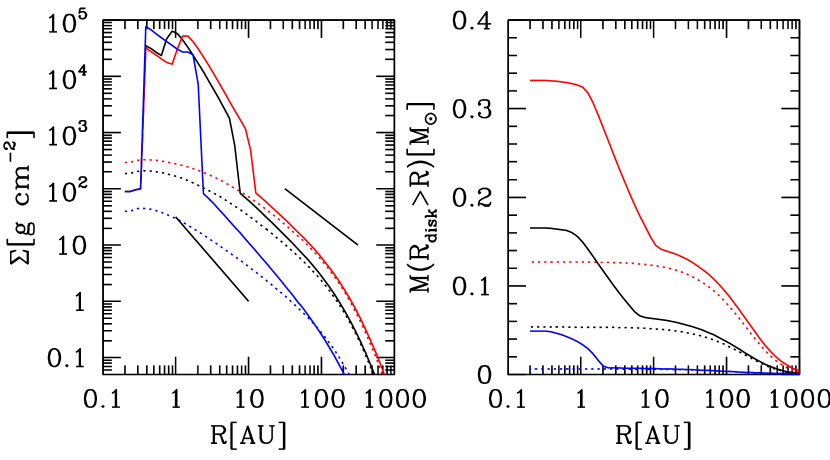
The disk mass and surface density distribution are also significantly affected by the initial core rotation. With rad s-1 (left panel in Figure 6), although the dead zone shrinks from 35 AU at the end of the infall phase (0.3 Myr) to 10 AU at the T Tauri phase (1 Myr), the disk is very massive (0.3 M⊙) and still gravitationally unstable within 10 AU during the T Tauri phase. However, for smaller rotation rad s-1 (right panel), the dead zone is significantly smaller (2 AU) and has less mass (0.05 M⊙).
When the initial core rotates slowly and Rcmax is small, the dead zone size is determined by Rcmax. However, if the inital core rotates fast and Rcmax is large, the dead zone size is constrained by the radius where the active layer becomes gravitationally unstable, as discussed further in the Appendix.
One important point is that even though the dead zone is small AU, it can contain a significant fraction (or most) of the disk mass. Figure 7 shows that, no matter what the infall it is, most of the disk mass can be at small radii, rather than the large radii probed by current mm and sub-mm observations (in comparison with constant- models).
3.3. Different disk configurations
The ionization structure of disk surface layers depends on the dust size spectrum and the flux of ionizing radiation and cosmic rays, and is therefore poorly constrained. Angular momentum transport in magnetically decoupled disks is also poorly understood, although recent work by Lesur & Papaloizou(2009), following Petersen et al.(2007), strongly suggests that a nonlinear instability driven by baroclinicity and radiative diffusion may give rise to hydrodynamic turbulence and angular momentum transport. Therefore we have investigated disks with a reduced active layer (§3.3.1), and a residual dead zone viscosity (§3.3.2).
3.3.1 Disks with less active layer and pure GI disks
Little is known about the disk active layer, which is dependent not only upon cosmic and/or X ray fluxes, but on the presence of dust which can absorb charges and reduce the MRI or even prevent it (Sano et al. 2000). Ambipolar diffusion at the low density active layer beyond 10 AU may further depress the effectiveness of the MRI (Chiang & Murray-Clay 2007). In addition, there may be no dynamo in the outer disk. Thus we consider disks with lower active-layer surface densities (g cm-2).
The long-term disk evolution is determined by the product of (equations 20 and 21); thus, as long as the product stays the same, disk evolution is similar. Figures 2 and 3 show disks with g cm-2 and and disks with g cm-2 and have similar surface density, temperature, and mass accretion rate distributions at all times, only except that a lower leads to a less massive outer disk.
If is lower, the disk accretion rate is lower than our fiducial model; thus the infall mass takes longer to accrete onto the star. In addition, with a smaller , the dead zone outer radius (RD) is larger (equation A13).
In the extreme case when there is no active layer 444We allow thermal activation of the MRI when the disk temperature is higher than TM., the disk evolves towards Q1 during the simulation (Figure 8), since the GI is the only mechanism to transport mass from the outer disk inwards. The disk is very massive and has a sharp outer disk edge roughly at Rcmax (Vorobyov & Basu 2005, 2006, 2007). Without the active layer replenishing the innermost disk and the inner disk becoming gravitationally stable (due to the strong irradiation from the central star), the disk accretion rate drops to zero (upper left panel in Figure 8). During the T Tauri phase, the disk evolves to Q2 and stays at this gravitationally stable state (Figure 8). Thus the disk is massive (0.2 M⊙) during the T Tauri phase. Even if the disk has some small residual viscosity at Q1, it has limited effect on disk evolution simply because, with , the viscous timescale is too long (more than 2 Myr to transport mass from 50 AU to the central star) (see also Vorobyov & Basu 2009).
3.3.2 Residual dead zone viscosity
In our fiducial model, we assume the dead zone has no viscosity at all. However, numerical MHD simulations have shown that the dead zone may not be totally “dead”, with a small residual viscosity. The viscosity could be due to the operation of the MRI with the ions turbulent mixing from the active layer (Ilgner & Nelson 2008) or from turbulence penetrating the dead zone from the active layer (Turner et al. 2007). Recent work by Lesur & Papaloizou (2009) also persuasively demonstrates the existence of a nonlinear instability driven by baroclinicity and radiative transport (the magnitude is not yet clear, and the existing evidence suggests that the instability weakens when radiative diffusion is small—when the Peclet number is large—as might be expected in a dead zone with large optical depth.
If the residual viscosity in the dead zone is 10-5), it has a negligible effect on disk evolution. Disk structure evolves simply on the viscous timescale; for , this is long compared to T Tauri lifetimes few 106 yr.
However, if the residual 10-4, the dead zone can transport the mass at a rate comparable to the accretion rate of the active layer, with and . We assume the disk has a constant mass accretion rate after a long period of time, and at the stellar surface =0. Furthermore, if the disk is irradiation-dominated such that TR-1/2, =kaR and =kdR where ka and kd are constants and are proportional to and , we derive (in the Appendix)
| (22) |
If the dead zone transports mass at a rate higher than the active layer, the last term can be neglected for an order of magnitude argument. Compared with a constant- disk having the same mass accretion rate, the layered disk has a surface density higher than the constant- disk by a factor of /. If we assume the outer pure MRI active disk and the inner layered disk has the same mass accretion rate, and the outer disk only has while the inner dead zone is dominated by , the disk’s surface density will change by a factor of / within the dead zone outer radius RD, which is shown in Figure 9. Also this density change at RD is more gradual (equation 22 is a smooth function of R) than the zero dead zone viscosity case. This can have a significant impact on planet migration (§4.6).
4. Discussion
4.1. Dead zones and star formation by disk accretion
The main result of our work is that star formation through disk accretion, assuming a sufficiently large initial disk that the MRI is not thermally activated throughout the disk, generally results in a dense belt of material - the “dead zone” -which has implications for disk structure and planet formation.
To demonstrate this more clearly, we show the results for a constant- disk for the same infall model. By comparison with layered disks in Figure 7, constant- disks have similar outer disk but lack the massive dead zone. Constant- disks respond to infall just as layered disks do: a faster rotating core leads to a more massive disk since the infall mass onto larger radii takes longer to accrete to the central star. Our models show that with the same in constant- models, cores with rad s-1 lead to disks 10 times more massive than the disks produced by cores with rad s-1 at 1 Myr. However, even if we allow constant-alpha disks to have different values of alpha (Figure 10), all these models produce surface densities far in excess of 100 g cm-2 over large areas of the disk at the end of infall (lower left panel of Figure 10). Thus, a reduced angular momentum transport efficiency associated with the failure of the MRI at g cm implies the formation of a dense belt or dead zone in the disk.
Another feature of the constant- model is that, although the core rotation determines the disk mass, the disk surface density shape depends most strongly on . This can be simply explained by the similarity solution of the constant- disk where the shape of the disk is determined by the scaling radius (Hartmann et al. 1998), which is proportional to t and . Thus as long as t and are the same, the disk surface density has similar shape. We also notice that, even for a constant- disk, the disk is gravitationally unstable at the infall phase with a reasonable set of parameters (=0.01 and =210-14rad s-1) (Figure 10).
4.2. Relation to previous work
As mentioned in the introduction, previous investigations by Vorobyov & Basu (2006, 2007) and Kratter et al. (2008, 2009) have considered the evolution of disks formed by infall from rotating cloud cores with angular momentum transport by GI. Vorobyov & Basu find outbursting behavior, as we do, but for different reasons; specifically, in their models time-dependent accretion is driven by gravitational clumping, which we cannot treat in one dimension. However, with more realistic energy equations, it is harder to lead to strong gravitational clumping. Kratter et al. (2009) studied more generalized models of infall; they did not find clumping but found conditions for which fragmentation would occur, which agrees with our estimate in Appendix B.
Unlike these investigations, we study slowly rotating cloud cores forming single stars without disk fragmentation, focussing on disk evolution after the central core collapse. We treat the GI as a local phenomenon, which may be problematic if the disk is very massive (Lodato & Rice 2005). However, during later stages when the disk is less massive, a local treatment appears to be reasonable (Lodato & Rice 2004, Cossins et al. 2009a). In addition, we are able to treat radiative cooling more realistically; the treatment of thermal physics plays a crucial role in GI transport (e.g., Durisen et al. 2007) and MRI-GI outbursts (Paper I).
Lodato & Rice (2005) found recurrent episodes of gravitational instability in a massive disk. Boley & Durisen (2008) considered three-dimensional simulations of gravitationally-unstable disks with accurate radiative transfer, and also suggested that high mass fluxes could result from the rapid onset of GI, producing something like an FU Ori outburst. The question is whether this behavior is a transient due to an initial condition, which may or may not be realizable as part of a natural evolutionary sequence. This GI outburst could be a boost in the MRI activation.
Rice et al. (2009) also considered the evolution of disks formed by infall with GI as the transport mechanism. They also find that massive disks result, which leads them to suggest that another mechanism of viscosity must be operating to drain disks. We address this possibility in §4.5.
Our treatment differs from all of the above in including MRI transport with layered accretion. This results in our outer disks tending to evolve viscously rather than through GI, so that mass accretion can continue even after the disk is gravitationally stable. Perhaps most importantly, our one-dimensional model allows us to treat the very innermost disk at the same time considering the outer disk evolution, something that is extremely difficult to do with two- or three-dimensional codes. This allows us to demonstrate behavior not seen in the other simulations; specifically, the onset of MRI-driven accretion in the inner disk, which tends to dominate the outburst behavior - or, as we have shown, result in a phase of quasi-steady disk accretion while low angular momentum core material is infalling.
At high accretion rates, it appears almost certain that the MRI should operate, as temperatures become high enough to sublimate dust, which might otherwise absorb charges. This notion is supported by observations of FU Ori (Zhu et al. 2007, 2008), which indicate that the disk can be hot enough to eliminate dust out to radial scales of order 1 AU. Thus we argue that inclusion of the MRI is important for any understanding of accretion onto central protostars.
The behavior of non-thermally activated MRI by X-ray or cosmic ray radiation is much more uncertain, but its inclusion can also have important effects not seen in pure GI treatments. In our layered simulations, during the T Tauri phase the GI has limited effects on the long term disk evolution and the disk mass accretion rate is controlled by the active layer, as discussed in §3. To confirm this, we have run the same simulation as before but with the from Armitage et al. (2001), which is based on Lin& Pringle (1987, 1990). We found that the different forms of have little effect on the long term evolution of a layered disk; the T Tauri disk evolution is more determined by the active layer. In both treatment of , the layered accretion leads to a relatively massive “inner belt” within 30 AU and a viscous disk beyond 30 AU (Figure 3).
4.3. Outbursts and luminosity problem
Our model predicts that protostars will undergo FU Ori-like outbursts of rapid mass accretion to accumulate a significant amount of their mass, helping to solve the luminosity problem (§1). Here we look at the question of luminosity evolution more closely.
The largest current survey of star-forming regions bearing upon this issue is that of the c2d Spitzer Legacy project (e.g, Enoch et al. 2009, Evans et al. 2009), which strongly suggests that protostellar accretion is time variable, with prolonged periods of low accretion rates. Evans et al. (2009) estimate that half of the mass of a typical low-mass star is accreted during only 7% of the Class I lifetime, which they estimate as Myr. In our fiducial model, roughly half of the mass is accreted quasi-steadily during the first yr, with the other half being accreted during outbursts within the next yr. This agrees with the c2d observations that half of the mass is accreted during high mass accretion rate stage. However, the outburst behavior (episodic accretion) for the individual protostar does depend on the initial rotation of the cloud core. The case accretes almost entirely via outbursts, while the low-rotation case accretes essentially all of the stellar mass quasi-steadily.
Evans et al. (2009) found that 59% of Class 0/I stars have bolometric luminosities smaller than 1.6 L⊙. However, in our fiducial model, 30% of the Class 0/I phase is in the quasi-steady accretion phase with luminosity 13 L⊙ (GM/R∗ by assuming =410 and M∗/R∗=M⊙/10R⊙), much larger than 1.6 L⊙. One possible solution of this problem is that the extinction toward the protostar during this quasi-steady phase is high, with A 400 using our model parameters; it might thus be difficult to identify these objects in such early stages of evolution.
Another possible solution is the oscillation of the thermal MRI region (Wünsch et al. 2006) can lead to additional variations in the mass accretion rate and accretion luminosity (which is the reason we call the first steady accretion phase “quasi-steady”; variations are clearly seen in Figure 1 during the first 105 years)(see §3.1). We have avoided concentrating on this feature because it depends on the complex physics at the inner edge of the dead zone, which is unclear to us now. Nevertheless, this potentially unstable behavior may be important in understanding protostellar accretion in general and may even provide a mechanism for explaining EXor outbursts (Herbig 1977). Further investigation of this problem with a realistic calculation of the onset of the MRI is needed.
Some other limitations of our models are that the infall is axisymmetric with a constant infall rate, and that the GI is treated as a local effect. If the infall has a complex pattern and the GI has a strongly global character, the angular momentum transport during the infall phase could be very efficient (Larson 1984) and disk accretion may be more variable (Vorobyov 2009) or even form warped disk (Bate et al. 2009).
There is also a distinction between the model predictions for outbursts during the infall phase and those which occur after infall ends, during the T Tauri phase. Though they are both triggered by mass accumulation, this is caused by GI during the infall phase, which is independent of the layered structure (Paper I), while the outbursts during the T Tauri phase are triggered by the mass accumulation from active layer accretion, which is sensitive to the assumed value of .
4.4. Rotation and Fragmentation
Our most rapidly-rotating model formally predicts FU Ori-like outbursts during the T Tauri phase, driven by active layer accretion. However, this T Tauri phase outburst behavior is uncertain because it sensitively depends on active layer properties and the massive disks which would produce such behavior fragment instead into multiple stellar systems with individually smaller disks (Rapidly-rotating cores tend to produce large disks that are subject to gravitational fragmentation at R 50 AU in a realistic disk, see Rafikov 2009; Cossins et al. 2009b; see Appendix).
Finally, we consider possible values of envelope angular momentum. Typical observational estimates of the ratio of rotational kinetic to gravitational energy span a range of three orders of magnitude (e.g., Caselli et al. 2002), and thus are difficult to apply to our simulations. Moreover, the total angular momentum is extremely sensitive to assumptions about the distribution of mass with radius as well as the (not necessarily uniform) angular velocity; as cores are generally not Bonnor-Ebert spheres, or even axisymmetric about the rotation axis (Tobin et al. 2009), making it difficult to compare with observations. As mentioned above, cores with more angular momentum than our fastest-rotating model are likely to fragment into multiple systems. Whether significant numbers of slowly-rotating cores exist which can produce diskless T Tauri stars, or T Tauri systems with very low-mass disks, will require more detailed observational analyses of the complex geometries of starless cores.
4.5. Dead zones: do they exist?
We have shown that a natural consequence of our layered model is the formation of dead zones that may remain relatively massive for more than yr (also Vorobyov & Basu 2006, 2007; Rice et al. 2009). This stands in contrast with purely viscous models of disk evolution, as shown in Figure 7. An advantage of highly-viscous models is that they provide an explanation for disk accretion rates during the T Tauri phase (Hartmann et al. 1998; Dullemond, Natta, & Testi 2006), whereas the layered accretion model has some difficulties in explaining T Tauri accretion rates (Hartmann et al. 2006). On the other hand, the pure viscous models are unable to explain FU Ori outbursts, which require large mass reservoirs at distance scales on the order of an AU (Armitage, Livio, & Pringle 2001; Zhu et al. 2007, 2008, 2009).
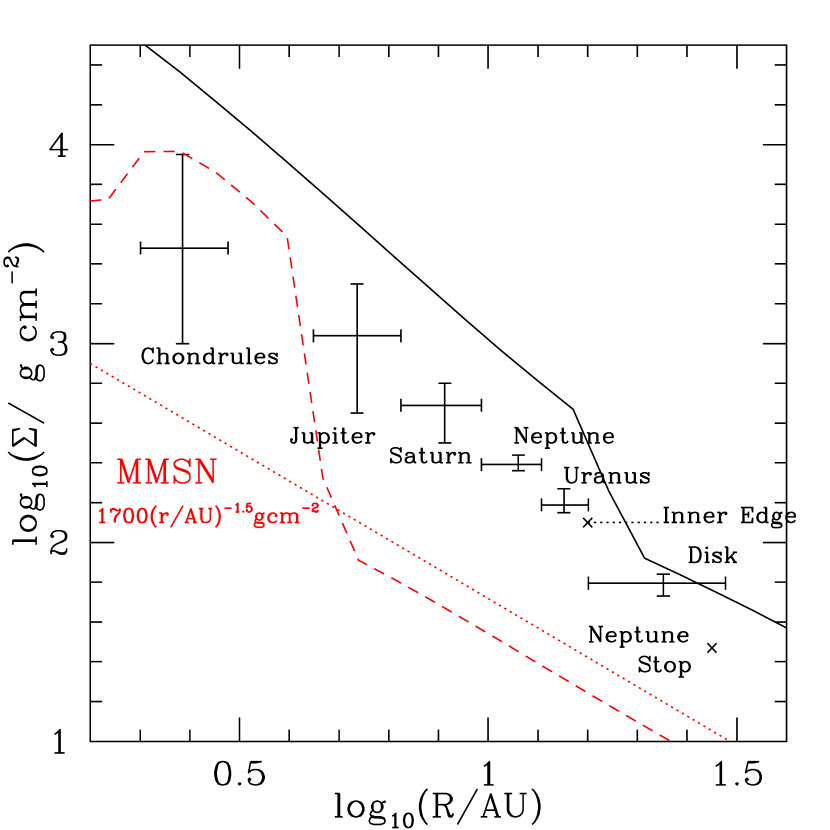
At present the best that can be said is that the MRI is likely to operate at AU, and it is unlikely to operate at larger radii where the temperature is lower. Even the standard form of the minimum-mass solar nebula (Weidenschilling 1977), let alone the recent amplification suggested by Desch (2007; Figure 12), indicates surface densities well in excess of those thought to be penetrated by cosmic rays, or even stellar X-rays. At any rate, the associated change (presumably decrement) in angular momentum transport efficiency where the MRI shuts off is likely to give rise to a feature in the surface density.
At first sight, the surface densities of the dead zones in our evolutionary models seem unreasonably large in comparison with previous models. However, Terquem (2008) has shown that, even for a constant mass accretion rate layered model, the dead zone is very massive. Reyes-Ruiz (2007) has also shown that a massive disk still exists even if the dead zone has some residual viscosity. Some of our models do not predict values of much higher than that of the Desch (2007) model (Fig. 12). If the dead zone has some residual viscosity with , the dead zone mass can be significantly reduced but still relatively massive compared with a constant- disk (Figure 13). Furthermore, some exoplanetary systems have masses substantially larger than that of Jupiter, suggesting that more than minimum mass solar nebulae are required, especially if migratory loss of solid bodies is significant.
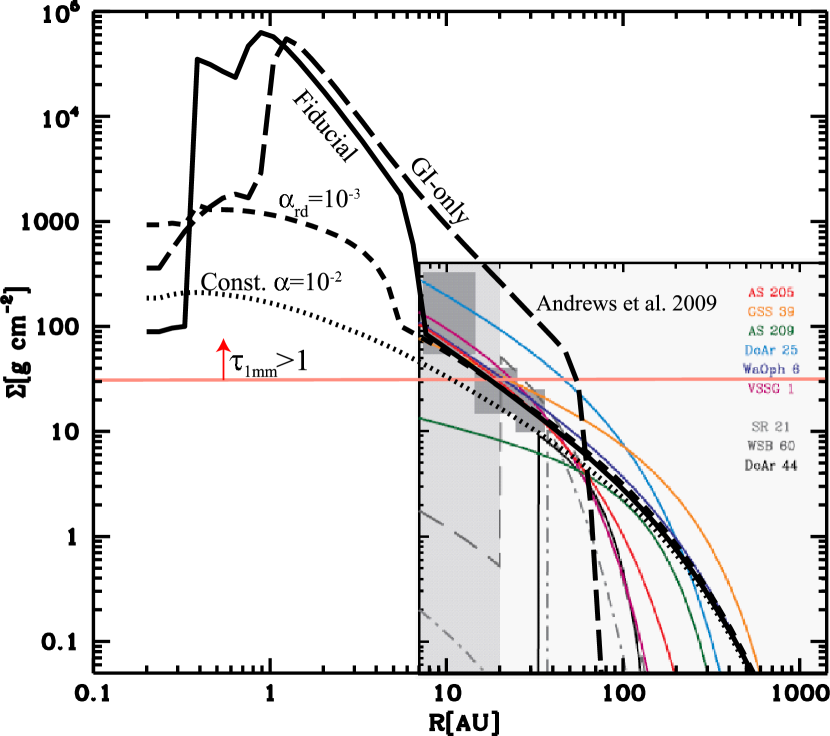
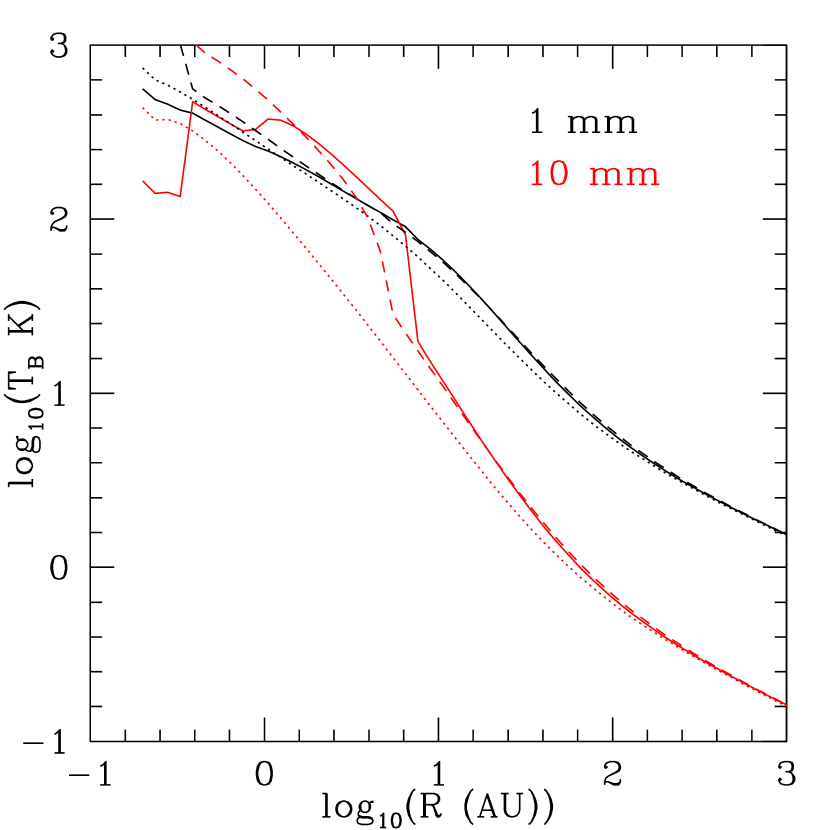
Have high surface density regions been ruled out by recent interferometric observations of submm dust emission in disks, such as those of Andrews et al. (2009)? To examine this possibility, in Figure 13 we compare various models (our fiducial model, fiducial model with a residual dead zone viscosity, and a constant- accretion model) with the suite of disk structures inferred by Andrews et al. (2009). The agreement between the Andrews et al. results and our models in the outer disk is not surprising, because they adopted viscous disk solutions like ours to model the observed interferometric visibilities. If we adopt the same opacity as Andrews et al. , we find that there is no strong signal in the disk surface brightness distribution at the edge of the dead zone because it is optically thick and the temperature distribution is dominated by irradiation from the central star (the brightness temperatures for the layered model and the constant- model are the same at 1 mm in Figure 14). The model does predict a possible feature at cm where the outer disk becomes optically thin (Figure 14); this might be testable with the EVLA. The high surface densities in the dead zone may lead to rapid coagulation of the solid particles, however, reducing the optical depth contrast between the dead zone and the MRI-active outer disk region.
Our results suggest the potential importance of dead zones for simply providing a large mass reservoir for solid body formation. Higher density regions may be problematic in that timescales for radial drift of small bodies and Type I migration become much shorter; on the other hand, this may be offset by having more material to start with, and other features of the dead zone may help provide “traps” where planetesimal can form efficiently (Rice et al. 2004) and migration can be halted or even reversed (see the following section).
In this connection it is worth noting the existence of the so-called “transition” disks, where outer, optically-thick disks surrounding T Tauri stars have very large inner disk holes - either partially or fully evacuated (e.g, Espaillat et al. 2007). In some cases these large inner disk holes may be the result of tidal torques from companion (binary) stars, but in others giant planets may be the cause of the inner disk clearing. In the latter case, it may be necessary to have multiple giant planets form nearly simultaneously over a range of radii in order to explain the sizes of these disk holes. The dead zones of our models, with relatively large surface densities over a significant range of radii, may be able to promote the necessary runaway growth.
4.6. RD and planet migration
The sharp density jump at the dead zone outer radius (RD) can significantly affect the planet migration outside the dead zone (Matsumura & Pudritz 2007); the associated torque on the planet depends on RD, the density jump factor , and the width of the density jump.
In the framework of this paper, we derive the first two parameters analytically and test it numerically. For RD, §3.1 and the Appendix have shown that it starts at the outer disk at the end of the infall, and then travels inwards with time at a speed given in equation A16 in the Appendix. With the initial RDRcmax (if we only consider the slow rotating core: no GI fragmentation and active layer GI as discussed in the Appendix) and the speed of RD, the position of RD can be derived at any time later (Figure 11). Based on equation A16, the speed of RD gets slower when moving inwards, which is seen in Figure 11.
We can derive if the dead zone residual is small enough (). With such a small dead zone residual viscosity, the disk is gravitationally unstable within RD. Thus the surface density jump can be simply derived by dividing the surface density of the Q=1 disk to ,
| (23) |
Here we have assumed the temperature profile as =200 K(R/1 AU)-1/2. Thus, as the dead zone moves inwards ( becomes smaller), increases. However, the density jump width, which is the last parameter required to calculate the torque on the planet, cannot be constrained by our 1D simulation.
4.7. MMSN and planet formation in the layered disk
Although at the early stage the inner disk is massive, at later stage (Myr) the outer disk (beyond 10 AU) is comparable to the minimum mass solar nebulae (MMSN) from Weidenschilling (1977) (Figure 12). Due to the boundary effect at the dead zone outer radius RD (§3.1 and Appendix), the outer disk evolves towards as in the standard MMSN. Furthermore, if the dead zone is massive, RD moves inwards very slowly (§4.5); then lasts for a long time.
If planets form in a massive dead zone, they may be lost by inward migration; however, some may be trapped at the inner boundary (Kretke et al. 2009) or outer boundary (Matsumura et al. 2007,2009) of the dead zone.
5. Conclusions
In this paper, we have constructed a one-dimensional two-zone accretion disk model to study disk formation and long-term evolution under the collapse of a BE rotating core. The model evolution can be divided into three stages. At the early stage, when the mass falls to the inner disk within AU scale, the MRI can be sustained in the inner disk and efficiently and steadily transfers the infalling mass to the central star. Later, when the mass falls beyond AU scale, the disk goes to the outburst stage due to the accretion rates’ mismatch by the MRI and GI as described in Paper I. After the infall completes, the disk enters the T Tauri phase and evolves on its own. Cores with higher initial rotation end up with a more massive disk and more disk episodic accretion events (outbursts). As long as the initial cloud core does not rotate extremely slowly to form a tiny disk (Rcmax1 AU), more than half of the star mass is built up by outbursts, which eases the “luminosity” problem.
Disks exhibit a variety of behavior during the T Tauri phase. For a disk with accretion sustained only by gravitational instability, the disk evolves towards a Q=1 disk and the disk truncates at a radius slightly larger than the maximum centrifugal radius of the infall. If the disk has an active layer at the surface, however, the active layer can extend to a much larger radius and a sharp density drop develops at a characteristic radius RD that separates the marginally gravitationally stable dead zone and the MRI active but gravitationally stable outer disk. The density jump at RD may be observable by the EVLA and ALMA. The formation of a dense belt of material is associated with the failure of magnetically driven transport due to low ionization at intermediate radius in the disk; the only ways to avoid this are (1) if there is a separate, equally efficient hydrodynamic transport mechanism, or (2) if for some reason the MRI fails in the outer disk as well, perhaps due to dynamo failure.
Appendix A A. Layered accretion
For a layered disk dominated by viscous heating, Gammie (1996) showed that the central temperature and the mass accretion rate at the radius R are
| (A1) | |||||
| (A2) | |||||
where the Bell & Lin (1994) opacity has been used.
In the irradiation dominated limit, the disk temperature is the external temperature (equation 4), . In this case the disk temperature and mass accretion rate with radii are
| (A3) |
| (A4) | |||||
Comparing equations A4 and A2, we see that the disk is irradiation dominated if the active layer has surface density ( g cm-2), or is smaller than , or the luminosity is significantly larger than the stellar radiation (L10).
A.1. A.1 Dead zone
In either of the above cases the layered disk accretion rates increase nearly linearly with radius, which results in piling up mass in the dead zone at small radii. Using the mass conservation equation
| (A5) |
. Thus the layered disk surface density increases linearly with time and it increases more rapidly at smaller radii. If we assume the dead zone has zero residual viscosity (non-zero residual viscosity has been discussed in §3.3.2) and active layer viscosity =k, disk evolution becomes:
| (A6) |
Thus
| (A7) |
which increases linearly with time due to the layered accretion, as shown by Matsumura & Pudritz (2007).
The dead zone starts at 0.1 AU and ends at the radius where the disk surface density is smaller than (the dead zone outer radius RD), leaving only the MRI active layer ionized by cosmic and/or X rays at larger radii. This pure MRI active outer disk beyond RD evolves like a constant- viscous disk. However since the active layer of the inner disk accretes mass inwards, the dead zone is gradually depleted so that RD moves inwards with time.
To determine the dead zone size (RD) during the layered disk evolution, we need to know its initial position just after the infall. Initially RD should be close to Rcmax inside of which the infall mass lands. However this is only true if the initial core rotates slowly and Rcmax is small. If the inital core rotates rapidly and Rcmax is large, the dead zone size is constrained by the radius where the active layer becomes gravitationally unstable. Generally, the dead zone cannot extend to R50AU if =100 g cm-2 due to the active layer GI. This is because the GI can be very efficient in transporting mass and angular momentum when , and the surface density with Q=1 can be considered as an upper limit that the disk surface density cannot exceed during the evolution. For a layered disk dominated by viscous heating, Gammie (1996) has shown that the Toomre Q parameter at R is
| (A8) |
At the outer dead zone radius (RD), ; with the condition that Q1,
| (A9) |
For an irradiation dominated disk, we derive a similar condition:
| (A10) |
assuming
| (A11) |
Then,
| (A12) |
Since Q(RD)1,
| (A13) |
In either case, R 50 AU. To test this, we computed a case with a rad s-1 core. The core mass falls into Rcmax as large as 400 AU, but the dead zone beyond 30 AU is quickly cleared by the GI so that RD is smaller than 30 AU during the T Tauri phase.
After we know the initial RD position, the motion of RD can be derived by considering the mass conservation at RD. For the region extending from RD- to RD,
| (A14) |
Assuming the mass flux (or ) at RD is zero, which will be justified in some cases later, and considering the time for the dead zone within R to be depleted is , we got
| (A15) |
thus
| (A16) |
where is as equation A4. If we insert we can derive vD. Considering + is larger at smaller radii, the speed of RD decrease with time when it is moving inwards. Finally, when RD moves to the very inner radii where , RD is almost halted.
A.2. A.2 Outer pure MRI active disk beyond RD
Beyond RD the disk is purely MRI active with a constant . Its surface density evolution can be solved by
| (A17) |
with the boundary condition =. If , this solution can be simplified by dividing it into two parts
| (A18) |
where the first term on the right comes from the disk evolution with a zero surface density boundary condition at RD (=0), and the second term is the effect of the non-zero boundary surface density at RD. The first term behaves like the similarity solution with a R-1 part and a power law decrease part at larger radius, and it eventually decreases to zero with time. The surface density evolution is determined by the competition between the first and the second term. During the infall phase, the disk is massive, and the first term is larger than the second term, thus the disk behaves like a similarity solution. Then after infall stops, as the disk accretes and RD moves inwards, both of these two terms decrease, and as shown above, RD moves inwards more slowly. Eventually RD can be considered independent of t; the first term goes to zero and the second term dominates so that we have (if n=1), which distinguishes it from the self-similarity solution.
Next, we consider the late stage when RD is independent of time analytically by the Green’s function method. If the viscosity is a function of radius, equation A17 is a linear equation for and can be solved by a Green’s function (Lust 1952; Lynden-Bell & Pringle 1974). If , the above equation becomes
| (A19) |
and the radial dependence of is a linear combination of the Bessel functions and , where (Lynden-Bell & Pringle 1974). However for a fixed inner boundary condition at ,
| (A20) |
we can substitute with
| (A21) |
so that equation A19 and the boundary condition A20 changes to
| (A22) |
and
| (A23) |
which becomes a normal disk evolution equation of with a zero surface density boundary condition. The solution of is well studied and this disk expands with limit , , thus from equation A21, we derive , . Thus as long as the disk evolves long enough the impact of any initial condition will be washed out, and the boundary term dominates the surface density distribution with .
In the irradiation dominated case, n=1, we transform equation A22 by writing and (Pringle 1991) to get
| (A24) |
with the boundary condition at . The general solution is then
| (A25) |
where . is determined by the initial conditions. Following Pringle (1991), in order to obtain the Green’s function, we set the initial condition with
| (A26) |
With the delta function Fourier transform and , we derive
| (A27) |
Thus the solution for the initial condition A26 is
| (A28) | |||||
Finally, the solution for any initial condition is
| (A29) | |||||
and
| (A30) |
where the first term is the disk evolution with a zero boundary condition and the second term is the fixed boundary effect. As , .
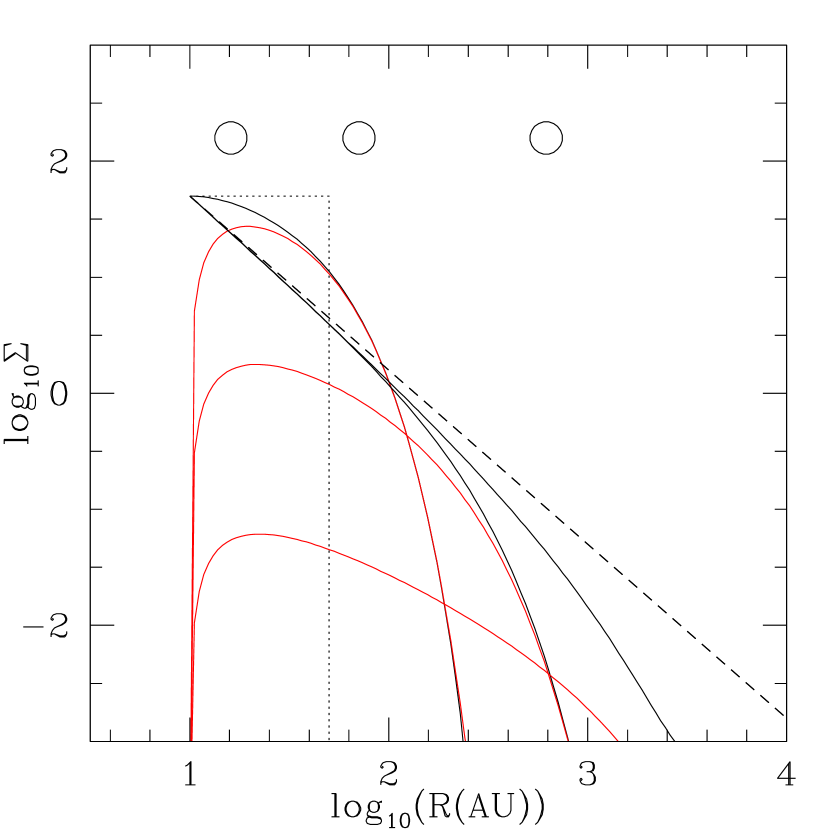
Figure 15 shows the evolution of the constant disks with two different boundary conditions: (10 AU)=50 g cm-2 (black curves) and (10 AU)=0 g cm-2 (red curves). The initial conditions are set as
| (A31) |
| (A32) |
As shown in figure 15, the disk with zero boundary condition behaves quite similar to the similarity solution. However, for the (10 AU)=50 g cm-2 disk, the influence of the boundary becomes significant with a part and a outer part decreasing exponentially.
The mass accretion rate at RD decreases to zero eventually (). This can be shown by assuming and . Inserting these into
| (A33) |
we find
| (A34) |
In the asymptotic case as discussed above with , , which means at , at the inner boundary RD, so no mass flow in the disk. This can be simply understood because the disk has zero torque with if .
However, notice that this behavior is only observed for layered disks with small or negligible dead zone viscosity, so that at very late stage RD is very small and almost fixed.
A.3. A.3 Residual dead zone viscosity
If the residual dead zone viscosity 10-4, the dead zone can transport the mass at a rate comparable to the accretion rate of the active layer, considering and . If we assume the disk has a constant mass accretion rate after a long period of time, then =-2R-2R is a constant and we can integrate the angular momentum equation to derive
| (A35) |
If we assume at the stellar surface is 0, we find C=- R/2. Thus
| (A36) |
Furthermore, if the disk is irradiation-dominated so that the temperature is R-1/2, we have =kaR and =kdR where ka and kd are constants and proportional to and . So
| (A37) |
If the dead zone transports mass at a rate higher than the active layer, the last term can be neglected for order of magnitude argument. And compared with a constant- disk having the same mass accretion rate, the layered disk has a surface density higher than the constant- disk by a factor of /. If we assume the outer pure MRI active disk and the inner layered disk has the same mass accretion rate, and the outer disk only has while the inner dead zone is dominated by , the disk’s surface density will increase by a factor of / within the dead zone outer radius RD, which is shown in Figure 9. Also this density change at RD is more gradual (equation 22 is a smooth function of R) than the zero dead zone viscosity case.
Appendix B B. GI disk fragmentation radius
Gammie (2001) has pointed out that when the disk cooling timescale the disk will fragment. By assuming local dissipation, Gammie (2001) has shown that
| (B1) |
Thus, the disk will fragment if (Rice et al. 2005). However, the above fragmentation condition has only been tested for disks without any irradiation. With irradiation dominated disk, is hard to be defined and 1 condition are used by Rafikov (2009) instead (Here we use 0.06 to be consistent with the non-irradiated case.).
For a constant accretion rate we have
| (B2) |
Combined with Q=1.5, we derive
| (B3) |
Thus the disk will fragment if G/2c0.06.
For a viscous heating dominated Q=1 disk, at a given mass accretion rate (), the relationship between Tc and R is given in Equation (23) in Paper I. If we reorganize the equation and assume =0 (=CTαPβ) with Q=3/2, we got
| (B4) | |||||
Inserting this into G/2c0.06,
| (B5) | |||||
With our dust opacity =0.738 (Zhu et al. 2009 b), the critical fragmentation radius R. Thus the fragmentation radius is insensitive to in the viscous heating dominated case and 100 AU (Figure 5).
For an irradiation dominated case (low mass accretion rate), cs in equation B3 is determined by the irradiation (equation 4), thus
| (B6) |
In this case the critical fragmentation R has a sharper dependence on (Figure 5). The GI fragmentation region is outlined in Figure 5, which agrees with Figure 10 of Cossins et al. (2009)b.
References
- Alves et al. (2001) Alves, J. F., Lada, C. J., & Lada, E. A. 2001, Nature, 409, 159
- Andrews et al. (2009) Andrews, S. M., Wilner, D. J., Hughes, A. M., Qi, C., & Dullemond, C. P. 2009, ApJ, 700, 1502
- Armitage et al. (2001) Armitage, P. J., Livio, M., & Pringle, J. E. 2001, MNRAS, 324, 705
- Balbus & Hawley (1998) Balbus, S. A., & Hawley, J. F. 1998, Reviews of Modern Physics, 70, 1
- Benson & Myers (1989) Benson, P. J., & Myers, P. C. 1989, ApJS, 71, 89
- Boley et al. (2006) Boley, A. C., Mejía, A. C., Durisen, R. H., Cai, K., Pickett, M. K., & D’Alessio, P. 2006, ApJ, 651, 517
- Boley & Durisen (2008) Boley, A. C., & Durisen, R. H. 2008, ApJ, 685, 1193
- Caselli et al. (2002) Caselli, P., Benson, P. J., Myers, P. C., & Tafalla, M. 2002, ApJ, 572, 238
- Cassen & Moosman (1981) Cassen, P., & Moosman, A. 1981, Icarus, 48, 353
- Chiang & Murray-Clay (2007) Chiang, E., & Murray-Clay, R. 2007, Nature Physics, 3, 604
- Cossins et al. (2009) Cossins, P., Lodato, G., & Clarke, C. J. 2009a, MNRAS, 393, 1157
- Cossins et al. (2009) Cossins, P., Lodato, G., & Clarke, C. 2009b, arXiv:0910.0850
- Crida (2009) Crida, A. 2009, ApJ, 698, 606
- Desch (2007) Desch, S. J. 2007, ApJ, 671, 878
- di Francesco et al. (2007) di Francesco, J., Evans, N. J., II, Caselli, P., Myers, P. C., Shirley, Y., Aikawa, Y., & Tafalla, M. 2007, Protostars and Planets V, 17
- Dominik & Dullemond (2008) Dominik, C., & Dullemond, C. P. 2008, A&A, 491, 663
- Dullemond et al. (2006) Dullemond, C. P., Natta, A., & Testi, L. 2006, ApJ, 645, L69
- Durisen et al. (2007) Durisen, R. H., Boss, A. P., Mayer, L., Nelson, A. F., Quinn, T., & Rice, W. K. M. 2007, Protostars and Planets V, 607
- Enoch et al. (2009) Enoch, M. L., Evans, N. J., Sargent, A. I., & Glenn, J. 2009, ApJ, 692, 973
- Espaillat et al. (2007) Espaillat, C., Calvet, N., D’Alessio, P., Hernández, J., Qi, C., Hartmann, L., Furlan, E., & Watson, D. M. 2007, ApJ, 670, L135
- Evans et al. (2009) Evans, N. J., et al. 2009, ApJS, 181, 321
- Foster & Chevalier (1992) Foster, P. N., & Chevalier, R. A. 1992, BAAS, 24, 1215
- Gammie (1996) Gammie, C. F. 1996, ApJ, 457, 355
- Gammie (2001) Gammie, C. F. 2001, ApJ, 553, 174
- Gong & Ostriker (2009) Gong, H., & Ostriker, E. C. 2009, ApJ, 699, 230
- Hartmann et al. (2006) Hartmann, L., D’Alessio, P., Calvet, N., & Muzerolle, J. 2006, ApJ, 648, 484
- Henriksen et al. (1997) Henriksen, R., Andre, P., & Bontemps, S. 1997, A&A, 323, 549
- Ilgner & Nelson (2008) Ilgner, M., & Nelson, R. P. 2008, A&A, 483, 815
- Kenyon & Hartmann (1995) Kenyon, S. J., & Hartmann, L. 1995, ApJS, 101, 117
- Kratter et al. (2008) Kratter, K. M., Matzner, C. D., & Krumholz, M. R. 2008, ApJ, 681, 375
- Kratter et al. (2009) Kratter, K. M., Matzner, C. D., Krumholz, M. R., & Klein, R. I. 2009, arXiv:0907.3476
- Kretke et al. (2009) Kretke, K. A., Lin, D. N. C., Garaud, P., & Turner, N. J. 2009, ApJ, 690, 407
- Larson (1984) Larson, R. B. 1984, MNRAS, 206, 197
- Lesur & Papaloizou (2009) Lesur, G., & Papaloizou, J. C. B. 2009, arXiv:0911.0663
- Lin & Pringle (1990) Lin, D. N. C., & Pringle, J. E. 1990, ApJ, 358, 515
- Lodato & Rice (2004) Lodato, G., & Rice, W. K. M. 2004, MNRAS, 351, 630
- Lodato & Rice (2005) Lodato, G., & Rice, W. K. M. 2005, MNRAS, 358, 1489
- Lynden-Bell & Pringle (1974) Lynden-Bell, D., & Pringle, J. E. 1974, MNRAS, 168, 603
- Matsumoto & Hanawa (2003) Matsumoto, T., & Hanawa, T. 2003, ApJ, 595, 913
- Matsumura et al. (2007) Matsumura, S., Pudritz, R. E., & Thommes, E. W. 2007, ApJ, 660, 1609
- Matsumura et al. (2009) Matsumura, S., Pudritz, R. E., & Thommes, E. W. 2009, ApJ, 691, 1764
- Petersen et al. (2007) Petersen, M. R., Julien, K., & Stewart, G. R. 2007, ApJ, 658, 1236
- Pringle (1991) Pringle, J. E. 1991, MNRAS, 248, 754
- Rafikov (2009) Rafikov, R. R. 2009, ApJ, 704, 281
- Reyes-Ruiz & Stepinski (1995) Reyes-Ruiz, M., & Stepinski, T. F. 1995, ApJ, 438, 750
- Reyes-Ruiz (2007) Reyes-Ruiz, M. 2007, MNRAS, 380, 311
- Rice et al. (2004) Rice, W. K. M., Lodato, G., Pringle, J. E., Armitage, P. J., & Bonnell, I. A. 2004, MNRAS, 355, 543
- Rice et al. (2009) Rice, W. K. M., Mayo, J. H., & Armitage, P. J. 2009, arXiv:0911.1202
- Sano et al. (2000) Sano, T., Miyama, S. M., Umebayashi, T., & Nakano, T. 2000, ApJ, 543, 486
- Shlosman & Begelman (1987) Shlosman, I., & Begelman, M. C. 1987, Nature, 329, 810
- Shu (1977) Shu, F. H. 1977, ApJ, 214, 488
- Stone et al. (1996) Stone, J. M., Hawley, J. F., Gammie, C. F., & Balbus, S. A. 1996, ApJ, 463, 656
- Terquem (2008) Terquem, C. E. J. M. L. J. 2008, ApJ, 689, 532
- Terebey et al. (1984) Terebey, S., Shu, F. H., & Cassen, P. 1984, ApJ, 286, 529
- Tobin et al. (2010) Tobin, J. J., Hartmann, L., Chiang, H.-F., & Looney, L. W. 2010, arXiv:1002.2362
- Turner et al. (2007) Turner, N. J., Sano, T., & Dziourkevitch, N. 2007, ApJ, 659, 729
- Vorobyov & Basu (2005) Vorobyov, E. I., & Basu, S. 2005, ApJ, 633, L137
- Vorobyov & Basu (2006) Vorobyov, E. I., & Basu, S. 2006, ApJ, 650, 956
- Vorobyov & Basu (2007) Vorobyov, E. I., & Basu, S. 2007, MNRAS, 381, 1009
- Vorobyov (2009) Vorobyov, E. I. 2009, ApJ, 704, 715
- Vorobyov & Basu (2009) Vorobyov, E. I., & Basu, S. 2009, MNRAS, 393, 822
- Ward-Thompson et al. (2007) Ward-Thompson, D., André, P., Crutcher, R., Johnstone, D., Onishi, T., & Wilson, C. 2007, Protostars and Planets V, 33
- Weidenschilling (1977) Weidenschilling, S. J. 1977, Ap&SS, 51, 153
- Wünsch et al. (2006) Wünsch, R., Gawryszczak, A., Klahr, H., & Różyczka, M. 2006, MNRAS, 367, 773
- Zhu et al. (2007) Zhu, Z., Hartmann, L., Calvet, N., Hernandez, J., Muzerolle, J., & Tannirkulam, A.-K. 2007, ApJ, 669, 483
- Zhu et al. (2008) Zhu, Z., Hartmann, L., Calvet, N., Hernandez, J., Tannirkulam, A.-K., & D’Alessio, P. 2008, ApJ, 684, 1281
- Zhu et al. (2009) Zhu, Z., Espaillat, C., Hinkle, K., Hernandez, J., Hartmann, L., & Calvet, N. 2009a, ApJ, 694, L64
- Zhu et al. (2009) Zhu, Z., Hartmann, L., & Gammie, C. 2009b, ApJ, 694, 1045
- Zhu et al. (2009) Zhu, Z., Hartmann, L., Gammie, C., & McKinney, J. C. 2009c, ApJ, 701, 620
- Zhu et al. (2010) Zhu, Z., Hartmann, L., Gammie, C., Laura G. B., Jacob B. S., Eric E. 2010, accepted


| cloud | RD 0.3/1 Myr | MinaaThe disk mass within RD | MobbThe disk mass beyond RD | MtccThe total disk mass | ||
|---|---|---|---|---|---|---|
| g cm-2 | AU | |||||
| 210-14 | 100 | 0.01 | 40/13 | 0.29/0.19 | 0.18/0.14 | 0.47/0.33 |
| 210-14 | 10 | 0.01 | 127/66 | 0.42/0.33 | 0.05/0.09 | 0.48/0.42 |
| 210-14 | 0 | 0.01 | -/- | 0.47/0.41 | -/- | 0.47/0.41 |
| 110-14 | 100 | 0.01 | 24/7.6 | 0.17/0.1 | 0.07/0.06 | 0.24/0.16 |
| 110-14 | 10 | 0.01 | 47/34 | 0.32/0.23 | 0.008/0.022 | 0.32/0.26 |
| 310-15 | 100 | 0.01 | 4.6/2.4 | 0.05/0.04 | 0.006/0.007 | 0.057/0.049 |
| 310-15 | 10 | 0.01 | 5.5/4.6 | 0.06/0.06 | 0.0004/0.001 | 0.063/0.063 |
| 310-15 | 0 | 0.01 | -/- | 0.064/0.064 | -/- | 0.064/0.064 |