The JCMT Nearby Galaxies Legacy Survey II: Warm Molecular Gas and Star Formation in Three Field Spiral Galaxies
Abstract
We present the results of large-area 12CO =3-2 emission mapping of three nearby field galaxies, NGC 628, NGC 3521, and NGC 3627, completed at the James Clerk Maxwell Telescope as part of the Nearby Galaxies Legacy Survey. These galaxies all have moderate to strong 12CO =3-2 detections over large areas of the fields observed by the survey, showing resolved structure and dynamics in their warm/dense molecular gas disks. All three galaxies were part of the Spitzer Infrared Nearby Galaxies Survey sample, and as such have excellent published multi-wavelength ancillary data. These data sets allow us to examine the star formation properties, gas content, and dynamics of these galaxies on sub-kiloparsec scales. We find that the global gas depletion times for dense/warm molecular gas in these galaxies is consistent with other results for nearby spiral galaxies, indicating this may be independent of galaxy properties such as structures, gas compositions, and environments. Similar to the results from the THINGS H i survey, we do not see a correlation of the star formation efficiency with the gas surface density consistent with the Schmidt-Kennicutt law. Finally, we find that the star formation efficiency of the dense molecular gas traced by 12CO =3-2 is potentially flat or slightly declining as a function of molecular gas density, the 12CO =3-2/=1-0 ratio (in contrast to the correlation found in a previous study into the starburst galaxy M83), and the fraction of total gas in molecular form.
1 Introduction
Gas and dust in disk galaxies are intimately linked to almost all aspects of their evolution, dynamics, and appearance. For example, the interstellar medium (ISM) influences star formation and evolution, while these processes in turn have an effect on the distribution and turbulence of the ISM. One of the most important links is that between the molecular clouds, which provide the fuel for star formation, and the location and rate of star formation. However the underlying physical process that drives this relation is still poorly understood (Schaye & Dalla Vecchia, 2008). A recent detailed study by Leroy et al. (2008), using the high resolution H i maps from THINGS (Walter et al., 2008), found that many of the commonly used prescriptions do not predict the star formation well. Tracing all components of the ISM across a wide variety of galaxies can lead to a greater understanding of the physics of the star formation process, its dependence on the properties of the host galaxy’s ISM, the evolution of galaxies, and the distribution of dark matter.
One of the limiting factors in understanding the physics of star formation is our ability to trace the molecular gas clouds within galaxies. Much work has been done recently to examine the molecular gas within individual and small samples of nearby galaxies using various molecular transition lines that trace different gas densities and temperatures. The most extensive observations thus far have used the millimeter 12CO =1-0 transition to map molecular gas, including large surveys of nearby galaxies with single-dish telescopes and interferometers (e.g. Young et al., 1995; Helfer et al., 2003; Kuno et al., 2007). This transition is most sensitive to cold, lower density molecular gas, which does not appear to trace star formation on a one-to-one basis (Greve et al., 2005). Recent studies such as Iono et al. (2009) have found that higher order transitions such as the 12CO =3-2 line more closely follow global star formation, nearly linearly over five orders of magnitude.
The James Clerk Maxwell Telescope (JCMT) is a 15 meter single dish submillimeter telescope operated by the Joint Astronomy Centre (JAC) on Mauna Kea, Hawai’i, which after a recent major upgrade is undertaking the JCMT Legacy Survey†††http://www.jach.hawaii.edu/JCMT/surveys/ (JLS) a series of seven surveys from planetary to cosmological scales. One of these, the JCMT Nearby Galaxies Legacy Survey (NGLS), is the first large submillimeter survey of nearby galaxies at 15″ spatial resolution. Taking advantage of new instrumentation on the JCMT, the survey will observe a well-selected sample of 155 nearby galaxies (within 25 Mpc) at 850 m and 450 m and in the 12CO =3-2 line. The NGLS data set will be a powerful tool for studying the physics of the dusty ISM in galaxies as well as the interplay between star formation and the ISM. With a large, well-selected sample, we will be able to search for variations in the physical properties of the ISM as a function of galaxy type, metallicity, star formation rate, mass, and environment. By having limited our sample galaxies to distances closer than 25 Mpc, we will be able to study spatial scales of 0.2-2 kpc and to search for variations inside a single galaxy as well as between galaxies.
| Name | (J2000.0) | (J2000.0) | Type | |||||||
|---|---|---|---|---|---|---|---|---|---|---|
| (km s-1) | (Mpc) | (mag) | ( ) | ( ) | ( erg s-1) | (°) | ||||
| (1) | (2) | (3) | (4) | (5) | (6) | (7) | (8) | (9) | (10) | (11) |
| NGC 628 | SA(s)c | 648 | 7.3 | -19.58 | 38.0 | 6.3 | 40.87 | 7.0 | ||
| NGC 3521 | SAB(rs)bc | 778 | 10.7 | -19.85 | 80.2 | 19.5 | 41.00 | 72.7 | ||
| NGC 3627 | SAB(s)b | 697 | 9.4 | -20.44 | 8.18 | 41.2 | 41.11 | 61.8 |
Note. — Col. (1): Galaxy name. Col. (2) and (3): J2000.0 right ascension and declination as given in RC3 (de Vaucouleurs et al., 1991). Units of right ascension are hours, minutes, and seconds, and units of declination are degrees, arcminutes, and arcseconds. Col. (4): Galaxy morphology type from NED. Col. (5): Systemic velocity from the H i line (Heliocentric). Col. (6): Adopted distance (Karachentsev et al., 2004; Walter et al., 2008; Freedman et al., 2001, respectively). Col. (7): Total absolute B-band magnitude (Kennicutt et al., 2008). Col. (8): The H i mass from THINGS (Walter et al., 2008). Col. (9): The H2 mass from the NRAO 12 m 12CO =1-0 on-the-fly observations for BIMA SONG (Helfer et al., 2003). Col. (10): The H luminosity from Kennicutt et al. (2008). Col. (11): The adopted inclination (Walter et al., 2008; de Blok et al., 2008).
Since November 2007 the first phase of the survey has been complete, observing 57 galaxies of the sample in the 12CO =3-2 line; 21 overlap with the Spitzer Infrared Nearby Galaxies Survey (SINGS, Kennicutt et al., 2003) sample, and 36 are members of the Virgo Cluster. 12CO =3-2 observations for the remaining SINGS and field sample galaxies are currently underway. Following on from Wilson et al. (2009, hereafter Paper I), which investigated four SINGS subsample galaxies that are members of the Virgo Cluster, we present the 12CO =3-2 results for three SINGS galaxies outside the cluster environment.
For our initial examination of the 12CO =3-2 data in non-cluster NGLS galaxies, we have chosen to look at three well known local spiral galaxies that were completed in the early stages of the survey: NGC 628, NGC 3521, and NGC 3627. All three of these galaxies have extensive multi-wavelength ancillary data, most recently from SINGS and the follow-up surveys associated with it. Having been included in SINGS, all three have publicly available infrared observations (seven bands from 3.6 to 160 m, plus some spectroscopy). All three were also included in The H i Nearby Galaxy Survey (THINGS, Walter et al., 2008), the VLA H i follow up survey to SINGS. Additionally, they were all observed in the 12CO =1-0 line on the Berkeley-Illinois-Maryland Association (BIMA) millimeter interferometer as part of the BIMA Survey of Nearby Galaxies (BIMA SONG, Helfer et al., 2003), and two (NGC 3521 and NGC 3627) have single dish 12CO =1-0 observations taken with the Nobeyama 45-m telescope by Kuno et al. (2007). Comparing some of the abundant ancillary data available with our JCMT 12CO =3-2 observations provide us with a powerful tool for exploring star formation within these galaxies. Table 1 outlines some of the previously published properties of these three galaxies.
NGC 628 (M 74) is an isolated, near face-on spiral of type SA(s)c. It is known to have an extended H i disk, extending to approximately three times the optical Holmberg radius (Kamphuis & Briggs, 1992). 12CO =1-0 observations of NGC 628 for BIMA SONG (Helfer et al., 2003) only cover the inner region of the galaxy, but show that the molecular gas is clumpy and distributed mostly along the spiral arms. It is slightly less luminous than the other two galaxies we are examining here, and also has the lowest H and 12CO =1-0 luminosity of the three. We adopt the same distance estimates in this paper as in Walter et al. (2008). For NGC 628 the distance we use is 7.3 Mpc, derived by Karachentsev et al. (2004) using the luminosity of the brightest stars.
NGC 3521 is a highly inclined flocculent spiral galaxy (type SAB(rs)bc) that shows a ring-like 12CO =1-0 structure (Helfer et al., 2003). It is associated with the nearby Leo Triplet (of which another of our galaxies, NGC 3627, is a member). It has a moderately high H i mass ( , Walter et al., 2008), the highest of these three galaxies, and the H i disk extends well beyond the stellar disk. The adopted distance to NGC 3521 is 10.7 Mpc (Walter et al., 2008, Hubble flow distance using the velocity listed on NED).
NGC 3627 (M 66) is an active, asymmetric barred spiral galaxy (type SAB(s)b), a member of the Leo Triplet well known for its unusual kinematics that are influenced by both its bar and external interactions (Zhang et al., 1993; Reuter et al., 1996; Regan et al., 2002; Chemin et al., 2003). It is the most luminous and most active of these three galaxies, and has the highest molecular gas content of the three as deduced from 12CO =1-0 observations ( , Helfer et al., 2003). In contrast, the H i mass is the lowest of the three galaxies, such that the molecular gas dominates the gas content of the galaxy. The adopted distance to NGC 3627 is 9.3 Mpc, derived by Freedman et al. (2001) using Cepheid variables.
In this paper we focus on the molecular gas kinematics and detailed star formation properties of these three galaxies. § 2 describes our observations at the JCMT and data reduction process, and the processing of ancillary data. § 3 presents the resulting moment maps from our 12CO =3-2 observations. § 4 compares our new 12CO =3-2 observations to existing H i and 12CO =1-0 data. § 5 deals with the dynamics of the molecular gas, looking at differences in the velocity fields from molecular and atomic gas, and comparing the rotation curves we derive from our 12CO =3-2 observations with those from the H i data of THINGS (Walter et al., 2008). In § 6, we discuss several aspects of star formation within these galaxies. Finally we present our conclusions in § 7.
2 Observations and Data Reduction
Overview
2.1 JCMT 12CO =3-2 Data
| Name | Obs. Dates | PA | Ref. Pos. | ||||||
|---|---|---|---|---|---|---|---|---|---|
| (deg) | (arcsec) | (arcsec) | (K) | (225 GHz) | (s) | (mK) | (arcsec) | ||
| (1) | (2) | (3) | (4) | (5) | (6) | (7) | (8) | (9) | (10) |
| NGC 628 | 071123, 071124, 071125 | 25 | 312 | 288 | 388 | 0.097 | 80 | 15.8 | 432 |
| 080107, 080113 | |||||||||
| NGC 3521 | 080310, 080311 | 163 | 324 | 162 | 402 | 0.109 | 65 | 16.8 | 444 |
| NGC 3627 | 080112, 080113 | 173 | 264 | 120 | 328 | 0.084 | 70 | 13.2 | 384 |
Note. — Col. (1): Galaxy name. Col. (2): Date of observations in 2007 and 2008, YYMMDD. Col. (3): Position angle of the major axis from the optical component, and orientation of the observed field. Col. (4): Major axis length of the target scan region, . Col. (5): Minor axis length of the target scan region, . Col. (6): Median system temperature over all observations. Col. (7): Median atmospheric opacity at 225 GHz as measured with the JCMT water vapor radiometer. Col. (8): Typical integration time per point in the map. Col. (9): Rms noise () in line-free regions of the spectra at 20 km s-1 resolution. Col. (10): Location of the shared off position, in arcseconds east of the center.
The HARP-B 12CO =3-2 line (rest frequency 345.79 GHz) observations for the three galaxies we are examining here, NGC 628, NGC 3521, and NGC 3627, were taken over multiple runs between November 2007 and March 2008 as part of the JLS program. For all three galaxies we mapped a rectangular area corresponding to using a basket weave raster scanning method (see Appendix A for details). We set up the backend spectrometer, the Auto-Correlation Spectrometer Imaging System (ACSIS), with a bandwidth of 1 GHz and a resolution of 488.28 kHz (0.423 km s-1 at the frequency of the observations). In each scan, we integrated for 10 seconds per pointing within the target field (if all 16 receptors were in working order, see Appendix A), and scans were repeated until we reached the target RMS for the survey, 19 mK () after binning to 20 km s-1 resolution. Individual setup and observing details for the three galaxies are listed in Table 2.
Data reduction and most of the analysis were carried out with recent versions (Humu and Lehuakona) of the Starlink‡‡‡available for download from http://starlink.jach.hawaii.edu/ software package that is maintained by the JAC. Additionally, analysis tasks in MIRIAD were used after the creation of cubes and moment maps. The general reduction procedure was to inspect the raw data files, flag poor data where necessary, combine the raw data into a cube, subtract a baseline from the cube, and collapse it into moment maps. We converted the 12CO =3-2 data from to the main beam temperature scale by dividing by . Full details of the observations and data reduction methods are described in Appendix A.
2.2 Ancillary Data
All three galaxies in this paper are well studied members of the SINGS sample, and as a result have a large quantity of published ancillary data, from the far ultraviolet to centimeter radio observations. We obtained 24 m and H maps from the SINGS survey itself (Kennicutt et al., 2003) at the SINGS website§§§http://sings.stsci.edu. H i data cubes and 0th moment maps came from the THINGS survey (Walter et al., 2008) website¶¶¶http://www.mpia-hd.mpg.de/THINGS/Overview.html. There were two sources for 12CO =1-0 maps, single dish Nobeyama maps from Kuno et al. (2007)∥∥∥http://www.nro.nao.ac.jp/ nro45mrt/COatlas/ for NGC 3521 and NGC 3627, and the BIMA SONG******Obtained from NED, http://nedwww.ipac.caltech.edu/ level5/March02/SONG/SONG.html 12CO =1-0 maps for NGC 628 as there were no Nobeyama data available. Although BIMA SONG data was available for all three, they only have good sensitivity in the central part of the field covered by the NGLS, so we preferred the single dish Nobeyama data where available as they cover a similar field size, and the Nobeyama beam size for 12CO =1-0 data is well matched to the JCMT at 12CO =3-2 (so no convolution is required). In all cases, the available ancillary data maps were of similar or higher resolution than the 145 beam of the NGLS 12CO =3-2 observations, and they cover a field-of-view of similar size or larger.
The procedures for processing the SINGS 24 m and H data are outlined in Paper I, and follows the notes and conversions supplied the SINGS User’s Guide SINGS team (2007). To compare these data to the NGLS 12CO =3-2 maps, we first had to convolve them to give a smoothed image with a 145 circular beam to match the JCMT resolution at 345 GHz. The H images contained a significant (and uneven) background sky level that needed to be subtracted by fitting a surface to the image. The fit was limited to a first order polynomial as any higher orders would begin to trace low level H emission from the galaxy. Several artifacts caused by over-exposed stars were also removed from these images using upper and lower thresholds prior to smoothing. The 24 m data did not require any special processing prior to convolving the map to the JCMT resolution. The same smoothing procedure was performed on the BIMA SONG 12CO =1-0 map for NGC 628; however, the Nobeyama 12CO =1-0 data for the other two galaxies were not convolved to this beam as the angular resolution already closely matches the JCMT.
For the H i data, we use the naturally weighted zeroth moment maps that are available on the THINGS Public Data Repository web site (http://www.mpia-hd.mpg.de/THINGS/Data.html) for comparison to our 12CO =3-2 data. These H i data are well matched in resolution to the NGLS observations, with our single dish 12CO =3-2 observations being at only slightly poorer resolution than the naturally weighted interferometric H i data (145 for the JCMT compared to 9″ to 14″ for the VLA data). As with the other ancillary data, we convolved the H i intensity (0th moment) maps to match the JCMT resolution.
Unlike the H i intensity maps, we cannot directly convolve the beams of the velocity fields (1st moment) and velocity dispersion (2nd moment) maps from the THINGS survey for comparison to our 12CO =3-2 moment maps. So instead, we obtained the naturally weighted THINGS H i data cubes for the three galaxies, convolved the cubes to a 145 circular beam, and then created moment maps from the resulting cubes (using a similar procedure to the creation of the 12CO =3-2 maps). While this also produced 0th moment maps, we prefer to use the convolved version of the THINGS maps in this case as their moment map production procedure has been refined for their data set. After convolving to the appropriate resolution, all ancillary data were aligned to the JCMT 12CO =3-2 map and resampled to the same pixel scale as the 12CO =3-2 maps (73 pixels).
3 Results: 12CO =3-2 Images
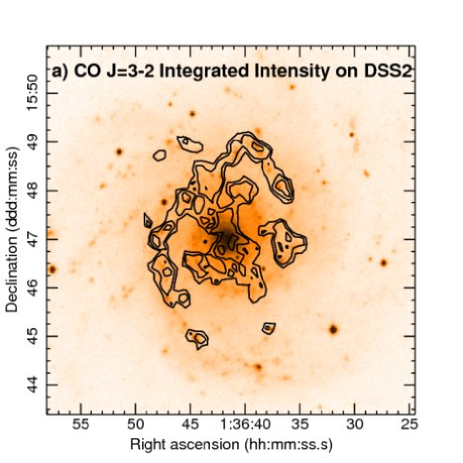
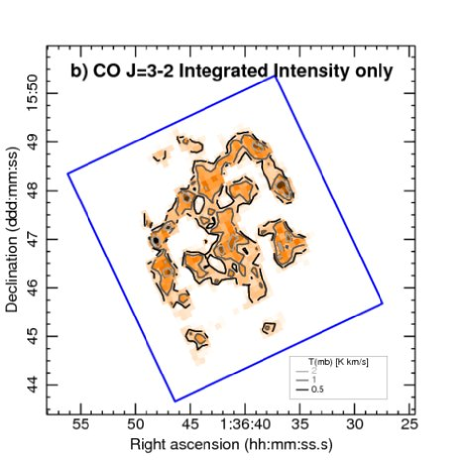
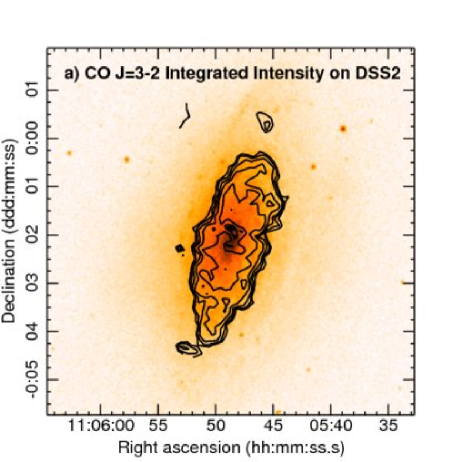
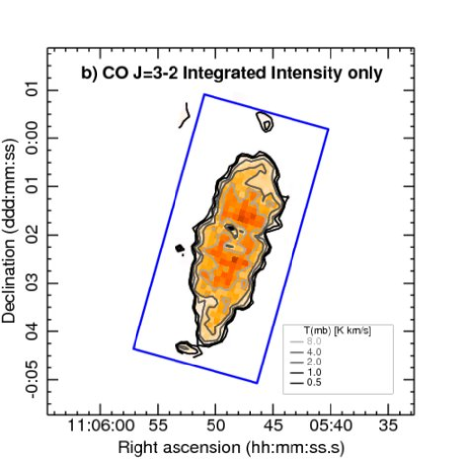
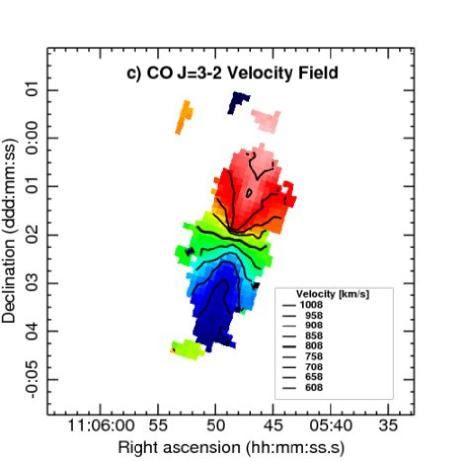
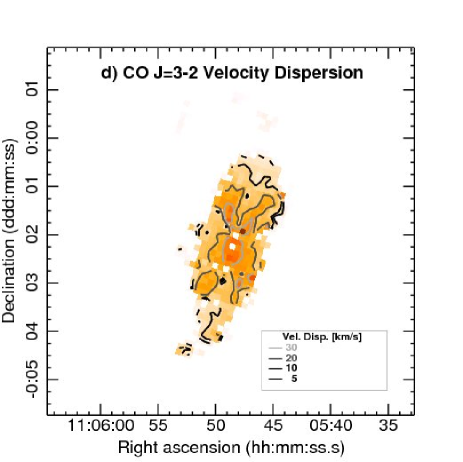
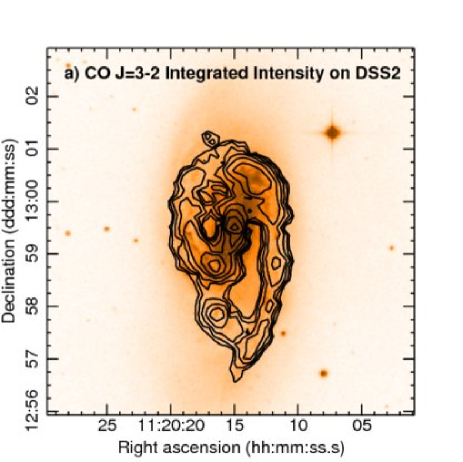
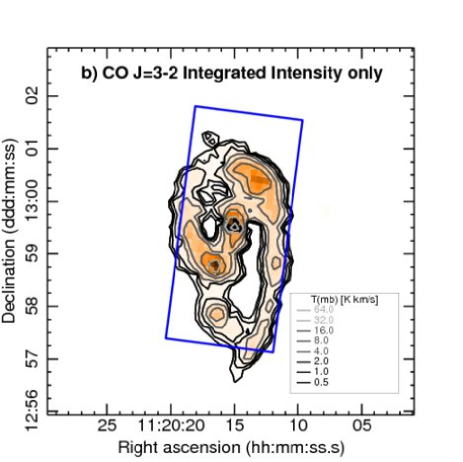
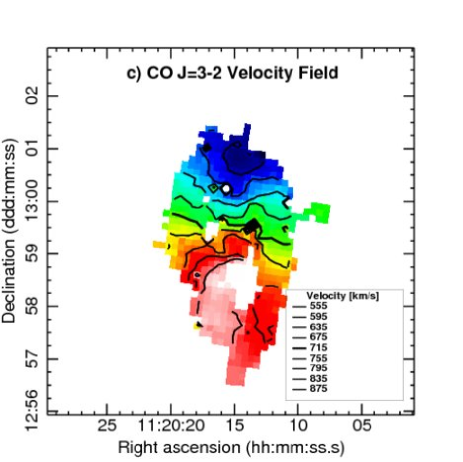
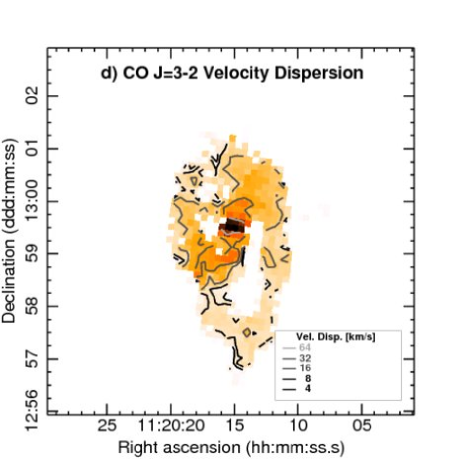
The 12CO =3-2 moment maps we obtained from our HARP-B raster scan mapping are shown in Figures 1 (NGC 628), 2 (NGC 3521), and 3 (NGC 3627). Each figure contains four panels, showing the integrated 12CO =3-2 intensity overlaid on the optical DSS ii (R band) image, the integrated 12CO =3-2 intensity by itself, the velocity field, and the velocity dispersion map. The second panel of each figure shows the target field for the survey in blue, a D25,maj/2 by D25,min/2 box, where theoretically we have complete sensitivity coverage to our target depth. In practice, signal-to-noise variations between receptors, and missing/flagged receptors in the array, make the sensitivity coverage of the field more complex. Additionally, the region with good sensitivity is slightly larger than the target field due to the over-scanned area (see Appendix A). At the adopted distances of the three galaxies, the 145 beam of the JCMT 12CO =3-2 observations gives us resolutions of 510, 750, and 660 pc for NGC 628, NGC 3521, and NGC 3627, respectively.
The integrated intensity maps of NGC 628 (Fig. 1a,b) show that the warm molecular gas detected in the NGLS 12CO =3-2 line observations is patchy, of relatively low intensity, and mostly follows the spiral arms of the galaxy. The center region shows neither a strong concentration nor a strong dip in the molecular gas. The few higher peaks in the map are mostly distributed along the spiral arms, the strongest at K km s-1 being 15 east of the galaxy center (though there are several others of similar strength). The total 12CO =3-2 luminosity for NGC 628 is K km s-1 pc2.
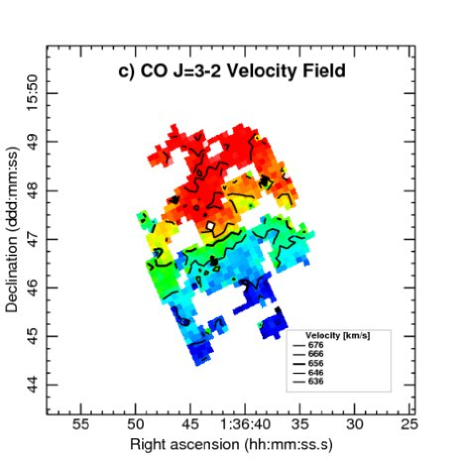
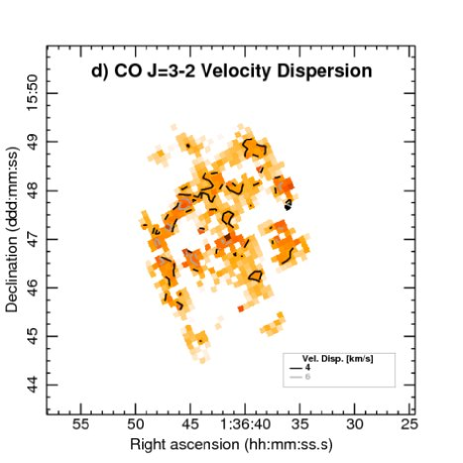
NGC 628 is almost face on (inclination of about 7°, Walter et al., 2008), so the velocity field (Fig. 1c) shows only a narrow velocity range across the galaxy (50 km s-1). As our target field only covers the center of the galaxy, the coverage is patchy, and the inclination is so low, we cannot tell from the 12CO =3-2 data alone if we have data far enough out to reach the flat portion of the rotation curve, though as we only map out to D25/2 that is unlikely. Fig. 1d shows the 12CO =3-2 velocity dispersion map (moment 2 map) for NGC 628. The velocity dispersion is generally low, around 2 to 6 km s-1, with the higher velocity dispersion around the integrated 12CO =3-2 intensity peaks. The median velocity dispersion is 3.2 km s-1. These velocity dispersions are similar to the internal velocity dispersions seen in giant molecular clouds (GMC) in the Milky Way (Solomon et al., 1987). This suggests that the main contribution to velocity dispersion in the molecular gas for NGC 628 is internal dispersion within GMCs, rather than inter-cloud velocity differences. Alternatively, Combes & Becquaert (1997) also looked at the velocity dispersion of molecular gas in this galaxy, using IRAM 30 m telescope observations at 12CO =1-0 and 12CO =2-1 (23″ and 12″ resolution, respectively), and finding a near constant velocity dispersion as a function of radius of 6 km s-1 they conclude that cloud-cloud velocity dispersions dominate over internal dispersions. Without resolving the clouds themselves however we cannot tell for certain which components contribute most to the velocity dispersion measured within our beam. We would expect contributions from the rotation velocity gradient across our beam to be minimal beyond the center of the galaxy given the low inclination.
The integrated 12CO =3-2 intensity maps for NGC 3521 (Fig. 2a,b) show that its molecular gas is concentrated towards the inner regions of the optical disk, with a slight central dip forming a torus-like structure in the inner 1′ (3 kpc along the major axis). The high inclination angle of the galaxy makes it difficult to identify other structures within the molecular gas disk. The detected 12CO =3-2 disk extends along the major axis out to a radius of 130″, or 6.7 kpc, which is about one third of the optical radius . There are two peaks in the map on either side of the central dip (30″ from the center along the major axis in both directions) that are of about equal intensity in our 12CO =3-2 data, with the northern peak at K km s-1 and the southern at K km s-1. The total 12CO =3-2 luminosity for NGC 3521 is K km s-1 pc2.
The 12CO =3-2 velocity field for NGC 3521 (Fig. 2c) shows the general characteristics of a moderate to highly inclined rotating disk galaxy (the well known spider diagram pattern). Over the region where we detect 12CO =3-2 there do not appear to be any significant distortions in the velocity field. A brief examination of position-velocity slices through the cube for NGC 3521, along and parallel to the major axis, showed no significant detections of molecular gas with anomalous velocities, and that the rotation curve appears to flatten out within the radius of the disk detected in 12CO =3-2. The former suggests that the 12CO =3-2 velocity field is tracing the bulk motions of the gas disk. Fig. 2d shows the 12CO =3-2 velocity dispersion map (moment 2 map) for NGC 3521. It has a distinctive ‘X’ pattern through the center of the galaxy (best seen with the 20 km s-1 contour), which seems to be aligned with the velocity field contours. The highest velocity dispersions are seen towards the center of the galaxy, where the velocity field contours are spaced closest together. Given the high inclination of this galaxy, these may indicate that the velocity dispersion map is partially indicating regions where there is a large component of the rotational velocity gradient in the direction of the line of sight. The median velocity dispersion is 15.0 km s-1.
The integrated intensity maps of NGC 3627 (Fig. 3a,b) shows a distinct pattern of an inclined barred spiral. Molecular gas is found throughout much of the optical disk, with 12CO =3-2 detected right up to and sightly beyond the edges of our target field (the blue box in the upper right panel). It is mostly constrained to the bar and along the spiral arms, with no gas detected in the intervening regions. The spiral arms are asymmetrical in 12CO =3-2, with the arm that extends to the south from the western side of the galaxy at least 50% longer than the arm that extends north from the eastern side. The center and the ends of the bar have particularly strong concentrations of 12CO =3-2, with the peak in the bar/galaxy center at K km s-1. The peak intensity at the southern bar end is K km s-1, while in the northern bar end the peak is at K km s-1. The total 12CO =3-2 luminosity for NGC 3627 is K km s-1 pc2.
Fig. 3c shows the 12CO =3-2 velocity field for NGC 3627. The field shows some distortion between the inner bar and spiral arms, with the gradient of the field in the inner bar region aligned close to north-south (the receding side is 180° East of North), while further out the alignment is closer to 170°. This resembles streaming motions associated with spiral arms (Bosma, 1981; Knapen et al., 1993). Additionally, the kinematical major and minor axes are not orthogonal, characteristic of oval distortions (such as bars) or warping (Bosma, 1981). Fig. 2d shows the 12CO =3-2 velocity dispersion map (moment 2 map) for NGC 3627. The velocity dispersion is moderate to low in the spiral arms (7 to 20 km s-1), but much higher in the bar region, particularly in the center of the galaxy where the velocity dispersion is over 80 km s-1, though there is a large velocity gradient across the 145 JCMT beam in this region. The median velocity dispersion is 13.0 km s-1.
4 The 12CO =3-2/=1-0 Ratio and the Distributions of Molecular and Atomic Gas
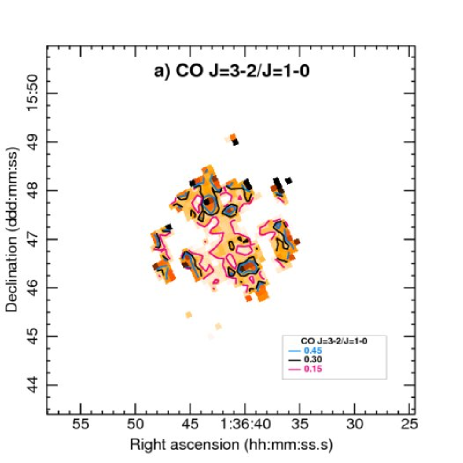
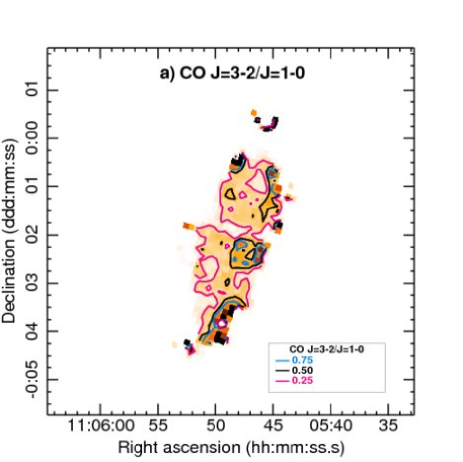
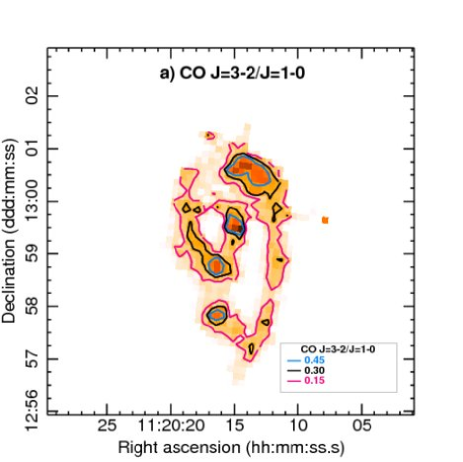
The 12CO =3-2/=1-0 ratio is an important indicator of the portion of warm/dense molecular gas relative to the total molecular gas. As noted in Paper I it is also important in the calculation of the molecular gas mass, as to date conversions from CO luminosity have been done with the 12CO =1-0 line. We calculated 12CO =3-2/=1-0 maps for all three galaxies by the same method as Paper I, taking the NGLS 12CO =3-2 integrated intensity maps (in main beam temperature) and dividing by the available 12CO =1-0 maps of the same resolution (Nobeyama maps for NGC 3521 and NGC 3627, and the smoothed BIMA SONG 12CO =1-0 maps for NGC 628). The resulting 12CO =3-2/=1-0 ratio maps are shown in the upper left panels of Figs. 4, 5, and 6, for NGC 628, NGC 3521, and NGC 3627, respectively.
The 12CO =3-2 detection in NGC 628 is relatively weak compared to the other two sources, and the rapid drop off in the BIMA SONG mapping sensitivity beyond 15 (3.2 kpc) from the galaxy center reduces the useful area of the 12CO =3-2/=1-0 ratio map. Within the useful region, the gas distribution traced by both 12CO transitions follow each other closely. The 12CO =3-2/=1-0 ratio is generally low (mostly between 0.15 and 0.45) with the exception of a few peaks (some of which may be due to poor sensitivity in one tracer or the other). It is difficult to discern a trend with the limited coverage we have for this galaxy. For NGC 3521 the 12CO =3-2/=1-0 ratio map shows that throughout most of the galaxy the 12CO =3-2/=1-0 is in the range 0.25 to 0.5. In the center of the galaxy, where the NGLS 12CO =3-2 map shows a strong dip (see Fig. 2), and the Kuno et al. (2007) 12CO =1-0 also shows a central depression, the ratio drops below 0.25. Just to the southwest of the center the ratio peaks over 0.75, with some stronger peaks around the edges of the map. For NGC 3627, the general 12CO =3-2 structure matches well with both the BIMA SONG and Kuno et al. (2007) 12CO =1-0 maps of the galaxy, though there is more inter-arm gas in those maps than in the NGLS map. The 12CO =3-2/=1-0 ratio is low throughout most of the galaxy where we detect 12CO =3-2, only going above 0.45 in four locations (the center, the bar ends, and the concentration to the south of the southern bar end). The median 12CO =3-2/=1-0 ratios for NGC 628, NGC 3521, and NGC 3627 are 0.35, 0.33, and 0.18, respectively (for pixels where the 12CO =3-2 signal-to-noise is 3 or greater).
The standard method to calculate the column density of H2 gas using 12CO =1-0 as a tracer is to adopt a CO-to-H2 conversion factor (). As in Paper I we are adopting a value of cm-2 (K km s-1)-1 (Strong et al., 1988). In order to calculate the molecular gas mass from 12CO =3-2 measurements we need to adopt a 12CO =3-2/=1-0 value to change our 12CO =1-0-to-H2 conversion factor in to a 12CO =3-2-to-H2 conversion factor. The choice of this conversion ratio depends strongly on where we assume the molecular gas that we are tracing with 12CO =3-2 is located. Our assumption is that 12CO =3-2 traces pre-star formation molecular gas that is in general denser than 12CO =1-0. In Paper I we used a constant ratio of 0.6, representative of ratios seen in Galactic and extragalactic GMCs (based on the results of Leroy et al., 2008; Wilson et al., 1999; Israel, 2009a, b), essentially focusing on the molecular gas closest to the star formation (unlike the above median 12CO =3-2/=1-0 ratios for the three galaxies, which are more representative of the global molecular gas population). The limitation of this assumption is that the cause of the differences between different molecular gas tracers is degenerate, thus higher 12CO =3-2 values could indicate warmer rather than denser gas (as found by Oka et al., 2007). It has also been suggested (Tosaki et al., 2007) some 12CO =3-2 emission may be due to post-star formation heating of the molecular gas. In this paper, where we calculate an H2 mass using this assumption (12CO =3-2/=1-0 = 0.6) we will refer to ‘H2 (CO =3-2).’
If we instead wish to examine the more diffuse general molecular gas content in a galaxy then the available 12CO =1-0 data is a more appropriate tracer. So in cases where we require the total gas content we use this instead, using the adopted value to obtain the H2 gas column density, and refer to the ‘H2 (CO =1-0)’ gas mass. As the only 12CO =1-0 observations we have for NGC 628 come from BIMA SONG, and given the limitations of those data described above (see §2.2), we have only used parameters needing H2 (CO =1-0) for the other two galaxies in our later analysis.
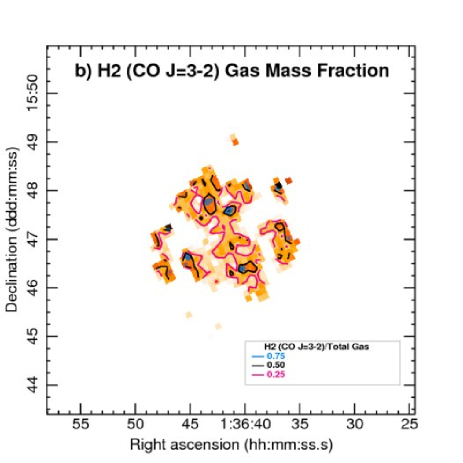
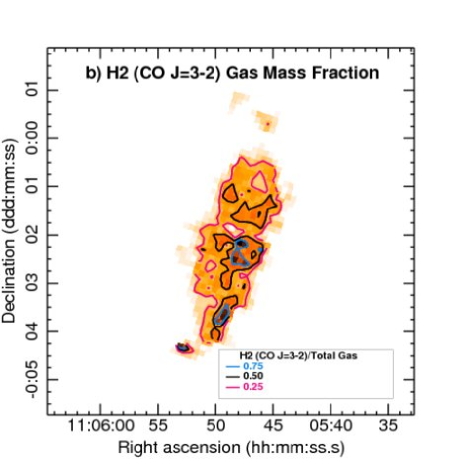
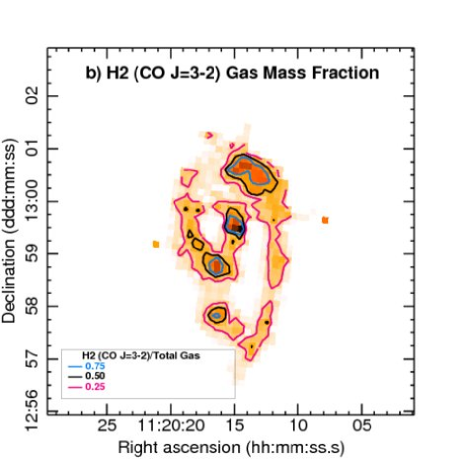
In order to compare the dense molecular gas content to the total gas (H i plus H2 [CO =1-0]), we produced maps of the H2 (CO =3-2) gas mass surface density fraction ( divided by ), where the H2 surface densities were derived as above, and the H i surface density came from the THINGS integrated H i intensity maps smoothed to the JCMT beam. The resulting H2 gas mass fraction maps are shown in the upper right panel of Figs. 4, 5, and 6. Since is not in the denominator for this calculation it should be noted here that there are some pixels in these maps where this fraction is greater than 1.
As for the 12CO =3-2/=1-0 map of NGC 628, the H2 (CO =3-2) gas mass fraction map for this galaxy is limited by the BIMA SONG 12CO =1-0 map. The THINGS moment maps for NGC 628 show the H i intensity dips in the central 1′ (2.1 kpc) and there is little correlation between the 12CO =3-2 and H i in this area; beyond this radius they both trace the spiral structure (though this goes beyond the useful area of the 12CO =1-0 data). In the limited regions where we have all three gas tracers we find the dense molecular gas is only the dominant gas phase at a few peaks in the map. It is difficult to draw any conclusions from this map given the limited overlap between the three gas tracers.
In NGC 3521, the THINGS H i map shows a larger central depression, that encompasses most of the region with molecular gas detections. Molecular gas in general dominates the inner regions of the galaxy (out to 15 from the center along the major axis, or about 4.7 kpc at the adopted distance). Dense/warm molecular gas appears to be the dominant gas phase in several large patches of the gas disk, with a strong peak just south of the galaxy center where the dense molecular gas is more than three quarters of the total gas along the line-of-sight, and a similar region further out to the south. The most notable location with little dense molecular gas is a small region slightly north of the center, in approximately the same location we see a dip in the 12CO =3-2 distribution map (Fig. 2b).
Molecular gas is in general the dominant form of gas in NGC 3627, in particular throughout the bar and most of the spiral arms. The 12CO =3-2 detections are particularly strong at four peaks; in the central starburst region, at both ends of the bar, and a peak to the south between one of the bar ends and the south-western arm. Atomic gas on the other hand is mostly absent in the bar except at the north-western end, but traces most of the spiral arms. As a result the map shows dense/warm gas is the dominant gas phase at the four peak locations (in the case of the central starburst region overwhelmingly so), but not throughout the rest of the bar and spiral arms. The map strongly resembles the 12CO =3-2/=1-0 map for this galaxy, indicating that cooler and/or lower density molecular gas is the dominant phase outside the four peaks.
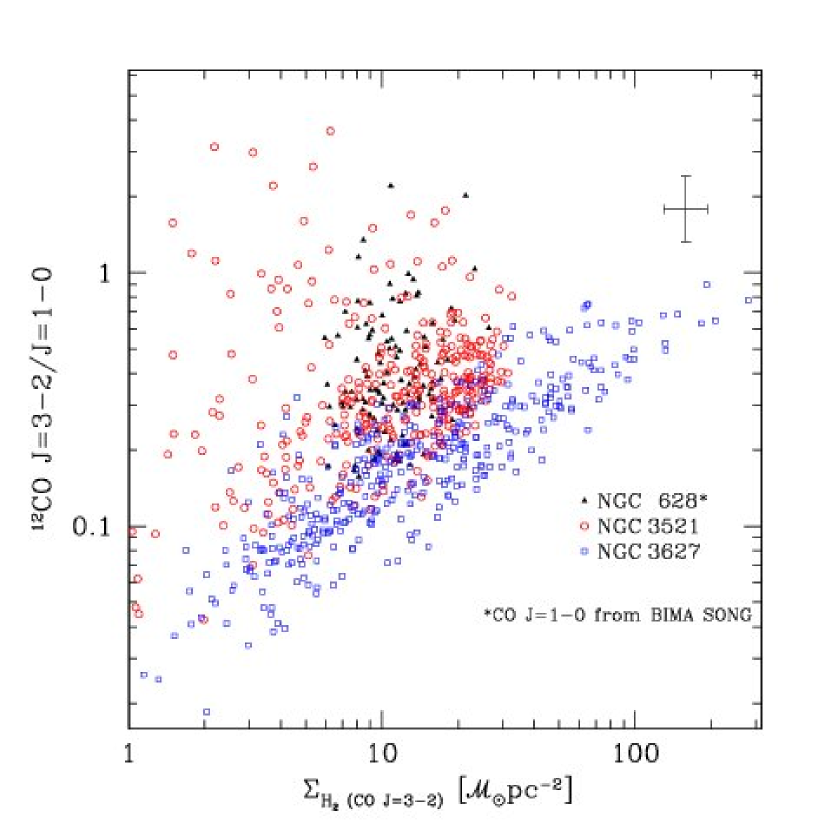
Fig. 7 shows the pixel-to-pixel variation in the 12CO =3-2/=1-0 ratio versus H2 gas surface density (from 12CO =3-2, inclination and helium corrected) for all three galaxies. Throughout the vast majority of all three galaxies the ratio is less than 0.5. There is a discernible trend for NGC 3627, with higher surface density regions having higher ratios. This trend is less obvious for NGC 3521, and not clear at all from the limited NGC 628 data. In general, while regions with low H2 (CO =3-2) gas surface density can have a wide range in 12CO =3-2/=1-0, regions of high H2 (CO =3-2) gas surface density only show high ratios. This fits with our assumption that 12CO =3-2 tends to trace warmer, denser regions than 12CO =1-0. Given that starburst regions in galaxies are often observed to have higher 12CO =3-2/=1-0 ratios (Meier et al., 2001), it is somewhat surprising that the starburst galaxy NGC 3627 generally has the lowest ratio of these three galaxies at a given molecular gas surface density.
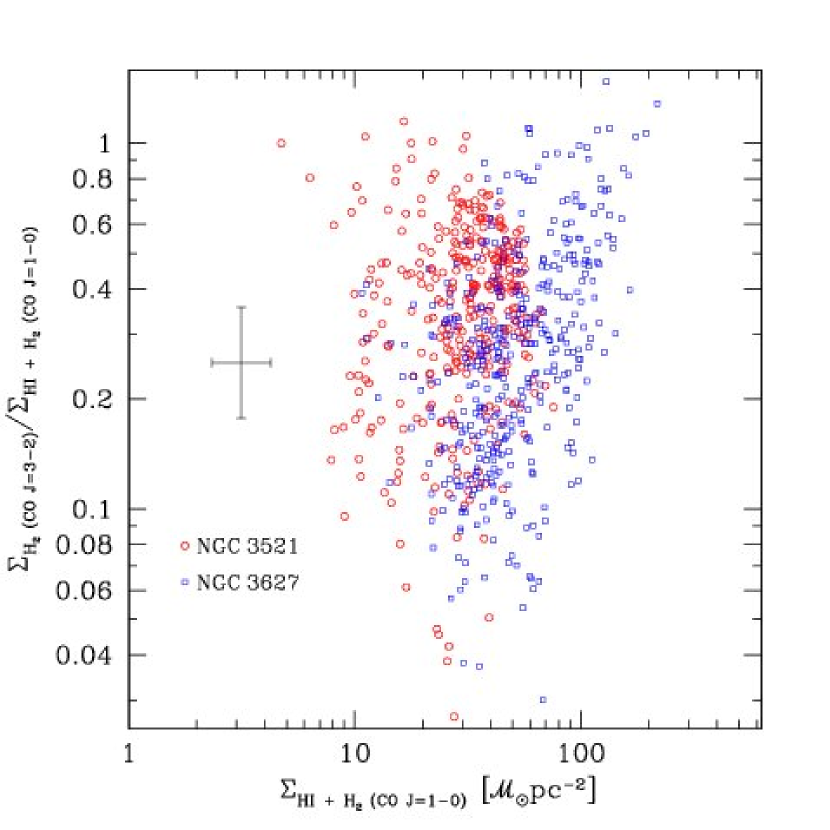
Fig. 8 shows the pixel-to-pixel variation in the H2 (CO =3-2) gas surface density fraction, , versus the total gas surface density (inclination and helium corrected) for the two galaxies where we have Kuno et al. (2007) 12CO =1-0 maps available. Only pixels where the signal-to-noise for the NGLS 12CO =3-2 data is greater than 3 were included. The absence of points below 10 pc-2 is most likely a result of the detection limits of the three surveys, the signal-to-noise cutoff that we subsequently applied, and being biased towards pixels where 12CO =3-2 was detected in the NGLS. With the large scatter in the points it is difficult to discern any trend between the global gas surface density and the fraction of dense/warm molecular gas, and in general the plot suggests there is no relation between gas surface density and gas composition. This may be consistent with results such as Leroy et al. (2008) with regards to the influence general ISM gas densities have on denser structures more closely associated with star formation, provided we can confirm it with measurements from other galaxies at a later stage.
5 Gas Dynamics
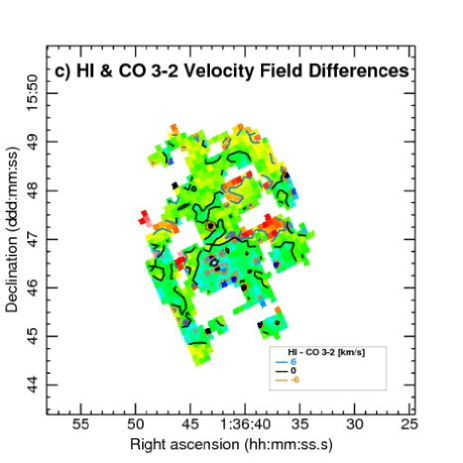
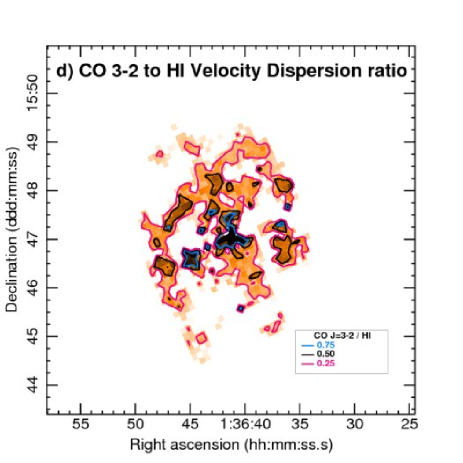
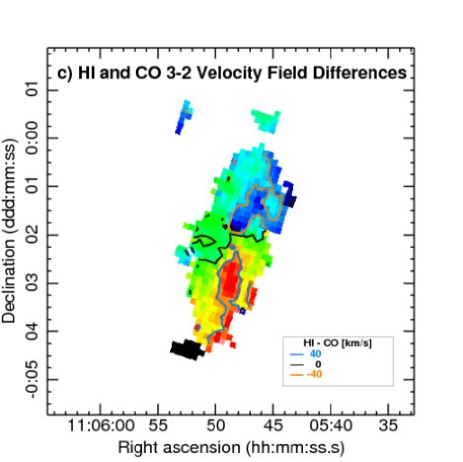
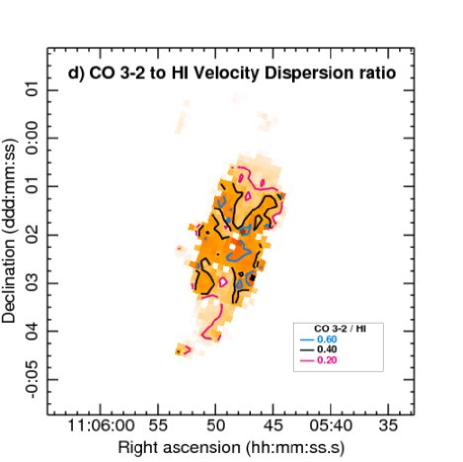
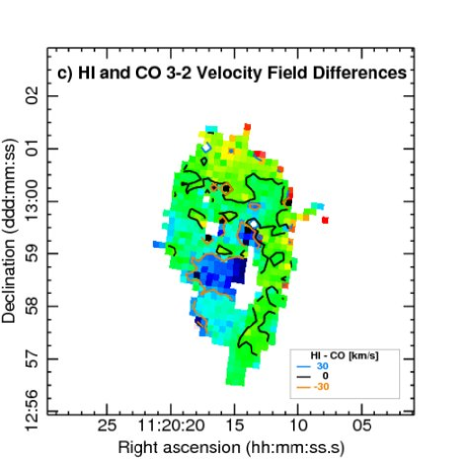
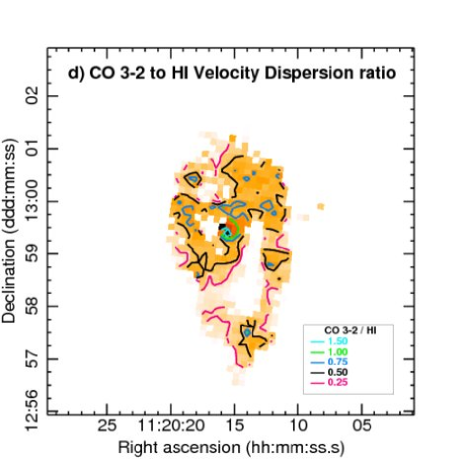
We compared the NGLS 12CO =3-2 velocity fields and velocity dispersion maps for our three galaxies to the THINGS H i velocity fields and velocity dispersion maps (Walter et al., 2008). The THINGS H i data cubes were first convolved with a Gaussian beam to the resolution of the JCMT 12CO =3-2 maps (145), and then collapsed into moment maps, as described in § 2. To compare velocity fields we simply subtracted the NGLS 12CO =3-2 fields from the THINGS H i fields. To compare velocity dispersions we divided the NGLS 12CO =3-2 velocity dispersion maps by the H i velocity dispersion maps to get the ratio of the velocity dispersions. The resulting velocity field difference and velocity dispersion ratio maps are shown in the lower two panels of Figs. 4, 5, and 6. It should be noted that our linear resolution elements for the three galaxies are of the order of several hundred parsecs, relatively large compared to the internal structures of the galaxies, and therefore the gas traced by H i and 12CO =3-2 at the same location in the maps may be physically some distance apart.
Over the regions in NGC 628 where we detect 12CO =3-2, the velocity field differences are generally small (absolute differences almost entirely km s-1) in comparison to the other two galaxies, no doubt in part due to the low inclination of this galaxy (and hence small component of the rotation along the line of sight). There does appear to be a slight gradient across the field, with the northern (receding) end of the galaxy having H i velocities marginally greater than 12CO =3-2 velocities, and the southern (approaching) end showing slightly lower H i velocities than 12CO =3-2 velocities. The extent to which this gradient is real is not clear, and would require a more extensive tracer of the molecular gas to expand the area where we can compare the velocities over the very extended H i disk. The 12CO =3-2 velocity dispersion is significantly below that of the atomic gas throughout the entire region where we detect 12CO =3-2, with few regions above 50% of the H i velocity dispersion (the median ratio of the dispersions is 34%). In general we expect the molecular gas to have lower velocity dispersions because it is confined to a colder, thinner disk.
There are large regions of disagreement between the atomic and molecular velocity fields for the highly inclined galaxy NGC 3521, with peak differences of up to km s-1 in the regions to the north and south of the galaxy center. Unlike the gradient seen for NGC 628, the differences appear to be more clump-like, and are in the opposite sense to that galaxy (higher 12CO =3-2 velocities on the receding side, and vice versa). Examination of a position-velocity slice along the major axis through the THINGS H i cube for NGC 3521 show significant quantities of low velocity atomic gas. This gas following a non-circular rotation pattern, which is not detected in the 12CO =3-2 data cube, appears to account for the large differences in the H i and 12CO =3-2 velocity fields. de Blok et al. (2008, and references therein) discuss removal of such low velocity gas from the moment maps for THINGS, so that velocity fields best represent the rotational pattern of the galaxy. Presumably, if we compared an H i velocity field that better reflected the circular rotation with our 12CO =3-2 velocity field, there would be fewer large differences. Fig. 5d shows the 12CO =3-2 to H i velocity dispersion ratios for NGC 3521. The 12CO =3-2 velocity dispersion is again much lower than for the atomic gas, of similar order to NGC 628. The median ratio of the velocity dispersions is 30%, though again these velocity dispersions ratios are likely affected by the non-circular H i gas and may be more similar if only H i in circular rotation were used.
Fig. 6c shows the velocity field differences for NGC 3627. The molecular and atomic velocity fields for this galaxy are well matched, with the exception of the region around the nucleus and the southern end of the bar where the 12CO =3-2 velocities are over 30 km s-1 higher in some parts. This is the receding side of the galaxy, though it is notable that this region has relatively little H i emission. The bar would also strongly affect the dynamics in this region. Fig. 6d shows the 12CO =3-2 to H i velocity dispersion ratios for NGC 3627. The 12CO =3-2 velocity dispersion is closer to the H i velocity dispersions for this galaxy compared to the others, though most of the galaxy still has 12CO =3-2 velocity dispersions % of the H i values. The median ratio of the velocity dispersions is 42%. Most notable is the nucleus where the 12CO =3-2 velocity dispersion is in fact greater than H i values. As noted in § 4 the molecular gas dominates the central starburst region, making up almost all of the gas (95% to 99%) at the nucleus, so it is likely that the atomic velocity dispersion here is based on low signal-to-noise data.
6 Star Formation
6.1 Star Formation Rate and Gas Depletion Time
To make a comparison between the present star formation rate (SFR) and our measurements of dense/warm molecular gas derived from NGLS 12CO =3-2 observations we have produced maps of the rate of star formation from the available ancillary data. We followed the same procedures as Paper I to produce SFR maps, and maps of the gas depletion time for H2 (CO =3-2). Star formation rates were derived from the available SINGS H and 24 m maps using the procedure derived by Calzetti et al. (2007, eqn. 7),
| (1) |
where the H and 24 m are both in erg s-1, and is expressed as . This calculation assumes an initial mass function (IMF) consisting of two power laws, unlike the similar derivation in Kennicutt et al. (1998a) that uses a Salpeter IMF. By using both H and 24 m data we account for both unobscured and obscured star formation within the galaxies.
The gas depletion time, which is also the inverse of the star formation efficiency (SFE), is simply the mass of the gas in question divided by star formation rate. This assumes that the gas involved will eventually be used up in the process of forming stars, and that no other process is replenishing this gas. While these may hold somewhat for the total gas population over the lifetime of the galaxy (if there is no external influence), they are unlikely to be the case for the dense/warm molecular gas we trace with 12CO =3-2. If we are only considering how quickly the current supply of gas is being consumed for star formation, and not the longer term implications of when that gas might run out, this should not be a concern. Using our calculation for the dense/warm molecular gas mass from the NGLS 12CO =3-2 maps (H2 [CO =3-2]), we have produce maps of the depletion time of the gas presumably closest to the star formation.
The maps of SFR and H2 (CO =3-2) gas depletion time for NGC 628 are shown in Fig. 9. Star formation in this galaxy appears to be mostly concentrated around the spiral arm structure. In the center of the galaxy the SFR is generally lower compared to the sites of strong star formation in the surrounding arms. Accordingly this region has a relatively long gas depletion time (1 Gyr) in comparison to much of the rest of the galaxy, though some sites along the arms have similar depletion times.
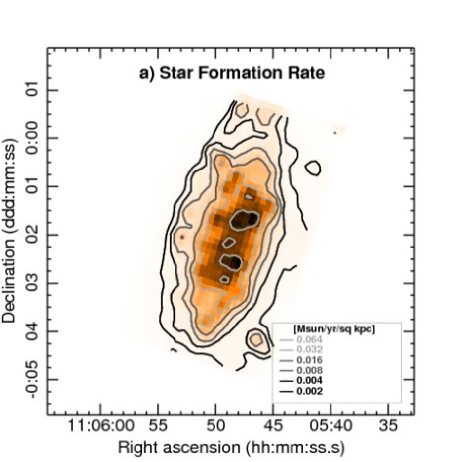
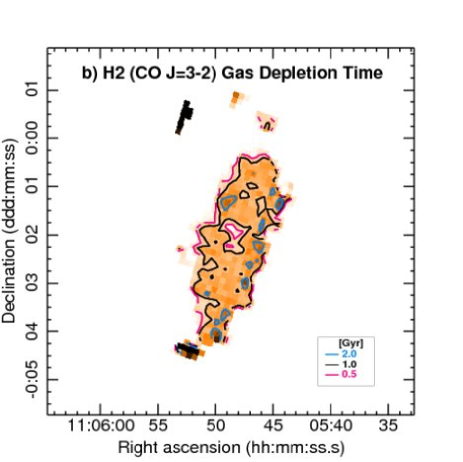
Fig. 10 shows the SFR and H2 (CO =3-2) gas depletion time maps for NGC 3521. Star formation appears to be strongly concentrated in the center of this galaxy, though there are likely strong projection effects in this near edge-on galaxy. The strongest SFR peaks are in the inner 1′ or so (3 kpc), the same region in the inner parts of the 12CO =3-2 intensity map that shows a slight depression. This distribution is reflected in the gas depletion time map, where the depletion time in the center is less than 0.5 Gyr in some places, whereas some surrounding regions have longer times of 1-1.5 Gyr. Otherwise the depletion times for dense H2 gas in NGC 3521 are relatively uniform at 1.00.5 Gyr.
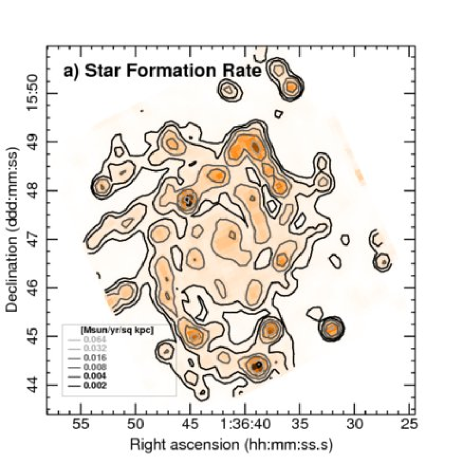
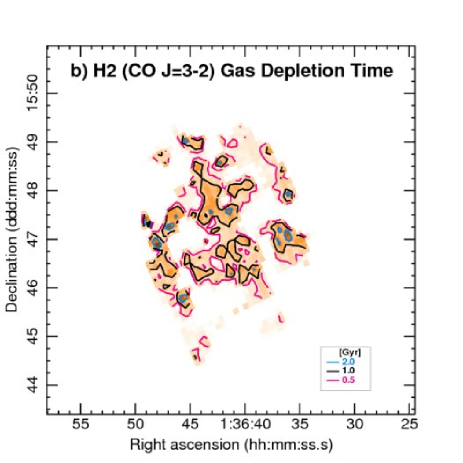
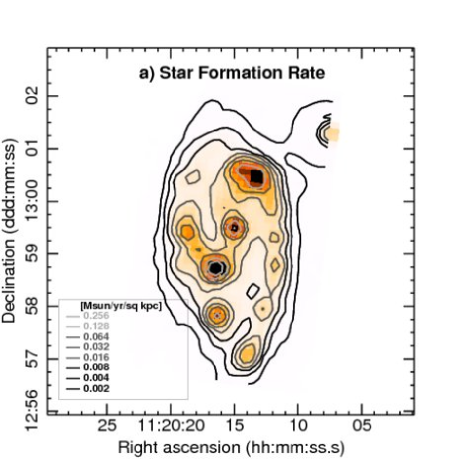
Fig. 11 shows the SFR and H2 (CO =3-2) gas depletion time maps for NGC 3627. There is intense star formation activity at both ends of the bar in this galaxy, as well as in the center of the bar. Other sites of strong star formation are scattered along the spiral arms. What appears to be a star formation peak showing up on the north-western corner of the field, outside the region where we see 12CO =3-2 and other gas tracers, is not related to NGC 3627 but is an artifact from an over-exposed foreground star on the H image. The gas depletion time map shows that throughout the spiral arms the depletion time is similar to the other two galaxies (2 Gyr). However, in the middle of the bar around the central starburst region, despite the strong star formation here, the depletion time rapidly lengthens due to the high surface density of H2 (CO =3-2) here, and is over 4 Gyrs in the center pixel.
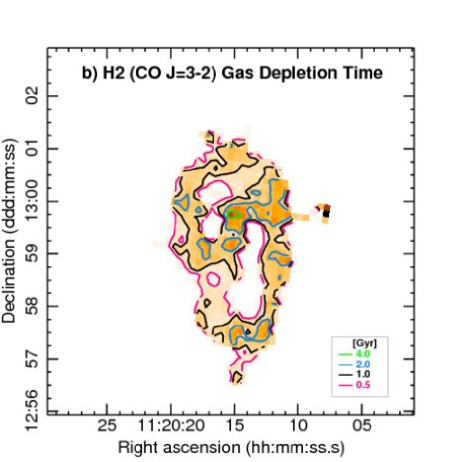
With the exception of regions like the center of NGC 3627, the typical H2 (CO =3-2) gas depletion times throughout all three galaxies is of the order of 1 Gyr. Median gas depletion times are 1.1 Gyr for NGC 628, 1.3 Gyr for NGC 3521, and 1.2 Gyr for NGC 3627 (mean values are 1.2 Gyr, 1.8 Gyr, and 1.4 Gyr, respectively). These are similar to the mean global gas depletion times found for three of the Virgo spiral galaxies studied in Paper I (1.1 to 1.7 Gyr). As we discussed in that paper, these times are comparable to those found for the spiral galaxies studied in Leroy et al. (2008) and Bigiel et al. (2008), but much shorter than a Hubble time, though as already mentioned they should not be interpreted as the time that the fuel for star formation will be exhausted. The relative consistency of the global gas depletion times for dense/warm molecular gas between spiral galaxies with very different structures, gas composition, and environment is likely more an indication of the transitional nature of such gas in spirals rather than the properties of the galaxy itself.
6.2 Star Formation Efficiency Relationships
Using the H i data from THINGS and other ancillary data from related surveys (SINGS, 12CO =2-1 from HERACLES, and GALEX UV observations), Leroy et al. (2008) have performed an extensive analysis of the star formation efficiency within a sample of nearby galaxies. This included examinations of various star formation laws, such as the well know Schmidt-Kennicutt law (Kennicutt et al., 1998a, b). In Fig. 12 we have shown two plots based on the SFE versus plots shown in Leroy et al. Fig. 5. We have reproduced these plots for our galaxies on a pixel-to-pixel basis (azimuthally smoothed data are used in Leroy et al., 2008). For reference we have included the same lines shown in Leroy et al. in both panels, marking the H i-to-H2 transition surface density in spirals (vertical dotted line at pc-2, only relevant where H i is included), and the relation SFE (an approximation to the Schmidt-Kennicutt star formation law).
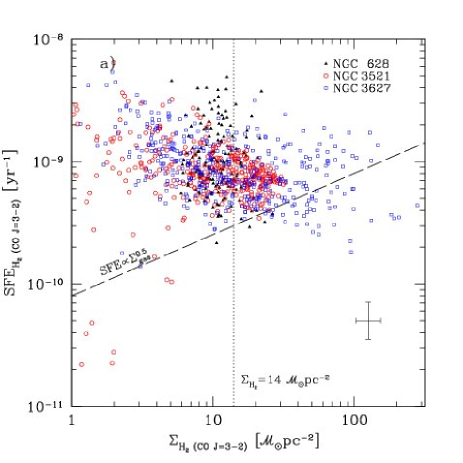
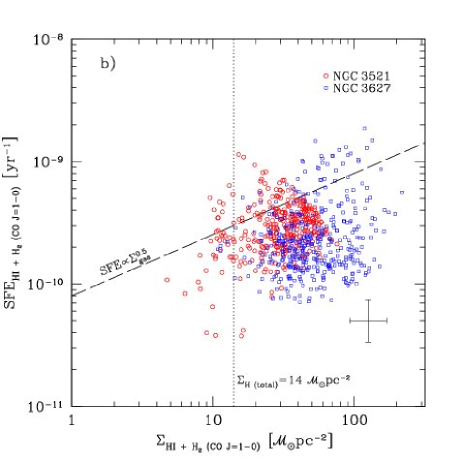
The left panel (Fig. 12a) shows the H2 (CO =3-2) gas star formation efficiency (star formation rate per unit of dense H2 gas) versus the H2 (CO =3-2) gas surface density for all three galaxies. The H2 (CO =3-2) gas surface density used in both values was estimated using the assumption for dense/warm molecular gas mentioned earlier (12CO =3-2/=1-0 = 0.6), and hence we are only looking at the efficiency of star formation in the molecular gas regions most closely associated with star formation. The right panel (Fig. 12b) on the other hand show the behavior of the more global gas population. It shows the total gas (H i H2 [CO =1-0]) star formation efficiency versus total gas surface density (). Hence much of the gas traced in this plot is much less directly linked to star formation than in the first panel (and does not use our NGLS 12CO =3-2 data), though the plot is more directly comparable to the results of Leroy et al. (2008).
Both plots have large scatter and it is difficult to discern clear trends in either. The left panel shows that the star formation efficiency of H2 (CO =3-2) gas is relatively high (as indicated in the previous section by the short gas depletion times). The efficiency is relatively constant with gas density, and if anything becomes less efficient when the H2 (CO =3-2) gas surface density is higher, and it does not follow the line of the Schmidt-Kennicutt law. However, given the order of magnitude peak-to-peak scatter of the distribution it is difficult to conclude whether the efficiency is constant or declining with gas density. In the right panel we see the star formation efficiency is about an order of magnitude lower than the first plot, as might be expected when the total gas content is taken into account. The absence of points at lower densities is likely due to the bias towards regions where 12CO =3-2 was detected. There is no clear trend in this plot due to the large scatter and narrow range of gas surface density. Overall there is little evidence that either plot is following a Schmidt-Kennicutt star formation law.
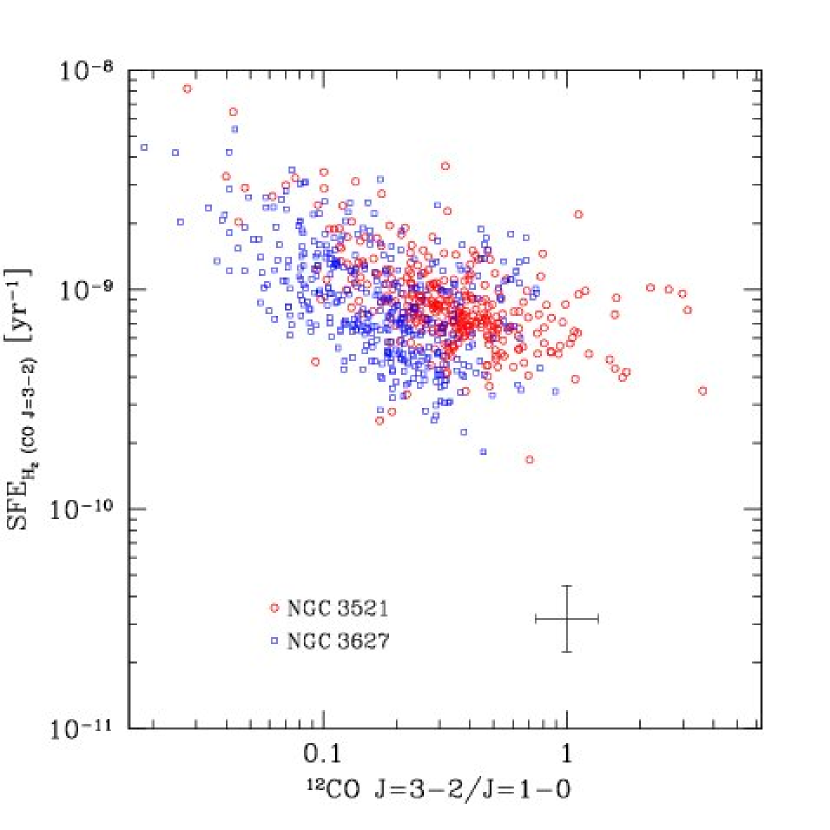
Fig. 13 shows a plot of SFE versus the 12CO =3-2/=1-0 ratio for the two galaxies where we have Kuno et al. (2007) 12CO =1-0 maps available. The scatter is again large but maybe a bit tighter than the previous plots, and for the most part the SFE appears to be flat or slightly declining with increasing 12CO =3-2/=1-0. Muraoka et al. (2007) also looked at the relationship between SFE and 12CO =3-2/=1-0 for M 83 (NGC 5236), and found a clear trend for higher SFE at higher 12CO =3-2/=1-0 ratios. Their azimuthally smoothed data only cover a small range in 12CO =3-2/=1-0 compared to our pixel-to-pixel measurements, and their SFE range is close to our scatter in that value, but our results do not seem to support this trend. The most likely explanation from our plots is that the star formation efficiency in theses two galaxies is independent of the 12CO =3-2/=1-0 ratio.
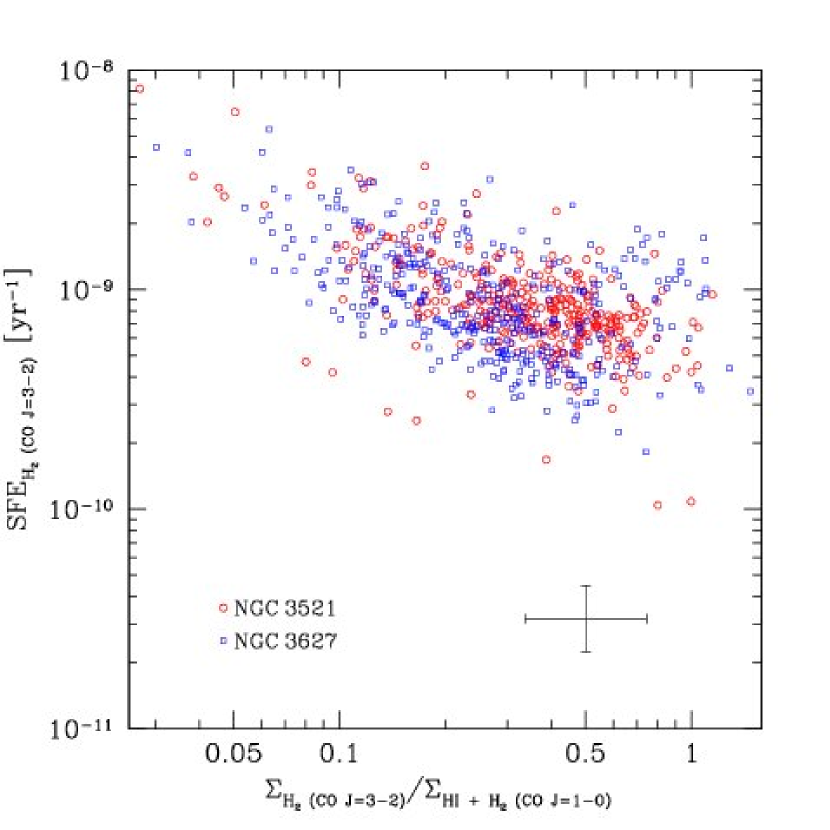
Fig. 14 shows a plot of SFE versus the H2 (CO =1-0) gas mass surface density fraction, , for the two galaxies where we have Kuno et al. (2007) 12CO =1-0 maps available. As with the previous plots there is a large scatter in the points close to a magnitude in star formation efficiency. But as with the previous plot, and the first panel of fig. 12, as the surface density of the dense/warm molecular gas increases the star formation efficiency remains constant or becomes less efficient. This could indicate that in regions of dense and/or warm molecular gas the efficiency is either independent of the gas density, or become slightly less efficient as the density increases. Investigations with larger samples with extensive multiwavelength data are needed to confirm if either is the case.
7 Conclusions
We have used the JCMT to map the 12CO =3-2 emission from three non-cluster spiral galaxies, completed as part of the ongoing Nearby Galaxies Legacy Survey. These galaxies are all included in the SINGS survey (Kennicutt et al., 2003), and as such have excellent published data sets covering their dust and ISM properties. Combined with the new NGLS 12CO =3-2 data, these data set also allow us to probe a range of galaxy properties including differences in the distribution of 12CO =3-2, 12CO =1-0, and H i emission, galaxy dynamics, and relationships between star formation rates and warm/dense molecular gas.
These galaxies all have moderate to strong 12CO =3-2 detections over large areas of the fields observed by the survey, showing resolved structure and dynamics in their warm/dense molecular gas disks. We find some large differences between the 12CO =3-2 and H i velocity fields of some galaxies, in particular NGC 3521. These differences appear to be due to the presence of large quantities of low velocity H i gas in the THINGS data cubes.
Global gas depletion times for dense/warm molecular gas in these galaxies, as well as those examined in Paper I and other surveys, are relatively consistent with each other (in the range 1 to 2 Gyr). This is despite very different structures, gas compositions, and environments. This is likely more an indication of the transitional nature of such gas in spirals rather than the properties of the galaxy itself.
Similar to the results from the Leroy et al. (2008), we do not see any correlation of the star formation efficiency with the gas surface density, with at best a slight decline in efficiency in high gas density regions traced by 12CO =3-2. Additionally, we find that the star formation efficiency of the dense/warm molecular gas traced by 12CO =3-2 is flat or slightly declining as the 12CO =3-2/=1-0 ratio increases, in contrast to the correlation found in the study by Muraoka et al. (2007) into the starburst galaxy M83. A similar weak trend is also seen when examining star formation efficiency versus the H2 (CO =1-0) gas mass surface density fraction. All three of these could indicate that in regions of dense and/or warm molecular gas the efficiency is either independent of the gas density, or become slightly less efficient as the density increases.
References
- Bigiel et al. (2008) Bigiel, F., Leroy, A. K., Walter, F., Brinks, E., de Blok, W. J. G., Madore, B., & Thornley, M. D., 2008, AJ, 136, 2846
- Bosma (1981) Bosma, A. 1981, AJ, 86, 1825
- Calzetti et al. (2007) Calzetti, D. et al. 2007, ApJ, 666, 870
- Chemin et al. (2003) Chemin, L., Cayatte, V., Balkowski, C., Marcelin, M., Amram, P., van Driel, W., Flores, H., 2003, A&A, 405, 89
- Combes & Becquaert (1997) Combes, F., & Becquaert, J.-F. 1997, A&A, 326, 554
- de Blok et al. (2008) de Blok, W. J. G., Walter, F., Brinks, E., Trachternach, C., Oh, S-H., & Kennicutt, R. C., Jr., 2008, AJ, 136, 2648
- de Vaucouleurs et al. (1991) de Vaucouleurs, G., de Vaucouleurs, A., Corwin, H. G., Buta, R. J., Paturel, G., & Fouqué, P., 1991, Third Reference Catalogue of Bright Galaxies, Springer, New York
- Freedman et al. (2001) Freedman, W. L., et al. 2001, ApJ, 553, 47
- Greve et al. (2005) Greve, T. R., et al. 2005, MNRAS, 359, 1165
- Helfer et al. (2003) Helfer, T. T., Thornley, M. D., Regan, M. W., Wong, T., Sheth, K., Vogel, S. N., Blitz, L., Bock, D. C.-J., 2003, ApJS, 145, 259
- Iono et al. (2009) Iono, D., et al. 2009, ApJ, 695, 1537
- Israel (2009a) Israel, F. P. 2009, A&A, 493, 525
- Israel (2009b) Israel, F. P. 2009, A&A, 506, 689
- Kamphuis & Briggs (1992) Kamphuis, J., & Briggs, F., 1992, A&A, 253, 335
- Karachentsev et al. (2004) Karachentsev, I. D., Karachentseva, V. E., Huchtmeier, W. K., & Makarov, D. I., 2004, AJ, 127, 2031
- Kennicutt et al. (1998a) Kennicutt, R. C., Jr., et al., 1998a, ARA&A, 36, 189
- Kennicutt et al. (1998b) Kennicutt, R. C., Jr., et al., 1998b, ApJ, 498, 541
- Kennicutt et al. (2003) Kennicutt, R. C., Jr., et al., 2003, PASP, 115, 928
- Kennicutt et al. (2008) Kennicutt, R. C., Jr., Lee, J. C., Funes, S. J., J. G., Sakai, S., & Akiyama, S., 2008, ApJS, 178, 247
- Knapen et al. (1993) Knapen, J. H., Cepa, J., Beckman, J. E., Soledad del Rio, M., & Pedlar, A. 1993, ApJ, 416, 563
- Kuno et al. (2007) Kuno, N., et al. 2007, PASJ, 59, 117
- Leroy et al. (2008) Leroy, A. K., Walter, F., Brinks, E., Bigiel, F., de Blok, W. J. G., Madore, B., & Thornley, M. D., 2008, AJ, 136, 2782
- Meier et al. (2001) Meier, D. S., Turner, J. L., Crosthwaite, L. P., & Beck, S. C. 2001, AJ, 121, 740
- Muraoka et al. (2007) Muraoka, K. et al. 2007, PASJ, 59, 43
- Oka et al. (2007) Oka, T., Nagai, M., Kamegai, K., Tanaka, K., & Kuboi, N. 2007, PASJ, 59, 15
- Regan et al. (2002) Regan, M. W., Sheth, K., Teuben, P. J., Vogel, S. N., 2002, ApJ, 574, 126
- Reuter et al. (1996) Reuter, H.-P., Sievers, A. W., Pohl, M., Lesch, H., & Wielebinski, R., 1996, A&A, 306, 721
- Schaye & Dalla Vecchia (2008) Schaye, J., & Dalla Vecchia, C., 2008, MNRAS, 383, 1210
- SINGS team (2007) SINGS Team, 2007, Spitzer Infrared Nearby Galaxies Survey Fifth Data Delivery User’s Guide, SSC, Pasadena
- Smith et al. (2003) Smith, H., et al., 2003, Proceedings of the SPIE, Vol. 4855, Millimeter and Submillimeter Detectors for Astronomy, ed. Phillips, T. G., & Zmuidzinas, J., 338
- Solomon et al. (1987) Solomon, P. M., Rivolo, A. R., Barrett, J., & Yahil, A. 1987, ApJ, 319, 730
- Strong et al. (1988) Strong, A. W., et al. 1988, A&A, 207, 1
- Tosaki et al. (2007) Tosaki, T., Miura, R., Sawada, T., Kuno, N., Nakanishi, K., Kohno, K., Okumura, S. K., & Kawabe, R. 2007, ApJ, 664, L27
- Walter et al. (2008) Walter, F., Brinks, E., de Blok, W. J. G., Bigiel, F., Kennicutt, R. C., Jr., Thornley, M. D., & Leroy, A. K., 2008, AJ, 136, 2563
- Williams et al. (1994) Williams et al., 1994, ApJ428, 693
- Wilson et al. (1999) Wilson, C. D., Howe, J. E., & Balogh, M. L. 1999, ApJ, 517, 174
- Wilson et al. (2009) Wilson, C. D., et al. 2009, ApJ, 693, 1736
- Young et al. (1995) Young, J. S., et al. 1995, ApJS, 98, 219
- Zhang et al. (1993) Zhang, X., Wright, M., & Alexander, P., 1993, ApJ, 418, 100
Appendix A NGLS Raster Map Observations and their Reduction Strategy
This section describes the observing and data reduction methods used for the NGLS HARP-B 12CO =3-2 raster observations of NGC 628, NGC 3521, and NGC 3627. This description is also relevant for the reduction of other raster map data taken for the NGLS, such as the Virgo spiral galaxies in Paper I (NGC 4254, NGC 4321, NGC 4569, and NGC 4579). It can also be generalized for jiggle map data observations (which often require less or no flagging).
After a series of Science Verification runs between April and November 2007, the NGLS started taking science data using the 16 element HARP-B array with the backend spectrometer ACSIS (Smith et al., 2003). Since that time there has been approximately one dedicated JLS run per month that the three surveys share. Observations for the three galaxies we are examining here, NGC 628, NGC 3521, and NGC 3627, were taken over multiple JLS runs between November 2007 and March 2008.
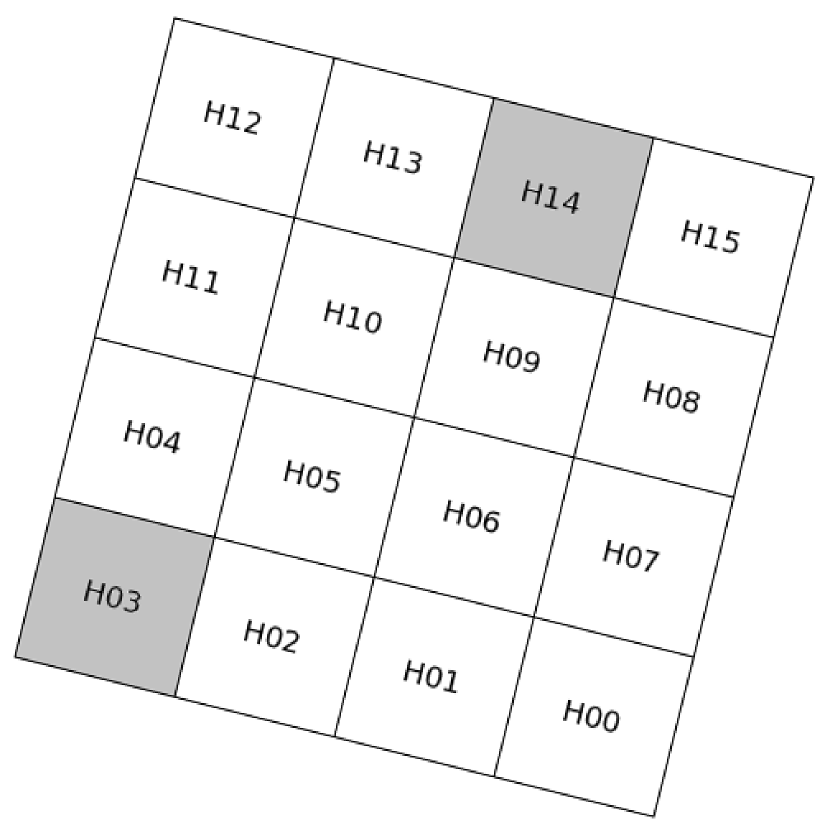
The James Clerk Maxwell Telescope (JCMT) is a 15 meter single dish submillimeter telescope on Mauna Kea, Hawai’i. It is currently the largest single dish submillimeter telescope in the world. HARP-B is a 16-element sparsely filled array of heterodyne receptors operating in the submillimeter window centered at 850 m (350 GHz). The receptors are arranged in a 44 pattern and separated by 30″, approximately two beam-widths (145 at this wavelength). See Fig 15 for the basic layout of the array (with two receptors that were missing during observing marked). To produce a fully sampled map we need to set up a Minimum Schedulable Block (MSB) that either scans or jiggles the array around the field. For all three galaxies in this paper, which have fields larger than the array footprint of 2′, we used a raster scanning technique for mapping.
The default HARP-B raster scanning mode is to rotate the array by 1404 to the scan axis and to scan along the long axis of the field, which produces scan rows at 72761 intervals. On the outer edges of the field coverage is sparse where half the array receptors start already within the target field, so we added an additional 60″ to the start and end along the direction of the scan to account for this. There are significant variations in signal-to-noise between receptors in the array, which can produce striping in raster maps where different rows have different sensitivity. To reduce this effect and produce maps with more even sensitivity coverage we used a ‘basket weave’ technique, scanning along both the major and minor axes of the field. Additionally, we found in the science verification phase of the survey that missing and bad receptors in the array caused large variations in our completeness across the target field, and even holes in our coverage where missing/flagged scans crossed in the basket weave. To counter this problem, we used a half-step scan method, only moving half an array step (582) between scan rows/columns. In this way, each position was covered by two receptors in both scan directions. However, using the half-step method does require that an additional 60″ be added at either end perpendicular to the scan direction so that all points within the target field have the same integration time. With the previous addition of 60″ along the scan axis, we are adding 60″ around all four sides of the field for both scan directions.
Each galaxy’s MSB was set up with a sample time per position of 2.5 seconds, so with the half-step basket weave pattern each pointing will have 10 seconds integration time per MSB (if none of the receptors that contribute to that pointing are flagged or missing). We repeated these MSBs up to seven times until we reached the survey’s target RMS (19 mK after binning to 20 km s-1 resolution). The backend spectrometer ACSIS was set up with a bandwidth of 1 GHz and a resolution of 488.28 kHz (0.423 km s-1 at the frequency of the observations), centered at the systemic velocity for the galaxy being observed (where the 12CO =3-2 line rest frequency is 345.79 GHz). Appropriate pointing and calibration observations were taken during observing nights. Individual setup and observing details for the three galaxies in this paper are in summarized Table 2.
Data reduction and most of the analysis were carried out with recent JAC maintained versions of the Starlink software collection (initially the Humu version, and later Lehuakona). Most of the Starlink tasks we used in the reduction were in the KAPPA (most reduction and analysis tasks) and SMURF (cube making) packages, with some tasks in CUPID (clump finding) and CONVERT (file exporting) also used. The visualization programs GAIA and SPLAT were used to inspect the raw and processed data. Additionally, analysis tasks in MIRIAD were used after the creation of cubes and moment maps. The general reduction procedure was to inspect the raw data files, flag poor data where necessary, combine the raw data into a cube, subtract a baseline from the cube, and collapse it into moment maps. Details of these steps follow.
Throughout the period that the survey observations were taken, the state of the 16 receptors in the array varied. Two receptors (H03 and H14) were unavailable for the duration of the project and for the most part were automatically flagged at the telescope, while several other receptors had various, mostly intermittent problems that led to bad baselines, spikes, and false lines. We used the task chpix (KAPPA) to flag such receptors where required. Additionally, almost all scans contained a narrow interference spike that was also flagged. This spike occurred at the same frequency on all receptors (with varying strength) throughout a scan, and would remain at that frequency over the course of a night or even over several runs. Some scans taken for NGC 3521 were excluded when pointing observations taken straight after showed significant pointing errors (5″), while all data for NGC 628 taken on 11 January 2008 were excluded due to poor baselines and high noise on virtually all receptors. Other observations that did not meet the survey quality assurance criteria (such as high or many receptors with bad baselines) were included, but often with heavy flagging of poor receptors.
After flagging, the raw data were combined into cubes using the task makecube (SMURF). We produced cubes with 72761 pixels, and trimmed the velocity axis to the central 800 km s-1 of the bandpass. We used a (‘SincSinc’) kernel in makecube for the pixel weighting function. The resulting cube was then trimmed to remove the leading and trailing scan ends outside the target field where our scan coverage is incomplete. After removing a simple first order polynomial baseline (fit to the line-free ends of the bandpass) and binning to 20 km s-1, this cube was examined for further bad baselines and to check if we had reached our target depth for the survey. If necessary the process of flagging and cube making was repeated until we were satisfied that the poor baselines had been removed.
To produce a more accurate fit to the baseline level, we used a method in which we masked out emission in the cubes, and then fit third order polynomial baselines to the unmasked data. To make the baseline mask, we first smoothed the cube with a [3 pixel, 3 pixel, 25 channel] box filter, and then used the task mfittrend (KAPPA) to make a mask of all of the features in the smoothed cube. In automatic mode, the ‘method’ parameter in mfittrend allows the choice of several masking methods that have varying success at picking up broad and narrow line features. As the galaxies we are looking at contain a mixture of narrow and broad 12CO =3-2 lines, it was important to produce a mask that contains all emission features.
Individual methods can miss some emission, such as the default ‘Single’ method that picks up narrow lines well, but can often miss broad features. To produce a better mask, we combined the results of two of these methods, ‘Single’ and ‘Global’ (which does a better job on broad lines, but picks up more noise especially at the line-free ends of the bandpass). We altered this combined mask to leave the line-free regions at the ends of the bandpass unmasked (determined by considering the published width of the H i line and visual examination of the cube). Additionally, for NGC 3521 and NGC 3627, which have broad lines in their centers, we included a block mask over a small central region for the full width of the line so that only the line-free ends would be used for the baseline fit. The block mask for NGC 3521 was split into overlapping northern and southern components that cover different velocity ranges. The final combined masks were applied to the original cube, and a third-order polynomial was fit to the masked cube to produce the baseline fit. These baselines were subtracted from the original cube to make the final baseline subtracted cube.
Moment maps of the galaxies were made from the baseline subtracted cubes using the Starlink implementation of the clumpfind algorithm (Williams et al., 1994), the Cupid task findclump, to identify emission above 3. Sensitivity varied across the field, particularly in the regions outside the target field (see above), so before running it through the moment map procedure we first scaled the cubes by the noise level in order to better identify real clumps. To do this, we produced a map of the standard deviation in the line-free channels of the cube (using the baseline mask we previously made), and divided the cube by this map. This scaling was removed again after producing the maps so that the units were correct.
As with the baseline mask steps, we made a smoothed cube with a [3,3,25] box filter. Using the baseline mask previously made for the baseline fit, we calculated the RMS in the line free regions of the cube. We then used findclump (Cupid) on the smoothed cube to find all emission greater than 3, and create a mask to exclude the regions without emission. The clump mask was then applied to the original baseline subtracted cube, and the result was collapsed into two dimensional moment maps using collapse (KAPPA). We produced maps of the integrated intensity (moment 0), the intensity weighted velocity co-ordinate (moment 1, the velocity field), and the intensity weighted dispersion (moment 2, the velocity dispersion). We converted the 12CO =3-2 data from corrected antenna temperature () to the main beam temperature scale by dividing by . This correction is different from the value of 0.67 used in Paper I, and all 12CO =3-2 measurements from that paper used here are corrected for this difference. The resulting moment maps are discussed in § 3.