The discovery of a molecular cavity in the Norma near arm associated to H.E.S.S -ray source located in the direction of Westerlund 1.
Abstract
We report on the discovery of a molecular cavity in the Norma near arm in the general direction of Westerlund 1 (Wd1), but not associated with it. The cavity has a mean radial velocity of km s-1, which differs by as much as 40 km s-1 from the mean radial velocity of the Wd1 stars. The cavity is surrounded by a fragmented molecular shell of an outer diameter of about 100 pc and 106M⊙, which is expanding at velocities of 6 to km s-1. The amount of kinetic energy involved in the expanding shell is erg. Inside this cavity the atomic HI gas surface density is also the lowest. Structure of the extended Very High Energetic (VHE) -ray emission, recently reported by the H.E.S.S. collaboration (Ohm et al., 2009), coincides with the cavity. The observed morphology suggests that the inner wall of the molecular shell is the zone of the -ray emission, and not the dense gas surrounding massive stars of Wd1 as had been speculated by the H.E.S.S. collaboration. A likely candidate responsible for creating the observed cavity and the -ray emission is the pulsar PSR J1648-4611.
1 Introduction
Recently, the H.E.S.S. collaboration carried out a search for Very High Energy (VHE, E100 Gev) -ray emission from Galactic young stellar clusters and found positive detections in the direction of Westerlund 1 (Wd1) and Westerlund 2 (Wd2) (Ohm et al. 2009; Ohm09 henceforth). The motivation behind these searches comes from the fact that the stellar clusters are potential acceleration sites of VHE particles, since they host a variety of energetic sources such as Supernova Remnants (SNRs) and pulsar wind nebulae. Extended and point like emission was detected surrounding Wd2 (Aharonian et al., 2007), whereas only extended emission off-centered from the cluster was detected in the case of Wd1 (Ohm09). The emission surrounding Wd2 was associated with the cluster by Dame (2007), who found structural coincidences between the CO map and the -ray source. Ohm09, searched for structural coincidences between the -ray and HI maps of Wd1, and suggested a possible association of Wd1 with the -ray emission. One way of confirming this association is to compare the observed -ray emission structure with the CO gas, which is a well-known tracer of the -ray emission zones, apart from tracing the spiral arms better than HI in the inner disk (e.g. Dame & Thaddeus (2008)).
In order to study the Wd1 region in CO, we need to establish the velocity of the Wd1 cluster. Kothes & Dougherty (2007), analyzed the neutral gas environment around the cluster and concluded that Wd1 lies at a radial velocity of km s-1, thus locating it in the external part of the Scutum-Crux (SCx) arm. Recent radial velocity measurements of stellar members of Wd1 yield a mean velocity of km s-1 (Mengel & Tacconi-Garman, 2009; Ritchie et al., 2009), thus confirming the velocity derived from the HI analysis.
We have searched for molecular clouds towards Wd1, in the Columbia-Calan CO survey data cube (Bronfman et al., 1989). This survey covers the entire southern MW and has a spatial resolution of 0.125∘, a velocity resolution of 1 km s-1 and a sensitivity of 0.1 K. Our analysis covers large angular scale ( centered at l=339.55∘, b=), allowing us to study the large scale structure of the interstellar medium around the cluster.
The aim of the present work is to search for the molecular clouds associated with the H.E.S.S. -ray emission, and to investigate whether Wd1 is the source of the observed -ray emission. With this aim, we first analyzed the morphology and kinematics of the molecular gas at the established radial velocity of Wd1 ( km s-1) in the SCx arm. The resulting poor association of the CO structures with the H.E.S.S map, prompted us to carry out the analysis of the CO morphology of the Norma arm at km s-1, which is the next major arm in the line of sight (LOS) to Wd1. In this latter arm, we discovered a ring, which could be interpreted as an expanding shell, with very good structural correspondence with the observed -ray emission. In this Letter, we compare the CO maps at both velocities with the -ray observations, and discuss in some detail the CO structure of the Norma arm. In §2, the CO molecular emission in the direction of Wd1 is presented. The association between molecular gas and VHE emission is presented in §3, and finally in §4, we discuss the consequences of this correspondence.
2 12CO emission in the general direction of Wd1
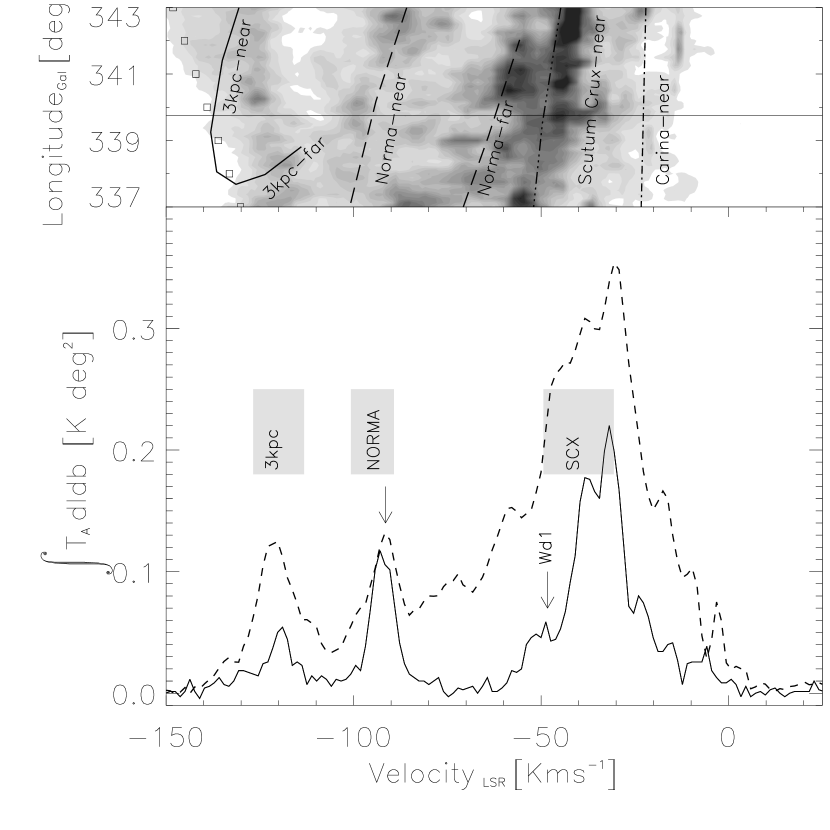
The 12CO intensity line profiles along the LOS to Wd1 in narrow and wide beams are shown in Fig. 1. This LOS intersects several arms of the MW. We adopted the Galactic model of Bronfman et al. (2000) to identify the observed peaks with known spiral arms. The 3 kpc arm at km s-1 with a FWHM of 13.7 km s-1 (distance7.5 kpc), is identified. The peak at km s-1 with a FWHM of 8 km s-1 corresponds to the Norma near arm (distance=5.50.5 kpc), whereas the strongest emission profile in the plot originates principally from the SCx arm at km s-1 (distance kpc). However, velocity profiles of Norma far ( km s-1, distance kpc), and Carina arm ( km s-1, distance0.5 kpc), also contribute to the observed profile as can be inferred from Fig. 5 of Bronfman et al. (2000). The far side of all arms in the fourth quadrant of the MW, is very difficult to detect and/or distinguish, because they are expected to be much fainter than the superposed contributions from nearer arms. Hence, we assign the entire intensity of a velocity peak to the nearer arm. We identified the peak located at a velocity of km s-1 (FWHM of 14 km s-1) with the Wd1 cluster, following the HI study by Kothes & Dougherty (2007). Given that they used a galactocentric distance to the Sun of 7.6 kpc, we recalculated the distance to Wd1 using the IAU recommended value of 8.5 kpc, obtaining a distance of 4.3 kpc (instead of 3.9 kpc).
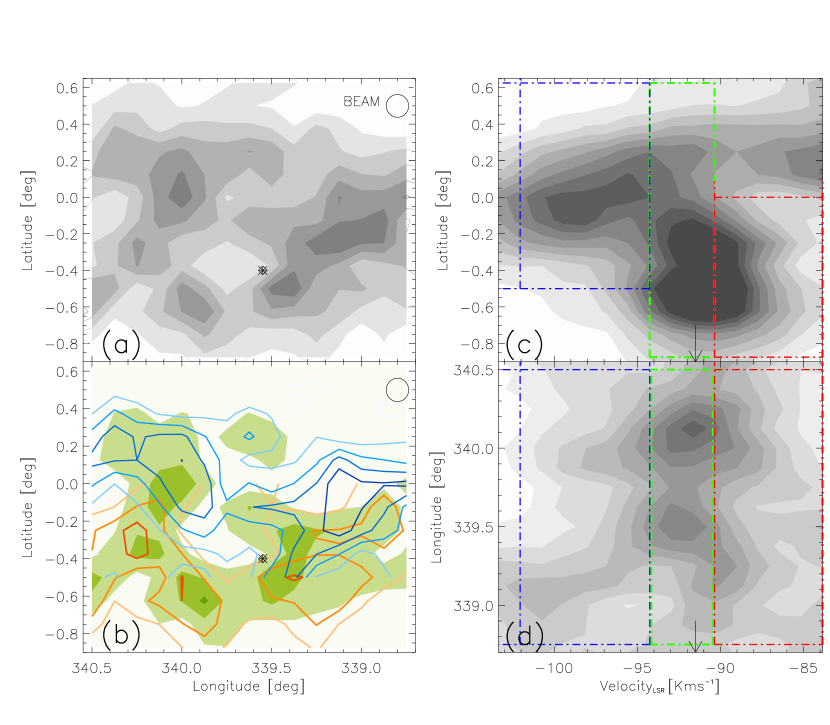
The CO emission map centered at the radial velocity of the Norma arm is shown in Fig. 2. In the velocity integrated map, an apparent CO ring centered at l=339.75∘, b=, is easily identifiable. This ring like structure constitutes a cavity surrounded by a molecular gas complex of an outer diameter of 1.5∘, and a thickness with an average value of about 0.5∘. It is part of a fragmented shell seen in projection (see below).
It can be seen in both position-velocity maps (Fig. 2c and 2d) that there is both receding and approaching gas with respect to the systemic velocity of the Norma arm. The observed CO emission largely originates from the gas at the arm’s systemic velocity. The approaching gas is principally concentrated to the north of the ring center, whereas the receding gas is located to the south. The approaching gas is not concentrated in a single structure, instead the observed emission comes mainly from two regions, one located at l=340.0∘, b=0.0∘ and the other at l=339.2∘, b=0.0∘. They have a maximum radial velocity of 8 km s-1 with respect to the systemic velocity ( km s-1) of the Norma arm. These components are compact in projection and they merge in velocity smoothly with the Norma’s systemic gas, as can be seen in fig. 2(d). This leads us to believe, that the approaching component belongs to the Norma arm, and not to the 3 kpc far arm. The receding component is distributed uniformly along the latitude and longitude range of the cloud with a maximum velocities of 6 km s-1 with respect to the arm’s systemic velocity. Fig. 2b shows these velocity components superposed on the spatial map. All these observed characteristics suggest that the molecular ring is expanding at 6 to 8 km s-1.
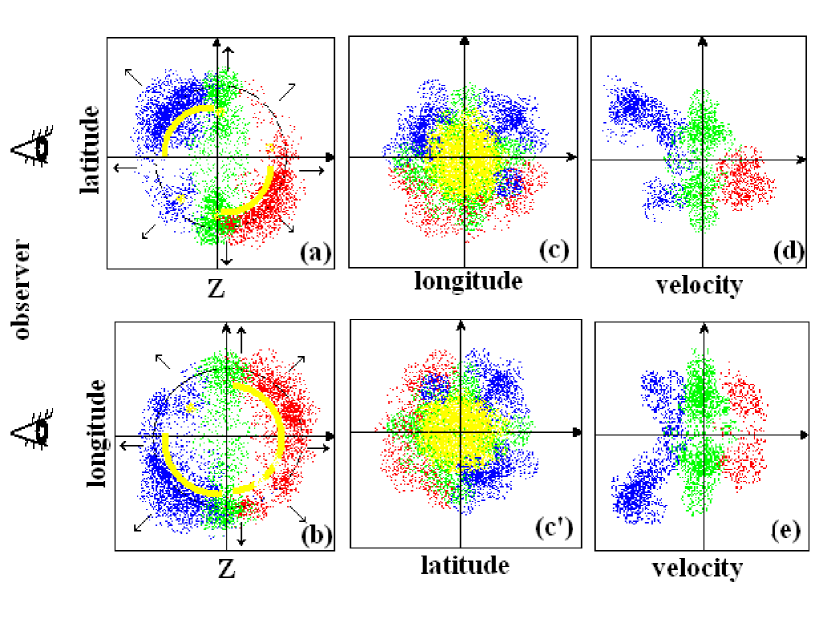
In Fig. 3, we present 2D sections of a 3D expanding shell schematic model that best explains the observed structures in space and velocity. In Fig. 3 (a),(b),(c) and (c’) we show the projections in latitude-depth, longitude-depth and latitude-longitude planes, respectively. In each panel the approaching and receding gas is shown in blue and red colors respectively, whereas the gas at rest is shown in green. The observed spatial distribution of gas, as well as the observed kinematics, are well reproduced by our simple schematic model, in which the gas principally resides on the surface of an expanding shell, with very little gas in the center of the shell. The gas in the shell is not uniformly distributed, instead the majority of the gas mass is located in two diagonally opposite directions. From the model, we infer that the gas at rest (in green) is also participating in the expansion, but it is seen at rest due to projection effects. In Fig. 3 (d) and (e), we show the projections in the latitude-velocity and longitude-velocity planes respectively. These figures reproduce well the observed structures in Fig. 2 (c),(c’) and (d), respectively.
We estimate the molecular cloud mass content in the shell to be 106M⊙. For calculating this, we used the ratio N(H2)/W= 1.561020 cm-2 K-1 km s-1 (Hunter et al., 1997), and with the standard approximation Mcloud=(2) (1.36) A mp N(H2), where A is the projected area, mp the proton mass, N(H2) the molecular column density, and WCO the 12CO integrated intensity, the factor 1.36 accounts for Helium assuming a 10 abundance by number (See Murphy May 1991). The kinetic energy involved in the observed gas mass and expansion velocities is about erg using Ekin=(1/2) Mcloud v. The observed size of the shell implies that the cavity was produced around 6 Myr ago, if the expansion velocity was uniform over time, or shorter if the shell had a larger expansion velocity in the past.
A map showing the distribution and the kinematics of the atomic HI gas associated with the molecular cavity is presented in Fig. 4 of Luna et al. (2009). We note that the distribution and kinematics of the atomic HI gas is very similar to that of the CO emission. The cavity observed in the molecular gas is seen in the atomic gas as an HI hole of low column density. The lowest HI integrated emission outlines the northern inner boundary of the molecular cavity.
3 The molecular gas associated to the -ray emission
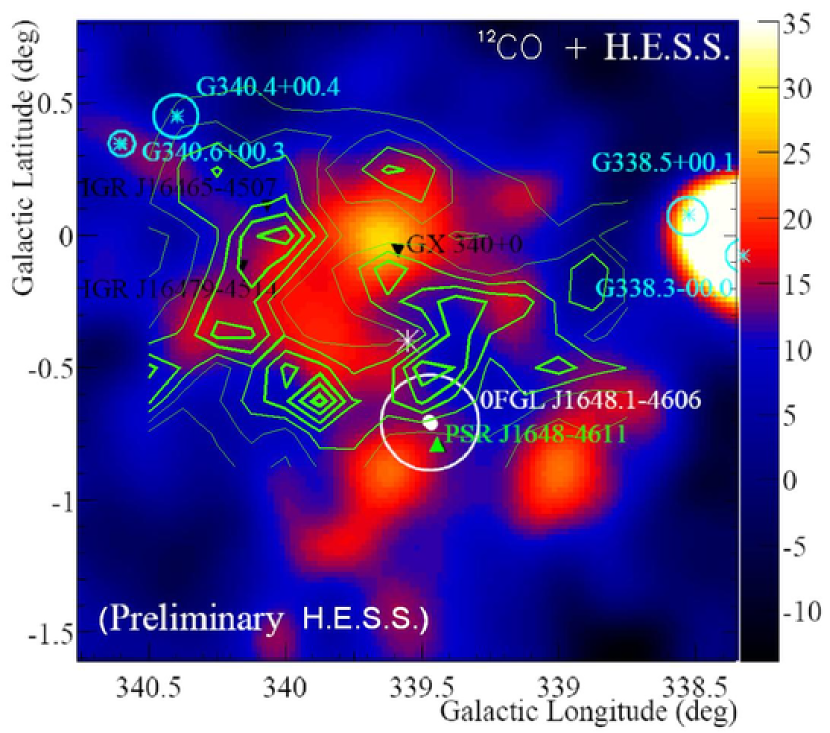
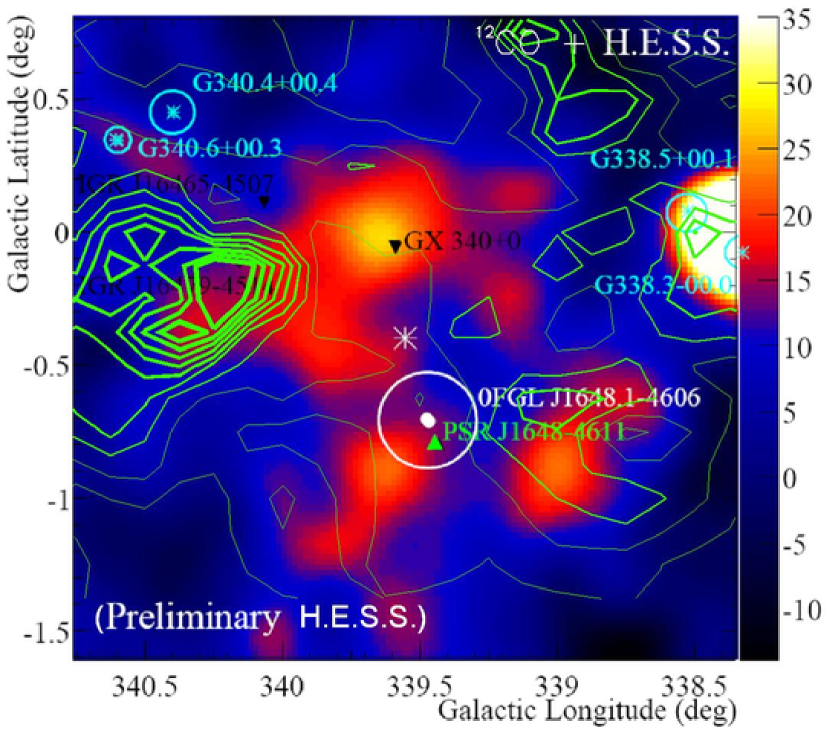
In this section, we compare the morphology of the molecular cavity with the -ray emission map from Ohm09. The top panel of Fig. 4 shows the CO emission associated with the molecular shell in contours superposed on the -ray emission map, which has a beam of . The latter map is dominated by several bright point sources that have been identified by Ohm09 as associated with already known sources. The X-ray source GX340+0 at l=339.56, b=0.085, the pulsar PSR J1648-4611, and the magnetar CXO J164710.2-455216 (white asterisk in Fig. 4), are of relevance to the present paper. In addition to these point sources, there is extended emission in the shape of a horseshoe, that coincides with the projected inner wall of the molecular shell. Especially noticeable is the similarity of the structures of the -ray emission and the dense molecular gas northward of the magnetar, where the projection of the molecular shell is seen as a protrusion inside the cavity. The -ray emission seems to fill the cavity in the figure. Such a configuration can be produced in our 3D expanding shell model, if the -ray emission comes from the inner surface of the molecular shell as can be seen in yellow shades in Fig. 3. Hence, the proposed shell model with the -ray emission restricted to the inner wall of the shell, can explain not only the observed molecular position-velocity map, but also the -ray emission structure observed by H.E.S.S.
While the molecular shell of the Norma arm could be traced in many successive channel maps. Yet, there is no coordinated structure in anyone the velocity channel maps around the systemic velocity of Wd1 (50 km s-1). Hence, in order to generate a CO map of the Wd1 region, we integrated all the channels in a 20 km s-1 velocity range centered at 48 km s-1. In the bottom panel of Fig. 4, we show this CO map superposed on the -ray emission map. There is no coordinated CO structure associated with Wd1, that could be compared with the -ray emission map. The only prominent structures seen in CO are at l=340.25∘, b= and l=339∘, b=0.5∘. Hence, Wd1 is not responsible for the observed extended -ray emission.
4 Summary and Discussions
We analyzed the morphology and kinematics of the molecular environment in the general direction of Wd1, with the aim of looking for the molecular gas that may be associated with the recently reported H.E.S.S. -ray emission. We discovered an expanding molecular ring at the radial velocity of km s-1, with the inner contours of the ring coincident with the observed -ray emission structure. The observed morphologies of the -ray emission and the CO emission along with their kinematics, can be understood in terms of an expanding fragmented shell of molecular gas. Thus, the 2 components are physically associated and both lie in the Norma arm. Consequently, the molecular structure surrounding the Wd1 ( km s-1) cluster does not correspond to the observed -ray emission map.
The -ray emission is produced by accelerated energetic particles when they interact with dense gas. Recently, Fujita et al. (2009) proposed a model of generating VHE -rays by a SNR located in a cavity surrounded by high density molecular gas in order to explain the observed photon spectra for the hidden SNR in the open cluster Wd2, and the old-age mixed-morphology SNR W28. In this model, the particles are accelerated at the end of the Sedov phase, when the SN shock reaches and collides with the surrounding spherical high-density molecular gas (shell). This interaction produces -ray emission in the inner wall of the molecular shell, exactly the configuration that produces our observed CO morphology. Hence, the presence of a stellar remnant inside the molecular cavity can give rise to the observed -ray emission. There are three stellar remnant candidates in the field of view. They are a binary system GX340+0 containing a neutron star (Schultz Wijers, 1993), a magnetar (CXO J164710.2-455216), and the pulsar PSR J1648-4611, with the third one the most likely precursor.
The first two sources are seen geometrically inside the molecular cavity, but lie at distances different from that of the cavity according to their present distance estimations. The magnetar is associated with Wd1 following the analysis by Muno et al. (2006), based on statistical grounds. However, it could as well be located further out, in the molecular cavity. For the neutron star in the binary system GX340+0, a maximum distance of 113 kpc has been estimated based on its luminosity, assuming that it is radiating at the Eddington limit (Penninx et al., 1993). Yet, it is conceivable that the neutron star is not emitting with the limiting luminosity, in which case it could be located at the distance of our cavity.
A third stellar remnant (PSR J1648-4611) is located half a degree South-East of the ring center and is seen just at the outer border of the molecular ring (see Fig. 4). A distance by dispersion measure yields a value of 5–5.7 kpc, depending on the electron density distribution model adopted (Torres Nuza, 2003). That is at the same distance of the cavity. This makes this pulsar a strong candidate for producing the -ray emission at the inner boundaries of the molecular shell. The location of the pulsar off-center of the cavity, could be due to a large proper motion of the pulsar. following the SN explosion. It requires only a velocity as little as 8 km s-1 for the pulsar to move from the center of the shell to its present position, if the explosion occurred 6 Myr ago, and the pulsar is moving in the plane of the sky.
Recently, the LAT instrument on board of the Fermi satellite detected unpulsed emission from a region coincident with this pulsar (Adbo et al., 2009). The model proposed by Fujita et al. (2009) expects emission in the Fermi band coincident with the -ray emission, but such emission is not yet detected by Fermi observations. However, the observed configuration of a cavity surrounded by a molecular shell, with associated VHE -rays emission, and a bright Fermi source in the vicinity, are common to both, Wd2 and the expanding shell discussed in our work.
References
- Adbo et al. (2009) Adbo, A. A., et al. 2009, ApJS, 183, 46
- Aharonian et al. (2007) Aharonian, F., et al. 2007, A&A, 467, 1075
- Bronfman et al. (1989) Bronfman, L., Alvarez, H., Cohen, R., Thaddeus, P. 1989, ApJS, 71, 481
- Bronfman et al. (2000) Bronfman, L., Cassasus, S., May, J., Nyman, L. 2000, A&A, 358, 521
- Dame (2007) Dame, T. M. 2007, ApJ, 665, L163
- Dame & Thaddeus (2008) Dame, T. M., P. Thaddeus 2008, ApJ, 683, L143
- Fujita et al. (2009) Fujita, Y., Ohira, Y., Tanaka, S. J., Takahara F. 2009, ApJ, 707, L179
- Hunter et al. (1997) Hunter, S., Bertsch, D., Catelli, J., et al. 1997, ApJ, 481, 205
- Kothes & Dougherty (2007) Kothes, R., Dougherty, S. M. 2007, A&A, 468, 993
- Luna et al. (2009) Luna, A., Mayya, Y. D., Carrasco, L., Rodríguez-Merino, L. H., & Bronfman, L. 2009, RevMexAA Conference Series, 37, 32
- Mengel & Tacconi-Garman (2009) Mengel, S., & Tacconi-Garman, L. E. 2009, Ap&SS, 324, 321
- Muno et al. (2006) Muno M. P., et al. 2006, ApJ, 636, L41
- Murphy May (1991) Murphy, D. C. May, J. 1991, A&A, 247, 202
- Ohm et al. (2009) Ohm et al. 2009, arXiv:0906.2637v1 (Ohm09)
- Penninx et al. (1993) Penninx, W., Zwarthoed, G. A. J.van Paradijs, van der Klis, M., Lewin, W. H. and Dotani, T. 1993, A&A, 267, 92
- Ritchie et al. (2009) Ritchie, B. W., Clark, J. S., Negueruela, I., Crowther, P. A. 2009, A&A, 507, 1585
- Schultz Wijers (1993) Schultz, N. S., Wijers, R. A., 1993, A&A, 273, 123
- Torres Nuza (2003) Torres, D. F., & Nuza, S. E. 2003, ApJ, 583, L25