The central dark matter content of early-type galaxies: scaling relations and connections with star formation histories
Abstract
We examine correlations between the masses, sizes, and star formation histories for a large sample of low-redshift early-type galaxies, using a simple suite of dynamical and stellar populations models. We confirm an anti-correlation between size and stellar age, and survey for trends with the central content of dark matter (DM). An average relation between central DM density and galaxy size of provides the first clear indication of cuspy DM haloes in these galaxies—akin to standard CDM haloes that have undergone adiabatic contraction. The DM density scales with galaxy mass as expected, deviating from suggestions of a universal halo profile for dwarf and late-type galaxies.
We introduce a new fundamental constraint on galaxy formation by finding that the central DM fraction decreases with stellar age. This result is only partially explained by the size-age dependencies, and the residual trend is in the opposite direction to basic DM halo expectations. Therefore we suggest that there may be a connection between age and halo contraction, and that galaxies forming earlier had stronger baryonic feedback which expanded their haloes, or else lumpier baryonic accretion that avoided halo contraction. An alternative explanation is a lighter initial mass function for older stellar populations.
keywords:
dark matter – galaxies : evolution – galaxies : general – galaxies : elliptical and lenticular.1 Introduction
The formational history of early-type galaxies (ETGs: ellipticals and lenticulars) remains an outstanding question. While these dynamically hot systems may be basically understood as end-products of galaxy mergers, the details of these mergers and their cosmological context are unclear. High-redshift () observations have made initially surprising discoveries that many ETGs were already present at early times with mature stellar populations, and that these galaxies were much more compact than those in the present day. (e.g. Glazebrook et al. 2004; Daddi et al. 2005; Trujillo et al. 2006).
The evolution in ETG sizes is still controversial in both observation and interpretation (e.g. van Dokkum et al. 2009, 2010; Mancini et al. 2010; Valentinuzzi et al. 2010). However, the most likely scenario is for a combination of effects where individual galaxies grow in size by accretion of smaller, gas-poor galaxies (an “inside-out” picture of galaxy formation), and where younger ETGs are formed with larger sizes because of their decreased cold gas content and the lower background densities of dark matter (DM; e.g. Saracco et al. 2009; Bezanson et al. 2009; van der Wel et al. 2009; Naab et al. 2009; Hopkins et al. 2010; Shankar et al. 2010).
The role of DM is considered fundamental to the formation of galaxies, and DM halo properties have been extensively studied in cases such as gas-rich spirals and nearby dwarfs which have suitable observational tracers (e.g. McGaugh et al. 2007; Walker et al. 2009; Kalirai et al. 2010). Studying DM in the general population of ETGs is in many ways more difficult, with ongoing surveys of the available large-radius halo tracers attempting to remedy our ignorance in this area (e.g. Romanowsky et al. 2009; Coccato et al. 2009; Proctor et al. 2009; Thomas et al. 2009, hereafter T+09; Woodley et al. 2010).
DM can alternatively be studied with less precision but in more extensive ETG samples by considering the well-studied central regions—inside the “effective radius” () enclosing half the stellar light, where DM is generally thought to be a minor yet potentially detectable contributor to the mass. Here one of the classic approaches is to analyze the “fundamental plane” (FP) relating ETG sizes, luminosities, and central velocity dispersions (). The FP shows a “tilt” or systematic deviation from simple expectations based on galaxies with constant dynamical mass-to-light ratios , probably implying systematic differences in the stellar populations or in DM content.
After many years of debate, there is still not a consensus on what is driving the FP tilt (e.g. Trujillo et al. 2004; Ferreras et al. 2005; Cappellari et al. 2006, C+06 hereafter; Boylan-Kolchin et al. 2006; Dekel & Cox 2006; Bolton et al. 2007, 2008; Jun & Im 2008; Tortora et al. 2009, hereafter paper I; Allanson et al. 2009; Graves 2009; Grillo & Gobat 2010; Humphrey & Buote 2010; La Barbera et al. 2010a). Some work suggests stellar populations variations or non-homologies in the luminosity profiles as the tilt drivers. However, it is a fairly generic expectation from the standard cosmological framework for galaxy formation that the central DM content of ETGs will systematically increase with luminosity—a point we discussed in paper I and develop further in this paper. If the FP tilt is not caused in large part by DM, there could be problems implied for galaxy formation theory. Here one could pursue two different philosophies: to empirically and robustly determine the reasons for the FP tilt without recourse to theory (e.g. making no assumptions about the underlying DM profiles); or to adopt the theoretical framework as broadly correct and consider the detailed implications for ETG composition and formation.
Following the second approach, it is now time to begin moving on from phenomenological questions about the FP tilt, and to establish more direct connections between DM in ETGs and their formational histories. In particular, the central DM content could prove crucial to solving the size-evolution puzzles mentioned above, and more fundamentally to understanding the assembly of ETGs. To this end, we now extend the analysis of paper I, which combined models of stellar dynamics and population synthesis to infer total and stellar masses in a large sample in nearby galaxies, and thereby to analyze the FP tilt. There have been previous suggestions that age and star formation timescales are important fourth parameters in the FP (Terlevich & Forbes, 2002; Gargiulo et al., 2009; Graves, 2009). We will now explore this possibility systematically, using the results from paper I to consider additional correlations involving DM content and star formation histories (SFHs).
It should be noted at the outset that the data and the analysis techniques that we use for deriving mass and SFH parameters may not be the most state-of-the-art. However, our aim is to pioneer a framework for interpreting any data of this kind in a broad cosmological context (where in particular, emerging high- data-sets provide only crude observational constraints on ETGs), and we are so far able to tentatively identify some basic and intriguing trends.
The paper is organized as follows. In Section 2 we present our basic observational results. We go on to analyze some implications of the trends of DM with mass in Section 3 and with age in Section 4. In Section 5 we summarize our conclusions. Two Appendices include analyses of statistical and systematic uncertainties.
2 Observational results
Here we present our basic observational results. Section 2.1 provides an overview of our galaxy sample and mass inferences, and summarizes the trends versus mass. Section 2.2 presents results related to galaxy age.
2.1 Summary of sample and initial results
Our starting point is a collection of local ETGs from Prugniel & Simien (1996) that we recently re-analyzed in paper I. The sample was selected to have measurements of and at least two colours, with a subsample of systems that also include the maximum rotation velocity (). There are 218 elliptical galaxies and 117 lenticular/S0 systems: as shown in paper I, the two subsamples show similar stellar and DM properties and we will consider them jointly in this work.
We next summarize the main steps of the paper I analysis, starting with the stellar population models. We used a set of simple stellar population (SSP) synthetic spectra from the prescription of Bruzual & Charlot (2003, BC03 hereafter) to fit the observed galaxy colours. We assumed a Salpeter (1955) or Chabrier (2001, 2002, 2003) initial mass function (IMF) alternatively, with initial masses in the range . For the current paper, we instead use an intermediate Kroupa (2001) IMF as our default model111For old stellar populations ( 1 Gyr), changing the IMF generally impacts the colours at less than the 0.01 mag level. The IMF change can then be fairly represented as a simple overall stellar renormalization, which is reduced by a factor of 1.6 in changing from Salpeter to Kroupa; see e.g. Fig 4 of BC03..
These single-burst models were convolved with an exponential SFR to generate more general SFHs, where is a characteristic time scale. The , metallicity (), and were free parameters of the model while stellar , , was inferred from the best-fit solution for each galaxy. The reliability of the modelling technique and the intrinsic parameter scatter, as well as the presence of spurious correlations among the stellar parameters induced by the stellar modelling procedure, have been checked through Monte Carlo simulations (see paper I for details, as well as Appendix B.3 of this paper). In addition, a recent novel, completely independent technique for estimating using globular cluster systems has yielded results in perfect agreement with ours (Forte et al. 2009, Fig. 6).
We derived the dynamical () within by means of Jeans analysis assuming spherical symmetry, isotropy of the velocity dispersion tensor, and introducing a rotation velocity correction in the spherically averaged RMS velocity , which is a measure of the total kinetic energy of the system within . In the following we will use obtained with the multi-component model in paper I (i.e. Sérsic 1968 profile for the stars and singular isothermal sphere for the total mass); we have verified that the particular mass model choice does not affect the conclusions of this paper.

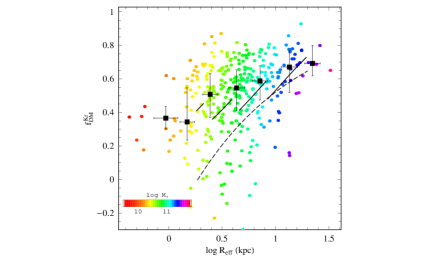
Central DM fractions are inferred by stellar and dynamical estimates, being by definition
| (1) |
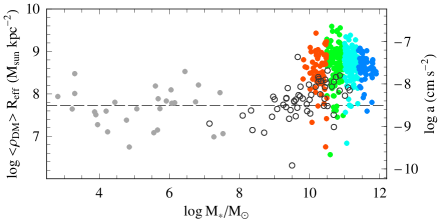
where and are obtained in paper I222While is a three-dimensional quantity, is projected and susceptible to additional variations from large-radius material along the line of sight. However, we have estimated using some simple models that would typically be affected at only the 1% level.; the DM mass includes any mass in diffuse gas. Note that as seen in Fig. 1, a fraction of the galaxies (under any of our IMF choices) appear to have , which would be an unphysical situation. This is not necessarily a worry, since errors in the estimates can scatter some data to . We have investigated this issue quantitatively in Appendix A, finding a strong but not definitive suggestion that some ETGs are not compatible with having a Salpeter IMF. Similar points were made in other studies (Renzini 2005; C+06; Ferreras et al. 2008; Cappellari et al. 2009; Barnabè et al. 2010) using conceptually similar techniques. Treu et al. (2010, hereafter T+10) on the other hand claimed from an analysis of gravitational lenses that a Salpeter IMF is preferred, with a possible systematic IMF variation. We will return to these issues in later Sections, and for now note that an assumed universal Kroupa IMF is a reasonable starting point.
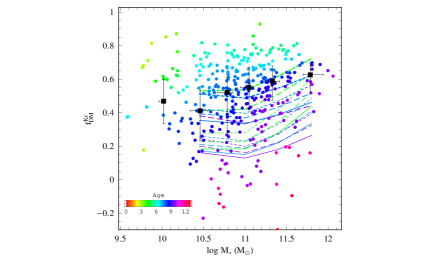
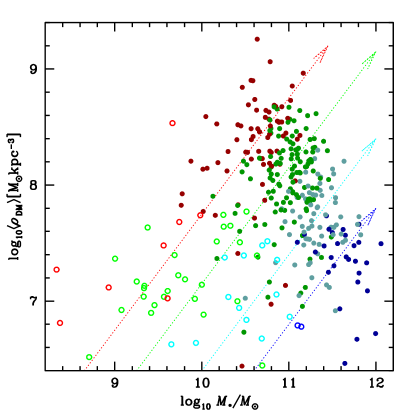
We found in paper I that the value correlates with luminosity and stellar mass (Fig. 2), a trend that could be the phenomenological cause of the FP tilt333In principle, the tilt could instead be caused by a systematic variation of IMF with galaxy luminosity (see paper I). We will reconsider IMF variations later in this paper. The effects of “non-homology” of the stellar profiles were implicitly corrected for in our modelling.. We also examined the formational causes of the tilt in paper I (Section 6), using toy models of galaxies in a cosmological context to verify that the expected scaling relations of DM haloes might naturally explain the trends. We will develop this theme further in the following Sections, and also begin studying the implications of the SFHs.
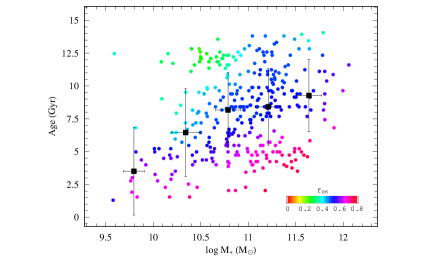
One basic SFH result is illustrated by Fig. 3: the stellar ages and masses of the galaxies are correlated, providing another example of the well-known “archaeological downsizing” phenomenon wherein more massive systems form earliest. We plan to consider the physical reasons for this downsizing in a subsequent paper, comparing cosmologically-based models for SFHs and DM halo assemblies. Here we will simply treat the SFHs as a given which we will attempt to correlate with DM properties, envisioning these as fundamental ingredients for constraining future theoretical models.
2.2 New trends with age
Here we move beyond the FP analysis of paper I and examine in more detail the DM trends, including the connections with SFHs. We plotted in Fig. 2 the empirical values for versus stellar mass; the two quantities are correlated albeit with substantial scatter and suggestions of non-monotonicity. We have also colour-coded the data points in Fig. 2 by stellar age444Hereafter, where applied, the smoothed colour coding is obtained by linearly interpolating the average values of the third (colour-coded) quantity over a regular grid of the other two plotted quantities. This procedure allows us to readily see qualitative trends in the data, with the caveat that quantifying these trends can be unreliable after smoothing., and can see immediately that much of the scatter in might be explained by systematic correlations with SFHs. In particular, at a fixed mass the galaxies with the youngest stars are found to have on average the highest DM fractions. This is a central result of our paper which we consider in more detail below. Trends involving will be studied in a subsequent paper.
We show two other projections of the three-dimensional space of age-mass- in Figs. 3 and 4. The combination of -mass and age-mass correlations (Figs. 2 and 3) suggest that there could be an overall -age correlation. However, Fig. 4 shows that there is a net anti-correlation between and age, which implies that couples more strongly to age than to mass (we will revisit this issue in Section 4.1).

Before analyzing these trends in more detail, we consider that there is an important fourth parameter involved, the effective radius . This is because is evaluated at , a variable parameter that has its own systematic dependencies. As we found in paper I and will revisit below, the well-known ETG size-mass relation (-) can explain much of the - trends as an “aperture effect”, without invoking any intrinsic variation in the DM properties. This is because the stellar varies more quickly with mass than do the inner DM halo properties (in CDM), meaning that for a more massive galaxy, the larger encloses a higher fraction of the total DM.
The next question is whether there is a link between and age that could be driving the -age trends. As mentioned in Section 1, the size-mass relation is thought to evolve strongly with time, such that ETGs at a fixed mass are more compact at earlier times. This trend can be considered generically to include contributions both from size growth of existing galaxies, and from the birth of new galaxies with systematically larger sizes. As a consequence of the latter effect, we would expect the population of ETGs at a fixed time (e.g. ) to show a correlation between size and age at fixed mass, such that the older galaxies are smaller.
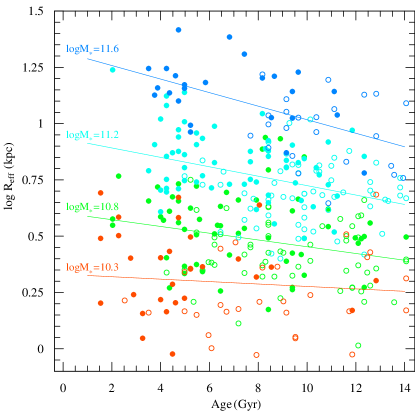
This qualitative prediction has recently been confirmed by low- observations (SB09; van der Wel et al. 2009), and we now investigate it for our own ETG sample. We plot against age in Fig. 5, where galaxies are colour-coded according to four fiducial stellar mass bins that we will use throughout the paper: 10.3, 10.8, 11.2, 11.6 for a Kroupa IMF). The overall galaxy distribution does not show any significant dependence of with , but for any given mass there is a clear anti-correlation (particularly for the most massive galaxies), i.e. older galaxies have on average smaller effective radii. We quantify the size-age dependency by fitting a log-linear relation in each of the mass bins. The slopes range from to , where the normalization increases with mass in accordance with the typical – relation (see e.g. paper I). These trends appear to be independent of the galaxy sub-type (ellipticals versus S0s)—which is a crucial point because one might otherwise speculate that the younger objects are S0s with systematically different properties than ellipticals.
These size-age trends might be driven by higher densities of DM and gas at earlier epochs of galaxy formation (see references in Section 1). However, as with the age-mass correlation, we will for now set aside a physical interpretation of the size-age correlation and simply consider it as a nuisance factor that must be treated appropriately in our later toy models of DM content. These size-age results are not meant to be universally applicable to ETGs but are a characterization of this particular data-set as needed for our self-consistent galaxy toy models.
The size-age trends clearly go in the right direction to explain the -age trends: older galaxies could exhibit lower simply because their values are smaller, so smaller volumes of their DM haloes are probed. In principle, one might be able to see directly from the data whether is more directly coupled to age or to , and to this end we have highlighted the high- and low- galaxies in Fig. 5. However, it is not immediately obvious whether or age is the stronger factor, probably because of the scatter in the data. Instead, in the next section we will adopt a model-dependent approach, attempting to make sense of the observed trends in the context of standard DM+galaxy models.
Before continuing, in Appendix B we carry out a number of cross-checks on the robustness of our basic -age result. First, comparing independent constraints from the literature we find some support for an -age anti-correlation. However, there may be disagreement in the residual -age trend after accounting for the -age relations (which we examine further in the following Sections). Such differences illustrate the need for further in-depth study of this topic. We also check in Appendix B the effects of our stellar populations modelling assumptions, finding that our main conclusions are fairly insensitive to these.
Besides the systematic uncertainties, there is the issue of the statistical errors being correlated, in the sense that an error in age correlates with an error in and produces an artificial -age anti-correlation (see error ellipse in Fig. 4). To gauge this effect, we have simulated mock data-sets with random errors applied to the ages, propagated these to errors on , and then regenerated the -age plot. The artificial trend generated by the errors turns out to change the slope by only Gyr-1 (compared to the observed slope of Gyr-1). We will continue in the rest of this paper to assume that our empirical results are correct, and go on to examine the implications for galaxy structure and formation.
3 Dark matter implications
Given the preceding inferred DM trends, we begin here with interpretations of the mass dependencies, constructing CDM-based toy models in Section 3.1. We consider DM density profiles in Section 3.2, and comparisons to related literature results in Section 3.3.
3.1 CDM halo models and trends with mass
We now construct a series of toy models of galaxies including DM haloes based on CDM theory, as previously done in Napolitano et al. (2005) and in paper I. With this approach we are not modelling individual galaxies but generating typical representatives in the space of mass and age. Each model is spherically symmetric and is comprised of a stellar spheroid and a DM halo. The spheroid has a Sérsic density distribution with an -index as described in paper I, and an --age dependence taken from the log-linear fits in Fig. 5.
The DM halo has an NFW density profile (Navarro et al., 1997) following a typical concentration-virial mass (-) relation555As in our previous papers, we have adopted a theoretical relation based on a DM power spectrum normalization of (Bullock et al., 2001). We have also derived models based on a more recent estimate of (Macciò et al., 2008), which predict lower central DM content, but only at the level of changing by .. The DM halo is optionally “adiabatically contracted”, which is an approximate way to model the expected drag of dissipatively infalling baryons on the surrounding DM, producing a halo with a higher central DM density than in collisionless -body simulations.
The two AC recipes we use are the most common ones, from Blumenthal et al. (1986, hereafter B+86) and Gnedin et al. (2004, hereafter G+04), with the latter providing a weaker (and probably more realistic) effect. Other recipes are also available (e.g. Sellwood & McGaugh 2005; Gustafsson et al. 2006), but a more important caveat is that the entire slow, smooth-infall AC scenario may not be correct for forming cosmological structures—particularly the ETGs which may have experienced relatively violent, clumpy assembly histories. Current high-resolution simulations do suggest that the standard AC models are not accurate in detail, and that the baryonic effects on DM haloes might be highly variable and stochastic (Abadi et al., 2009; Pedrosa et al., 2009, 2010; Tissera et al., 2010; Duffy et al., 2010). For simplicity, we will consider our AC and no-AC models as representing two extreme models of galaxy formation, where the baryons have alternatively strong or weak net impact on the DM halo (cf. Lackner & Ostriker 2010).
In order to match the galaxies to their haloes, we must relate their stellar masses to their total (or virial) halo masses. We can parameterize this connection by assuming the cosmological baryonic fraction, (Spergel et al., 2007), is conserved within each halo. The stellar mass is then given by an efficiency of star formation , so that . We use a series of plausible values (e.g. Zheng et al. 2007; Brown et al. 2008; More et al. 2009; Conroy & Wechsler 2009; Moster et al. 2010; Guo et al. 2010; Lagattuta et al. 2010; Schulz et al. 2010, hereafter S+10).
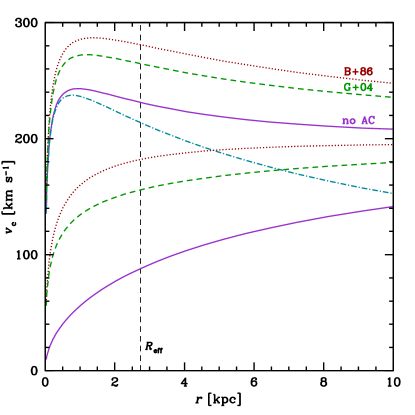
We also adopt the Kroupa IMF as our fiducial choice but consider the impact of Salpeter or Chabrier IMFs. Our model has effectively three free “parameters”: , adiabatic contraction (AC) recipe and IMF choice. Fig. 6 shows an example of a series of galaxy toy models for fixed stellar halo masses, and varying AC assumptions. It can be seen that the DM content inside 1 varies most by changing from a no-AC model to an AC model. The choice between the B+86 and G+04 recipes makes only a small difference on these scales666The AC recipe differences become more important at smaller radii, where the detailed treatment of the stellar mass profile also becomes more important, e.g. Hernquist vis-a-vis Sérsic models.. This model may seem simple, but as far as we know it has never been applied to the FP before, except for the related study of S+10 as we discuss later.
We now begin by deriving the predicted DM fraction within as a function of mass, in bins of constant age (i.e. fixing the values for a given mass), and with a number of different assumptions on and AC recipe. The results are shown in Fig. 2: it can be seen first of all that without AC, the models generally underpredict . The AC models on the other hand match the data much better on average, including reasonable reproductions of the trend with .; there is no strong preference between the B+86 and G+04 recipes. (The data clearly show a large variation around the models, part of which is just observational noise, and part of which is an important systematic variation that we will examine in Section 4.) These conclusions are IMF dependent: with a Salpeter IMF, the data points all shift downwards to lower values, and the no-AC model is preferred on average777In paper I we focussed on the Salpeter IMF and stated erroneously that the consistency of the data with our initial no-AC toy models was independent of IMF, when examining the relation between mass and mean DM density within 2 . This relation for the data is indeed unaffected by IMF changes since both the implied masses and the densities vary with the IMF. However, we neglected to consider the effects on the models, where only the predicted densities change (because the values at a fixed mass are changed: see further discussion in Section 3.2). (although there are suspicions of Salpeter not being a valid alternative: see Section 2.1).
For any fixed IMF, we see that it is a fairly generic expectation in a CDM context for to increase systematically with , and to produce a DM-driven tilt in the FP. The reason is the aperture effect mentioned earlier: the scale-lengths of galaxies’ stellar parts change more rapidly than for their haloes, causing the region to encompass increasingly large amounts of DM. This interpretation is supported by the - trends in Fig. 7 and by various FP analyses in the literature based on simulations of galaxy formation (Boylan-Kolchin et al., 2005, 2006; Oñorbe et al., 2005, 2006; Robertson et al., 2006; Hopkins et al., 2008; Covington, 2008). A similar point from an observational basis is made by Fig. 5 of Humphrey & Buote (2010), and we include their results for comparison in Fig. 7; here the absolute values of cannot be readily compared since their values come from the -band and should be systematically different from ours in the -band, but their general trend with size seems comparable to ours. The role of in more model-dependent DM scalings is considered further in Section 3.2.
Systematic trends in can affect the slope of - in either direction, but the effect is fairly weak. Even for a factor of 7 change in assumed halo mass, changes only by 0.1; i.e. large changes in overall halo mass do not translate to large changes in central DM content. To cancel out the DM-induced tilt, would have to systematically increase with mass, which goes in the opposite direction to conventional findings, wherein the most massive systems have the highest virial . If the FP tilt turns out to not be driven by trends (as found in Trujillo et al. 2004; Jun & Im 2008; Allanson et al. 2009), then this would be inconsistent with vanilla CDM expectations (i.e., where central DM densities scale slowly relative to the observed stellar densities).
3.2 Dark matter profiles
We next consider some interesting implications for DM density profiles with radius. It is notoriously difficult to determine the DM content in the centres of ETGs, and scant few studies to-date have been able to compare the empirical DM properties to CDM theory. T+09 and paper I (Fig. 14) have found mean central densities for DM haloes that scale with mass roughly as expected for NFW haloes. Here we add the finding that the DM content also scales (to first order) with galaxy size as expected.
We will see in Section 4.1 that much of the observed -age anti-correlation can be traced to the -age anti-correlation—implying that our CDM toy models are at least roughly correct. This point is illustrated more clearly in Fig. 8, where for one example mass bin, the stellar mass has been subtracted from the total mass, and the residual DM content is quantified as the mean value within , 888Note this is different from the analysis of Graham et al. (2006b) who looked at inside the effective radius of the DM rather than of the stars. Their derived slopes reflect the steeply declining outer regions of the DM haloes, while ours involve the central regions..
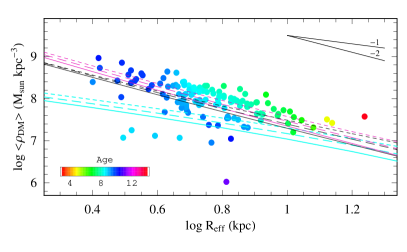
By measuring the DM content of individual galaxies with similar masses at different radii, we are effectively able to map out a mean DM density profile over a factor of 3 in radius. This trick of studying composite profiles is formally valid only if the binned galaxies all have approximately the same DM profile—as might be the case for a no-AC NFW model. The condition is clearly violated for models that include AC since the contraction varies among the differently-sized galaxies. However, the impact of this non-homology is reasonably small as discussed further below, such that we can get an approximate idea of the DM slopes, as well as more firmly test the null hypothesis of a universal NFW profile999One might suspect that at some level we are getting out what we are putting in, since our default dynamical models used in deriving assume an total density profile in order to extrapolate the measurements to . However, we have confirmed that using the alternative constant- profile yields similar results ( unchanged for Salpeter IMF, and steeper by 0.1–0.2 for Kroupa IMF). A galaxy sample with direct mass constraints nearer to (e.g. C+06; Auger et al. 2009; Graves 2009) would be ideal for pursuing the density profile analysis more robustly. We have also checked that these results are not sensitive to the stellar populations models (Appendix B.3). .
The first point to notice from Fig. 8 is that the data for and (see Fig. 7) have opposite trends versus , which turns out to be crucial evidence for cuspy DM haloes on scales of 2–15 kpc. As increases for a fixed galaxy mass and halo profile, the amount of enclosed DM and therefore both increase. On the other hand, the local DM density of a cuspy halo decreases with radius, so a larger means a smaller .
More quantitatively, we may consider a general power-law density scaling for the central DM halo, . For , and therefore . For an uncontracted NFW halo, at the smallest radii, but near in our toy models, 1.1–1.3 (steeper for higher masses because of their larger radii; see also Graham et al. 2006a). AC effectively makes the DM even cuspier, with 1.6–1.8 for the G+04 recipe, and 1.8–1.9 for B+86 (see also Fig. 6). The effect of constructing composite profiles from non-universal haloes is for the apparent slopes to be steeper by . This offset can be subtracted from the observational results to estimate the true slopes (see below), while more rigorous tests are made by constructing composite toy models for comparison to the data.
Our observational results for a Kroupa IMF are illustrated by Fig. 8 (top). The vast majority of the data points in this fixed mass bin do appear to clump around a common DM mass profile, with a composite slope of (so we may infer a true slope of ). A small minority of galaxies may follow a shallower trend, with a residual trend of DM fraction versus age that is barely visible by the colourisation of the data points (to be discussed in Section 4.1). The results for the other mass bins are similar, with –2.1, and suggestions of a shallower slope with increasing mass (see Fig. 9), although it is hard to tell for sure since the exact slopes are sensitive to the details of the fitting procedure101010A fair amount of attention in the literature has been focussed on the slopes of total mass profiles rather than the DM slopes discussed here (e.g. Jiang & Kochanek 2007; Koopmans et al. 2009; Nipoti et al. 2009; Humphrey & Buote 2010). We have not made comparisons in detail, but our toy models imply total slopes at of 1.8–2.2, becoming shallower with increasing mass. This trend is driven mostly by the stellar density becoming shallower, and is affected little by AC..
We also construct NFW-based model predictions as in Section 3.1 and show them in Fig. 8. The steep slope for the majority of the points, along with the shallower slope with increasing mass, turns out to correspond nicely to a range of NFW+AC models111111The overall DM density shows a tendency to increase with mass, relative to fixed- models (see paper I), so the overall connection between AC and mass is not yet clear., with a minority of points consistent with uncontracted NFW haloes. The model interpretations are somewhat degenerate to systematic variations of with (e.g. S+10 suggest an anti-correlation, which would imply the intrinsic slopes are steeper than they appear). However, as seen in Fig. 8, the effects are fairly small, and overshadowed by our fitting uncertainties anyway.
The - relation is not a knock-down confirmation of CDM but intriguingly it does seem to weigh against alternative models. If there is no DM, then of course we should have , although there might be a systematic error in the mass analysis, e.g. with the IMF. In this more general case we expect , and the apparent to be constant with age and —in strong contradiction to the data.
The same argument may apply to, and pose a challenge for, alternative gravity theories that seek to explain observational mass discrepancies at large galactic radii, usually in spiral galaxies (e.g., Brownstein & Moffat 2006; Frigerio Martins & Salucci 2007). It is beyond the scope of this paper to consider any of these theories in detail, but we will briefly comment on the most well studied case of Modified Newtonian Dynamics (MOND; e.g. Tiret et al. 2007; Sanders & Land 2008; Ferreras et al. 2009). In this formalism, there is a characteristic acceleration scale cm s-2, above which mass discrepancies should be weak or nonexistent. In the central regions of the ETGs studied here, the accelerations are large and the dynamical mass should agree well with the inferred stellar mass.
Our observed mass discrepancies, along with the striking dependencies, would at first glance appear to rule out MOND without DM in ETGs, which might be related to similar results in galaxy groups and clusters (e.g. Sanders 2003; Pointecouteau & Silk 2005; Angus et al. 2008; Richtler et al. 2008). However, we cannot make a definitive statement without carrying out a careful MONDian analysis (see also Fig. 19 in Gerhard et al. 2001, hereafter G+01; preliminary findings in Romanowsky 2006; and forthcoming results in Cardone et al. 2010). In particular, the systematic uncertainties in our and estimates must be taken into account, along with possible fine-tuning of the “interpolation function” between the Newtonian and MONDian regimes (cf. McGaugh 2008).
If there are DM haloes with cored profiles (e.g. Burkert 1995; Saxton & Ferreras 2010), then would still increase with , but should be constant (). Again, using the wrong IMF could contribute an effect, which in combination with a constant DM core could produce a shallower than trend—but experimenting with IMF adjustments, we cannot recover a constant-core trend.
Any of these scenarios could still be salvaged with epicycles, e.g. with systematic errors that correlate with galaxy size, but Ockham’s razor suggests the first conclusion should be to prefer a standard cuspy DM model. Note that detailed dynamical models of individual galaxies have difficulty uniquely decomposing the stellar and DM mass profiles and thereby distinguishing between cored and cusped DM haloes (cf. T+09; Napolitano et al. 2009, hereafter N+09). Our approach that includes stellar populations modelling in a large galaxy sample provides the first clear (albeit indirect) constraint on the central DM profiles of ordinary ETGs.
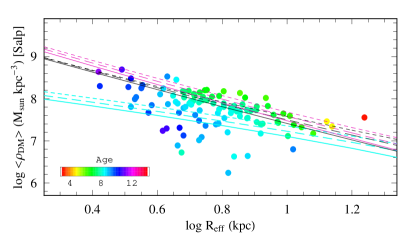
Before moving on, we consider the Salpeter IMF alternative, with data and models for the sample mass bin shown in Fig. 8 (bottom). The data are seen to typically lie in between the AC and no-AC models, with a slope of . Unlike the Kroupa case where both the amplitude and the DM density slope match the AC models nicely, the Salpeter case shows less overall consistency with a simple CDM model—although a caveat is that the frequent cases with apparent negative DM densities can make the results difficult to interpret.
3.3 Context and comparisons
There are several recent observational analyses of DM in galaxies that are relevant to our current study: we will make some comparisons first to studies of ETGs, and then to other galaxy types. We begin with two papers that are very similar in spirit to ours, as they combine estimates of total masses and stellar populations-based masses to derive central DM constraints in large samples of elliptical galaxies, and to compare these to CDM-based toy models.
T+10 studied a sample of strong gravitational lenses, using a combination of lensing and dynamics to derive the total masses. They found that a Salpeter IMF is generally consistent with a no-AC model, as did we. They did not consider AC models explicitly, and it seems very likely that (as we have found in this paper) lower-mass IMFs would be favoured if AC were included.
These authors also found indications of systematic changes with galaxy mass that could be interpreted as a change either in IMF, or in the DM density slope such that it steepens with mass ( increasing). The latter effect as they mention could be due to AC becoming stronger with mass, and appears to go in the opposite direction of our results. It is beyond the scope of this paper to track down the reasons for this difference (their study did probe somewhat different regimes of radius and mass).
S+10 derived their total central masses from stellar dynamics, and used weak gravitational lensing to derive the total halo masses and concentrations (which we have had to assume in our models121212The direct mass-concentration results of S+10 follow well the theoretical expectations for a WMAP5 cosmology (Macciò et al., 2008), although one might expect ETGs to be systematically biased toward higher-concentration haloes.). Assuming a Kroupa IMF, they found relatively high central DM masses which they showed to be nicely consistent with G+04 AC models when breaking the sample down into several bins in mass and in size (the latter test being implicitly equivalent to our plots of versus as an alternative test of the DM profiles). Their large-radius constraints also allowed them to determine a correlation between size and virial mass at fixed , which in the context of our formalism implies an anti-correlation between and . If their sample has an -age anti-correlation as in our sample, then this would imply an -age correlation. We will come back to this point in Section 4.1.
In addition to the qualitative consistency of the S+10 results with ours, their quantitative DM fractions of typically 0.6–0.7 can be compared to ours over the same mass range [ 10.8–11.6] where we find 0.4–0.6. This small difference might be accounted for by their sample selection of only round “central” galaxies—which are plausibly more DM-rich than flattened, satellite galaxies. These authors do note that their results seem to be somewhat high compared to other literature studies with 0.3–0.5 (C+06; Gavazzi et al. 2007; see also G+01; T+09).
Jiang & Kochanek (2007) analyzed a sample of galaxies using strong lensing and stellar dynamics, and CDM mass models similar to ours. Using priors on either (equivalent to a Kroupa IMF) or total masses from weak lensing (Gavazzi et al., 2007), they find that an AC model with is preferred. The strong+weak lensing analysis of Gavazzi et al. (2007) on the other hand found consistency with a no-AC model.
T+09 constructed detailed dynamical models of Coma cluster ETGs, where and were determined simultaneously from the dynamics, assuming a parameterized DM model. They found relatively high DM densities (similar to ours), which they compared to cosmological semi-analytic models (using no-AC models for spirals as an additional constraint, and adopting cored DM halo models for the ETGs which in this context tend to under-estimate the central DM densities). They concluded that B+86 AC haloes were preferred over no-AC.
Humphrey et al. (2009) used X-ray emission from hot gas surrounding a small sample of massive ETGs to constrain their mass profiles using CDM-motivated models. With a Kroupa IMF, they found that no-AC models were preferred (although with somewhat high concentrations). One of their sample galaxies was also the subject of a detailed dynamical study using stars and globular clusters (Shen & Gebhardt, 2010), whose mass results were systematically higher and might very well be consistent with an AC model. This appears to be part of a significant unresolved tension between dynamical and X-ray mass results. On the other hand, other X-ray studies find surprisingly high DM concentrations for galaxy groups (Buote et al., 2007; Duffy et al., 2008), which should generally overlap with the massive end of our ETG sample, and might support our finding that AC models are preferred.
Lackner & Ostriker (2010) used toy models for “dissipationless” and “dissipational” ETG formation which should be roughly equivalent to our no-AC and AC models. Adopting the C+06 values assuming a Kroupa IMF, they found that both types of models predicted too much DM in the galaxy centres. This disagrees with our conclusion that AC models predict about the correct amount of DM, and no-AC models not enough. Although there are some differences between our observational results and those of C+06 (see Appendix B.3), it may also be that Lackner & Ostriker did not allow for enough freedom in their halo masses and concentrations to fit the data. Our own preliminary analysis of the C+06 data suggested that a G+04 AC model would work well on average (Romanowsky, 2006).
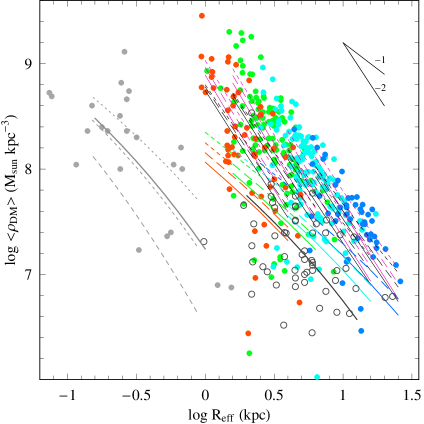
We next consider our ETG results in relation to other galaxy types, showing density-size relations for different ETG mass bins, along with data from other galaxy types in the literature, plotted together in Fig. 9. We first of all consider 56 late-type galaxies from McGaugh et al. (2007), where dynamical masses were measured by classical rotation curves, and stellar disk masses by various methods including stellar populations modelling. We take results from the latter (with Kroupa IMF) and then infer the DM densities within , which we define as , where the disk scale-length is taken from various literature sources such as McGaugh (2005).
We plot these late-type galaxies in Fig. 9, and see that their DM haloes are times less dense than those of early-types at the same radii. Qualitatively similar conclusions were reached by G+01 and T+09, while we add the observation that the DM density slopes are different: the late-types have shallower slopes than the early-types ( versus ). The ETGs could be brought into closer consistency with the late-types if a Salpeter IMF were adopted for the former, but if anything a reverse IMF trend might be expected a priori (as we will discuss further in Section 4.4).
We also show in Fig. 9 a sample CDM model curve for the late-types, for the case of , and no AC. This curve is very similar to the equivalent one for the lowest-mass bin of the ETGs, so for clarity we do not show additional model curves for the late-types (whose AC model curves should differ slightly from the ETG curves). The no-AC model appears to be preferred for the late-types131313However, McGaugh et al. (2007) among others found that CDM no-AC models do not match the data in detail, with cored DM halos being preferred. Note that if these haloes do have constant-density cores, then there is less concern about selecting the fairest radius for comparing their densities to ETG haloes., echoing the conclusions of many other studies (Kassin et al., 2006; Dutton et al., 2007; McGaugh et al., 2007; Gnedin et al., 2007; Xue et al., 2008)—and contrasting with the inference of AC for the early-types when the same IMF is adopted.
We next consider dwarf spheroidals belonging to the Milky Way, from the compilation of Walker et al. (2009) (cf. the alternative compilation of Wolf et al. 2010). This study extended upon earlier work that found a common DM mass within a fixed physical radius (Strigari et al., 2008) and suggested that these systems share a common “universal” DM profile with (see also Peñarrubia et al. 2010). Plotting their data in Fig. 9141414The values in Walker et al. (2009) appear to be total mass including baryonic contributions, but this should be only a 10% effect., we note first of all that the dwarf haloes do not appear to join up naturally with those of more massive galaxies (cf. McGaugh et al. 2010), and we infer that sampling a limited range of galaxy type, mass, and radius can readily produce the impression of a universal profile. This conclusion is bolstered by our overplotting of a CDM toy model for the dwarfs (using a fiducial stellar mass of , Sersic index and ; a model with AC is very similar because of the DM dominance). For a factor of 10 variation in halo mass, the central DM densities change by only a factor of 3, which is less than the scatter in the data.
Finally, motivated by the work of Donato et al. (2009) who claimed a universal DM projected density for all galaxy types and masses (see also Kormendy & Freeman 2004), we calculate our own approximate DM surface density from the data points in Fig. 9 by multiplying by , and showing the results versus stellar mass in Fig. 10. Although our results are calculated within galaxy rather than the DM core radius as in Donato et al., we reproduce their results reasonably well, finding a fairly constant surface density on average across a large mass range of dwarfs and late types, but also suggesting a systematic increase with mass as found by Boyarsky et al. (2009).
It is beyond the scope of this paper to consider CDM theoretical predictions for the surface density in detail (cf. Zhao et al. 2008; Macciò et al. 2009; Koposov et al. 2009; Li et al. 2009; Okamoto & Frenk 2009; Boyarsky et al. 2009; Cooper et al. 2010; Stringer et al. 2010). However, the broad consistency of the uncontracted NFW models with the dwarf and spiral data in Fig. 9 suggests that the surface density result is not particularly surprising within the standard paradigm, and does not necessarily imply cored DM haloes.
We also find from Fig. 10 that the ETG galaxies violate the constant density scenario for the other galaxies by a factor of 10 on average, and a factor of 5 in the same mass regime. This disagrees with the conclusions of Donato et al., and we note that their ETG results were based on a weak lensing analysis rather than central dynamical results equivalent to those used for the other galaxies. Other ETG dynamical results from the literature support ours (G+01; T+09; Boyarsky et al. 2009; see also the strong lensing analysis of Cardone, Angus, & Tortora 2010).
In summary, we can synthesize the constraints on the central DM content of all types of galaxies assuming a universal Kroupa IMF, based on our study and on the literature. We conclude that the early-type and late-type galaxies are broadly consistent with simple CDM predictions with and without AC, respectively.
The main exceptions to this emerging consensus are from X-ray studies (see above) and from the only compilation of large-radius dynamical results (N+09), which suggests very strong systematic AC differences among the ETGs. However, as discussed in Appendix B.2, selection effects are suspected for the latter study. We postpone further discussion of the implications of our DM results for galaxy formation to Sections 4.3 and 4.4.
4 Interpreting trends with age
At last we arrive at an analysis of the age trends. We provide an overview of the observations compared with basic CDM toy models in Section 4.1. We then attempt to explain the age trends by the systematics of DM halo concentrations (Section 4.2), AC variations (Section 4.3) and non-universal IMFs (Section 4.4).
4.1 Overview of trends
As previously mentioned, the variations in at fixed appear to correlate with age, and comparison with the models in Fig. 2 suggests that plausible systematic variations in with age would not be enough to account for the trends in the data. To see this more clearly, we construct models of versus age in fixed mass bins, comparing these with the data in Fig. 11 (keeping in mind that we expect some scatter in the data points from observational errors and from the necessary inclusion of a range of masses in each mass bin).
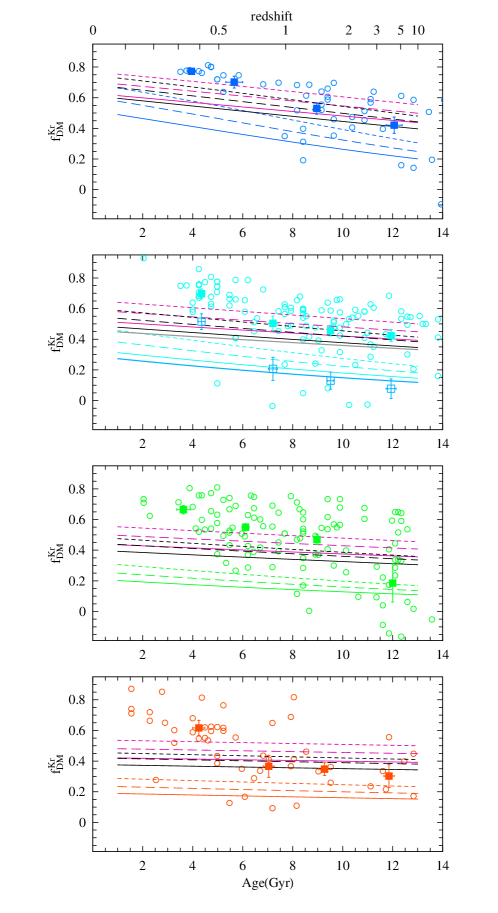
Both data and models agree that decreases with age at fixed mass, which can be seen as a natural consequence of the – trends151515Shankar & Bernardi (2009, hereafter SB09) also found a similar trend of excess dynamical mass with age, which they stated as driven mainly by the variations. However, they did not demonstrate this conclusion explicitly, nor did they connect to specific DM models.. However, the data in every mass bin show even steeper age trends than predicted by the models—particularly if we adopt models with AC, a process that couples the DM to the baryons and partially counteracts the trend for small stellar sizes to produce small (i.e. relative to uncontracted haloes, it leads to a shallower trend of with age). The difference in slope between the data ( Gyr-1) and the simple models ( Gyr-1 for AC, Gyr-1 for no-AC) suggests a systematic variation with age of the DM itself. After correcting for the effects of (in an inevitably model-dependent way), we support our initial conclusion from Section 2.2 that the central DM content is connected more closely to age than to mass, since varies with age by up to 0.3 relative to the model curves, and by only 0.1 with mass.
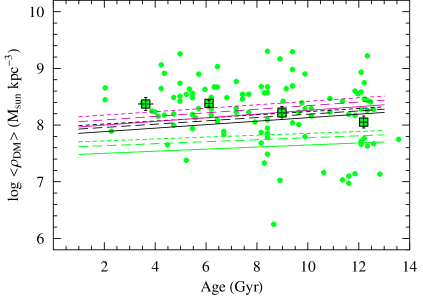
We illustrate the effect of age in a different way in Fig. 12 by plotting the mean central DM density versus age, for both data and models in one mass bin. Because of the anti-correlation of with age, the models predict a slight increase of with age. However, the data show a decrease (also apparent from the colourisation in Fig. 8), consistently with the results based on .
One obvious candidate to explain the DM-age trends would be , such that the younger galaxies simply have more massive DM haloes overall. This scenario might be expected given cold-mode accretion at high- (Dekel et al., 2009a), where star formation is thought to proceed very efficiently; subsequent halo growth would have to include infall material with high in order to not overly dilute the net at low-. However, although it is plausible that an -age correlation contributes to the trends161616S+10 found for a sample of low- ETGs that halo mass correlates with at fixed stellar mass, by a factor of 1.5–2 in mass. If anti-correlates with age in their sample as in ours, then correlates with age., we suspect it is probably not the dominant factor. From examining Figs. 11 and 12, systematic variations of a factor of 10 or more in at fixed would be required. While there has been a great deal of attention given to associations of galaxies with halo masses on average, there has been much less work on the scatter in the trends. It is outside the scope of this paper to investigate the plausibility of order-of-magnitude variations, but the new work of More et al. (2010) suggests a scatter in virial of factors of only 2–5 for non-satellite ETGs (increasing with ).
4.2 Concentration variations
We next consider possible connections between DM profiles and age, such that the amount of DM within is not directly coupled to the total halo mass. First of all, our NFW toy models assumed the exact same mass-concentration relation for all galaxy haloes. However, this should really be a mean trend whose intrinsic scatter correlates with the redshift of halo collapse , since halo density basically reflects the background mass density of the universe at the time of collapse.
This concentration-age systematic can immediately be seen to go in the wrong direction to explain the -age data, if we make the reasonable assumption that stellar age correlates at least weakly with the assembly age of the DM halo. Older galaxies should therefore have higher and because of their denser, earlier-collapsing haloes171717The stellar component could very well also be denser in older galaxies, but we are already accounting for this effect by including the -age relations in the toy models..
To illustrate this issue more quantitatively, we construct a modified version of our CDM toy models. We begin with the simplest assumption that the age of a galaxy’s stars is directly associated with its halo’s . This is clearly not correct in general since in the modern picture of “downsizing”, the star formation in massive galaxies largely precedes the DM assembly, and vice-versa in less massive systems (e.g. Fig. 5 of Conroy & Wechsler 2009). However, it is beyond the scope of this paper to consider differential assembly histories at fixed final mass, so for now we will adopt our simple prescription as stated above.
To a good approximation, haloes of all masses and at all times “collapse” with a fixed concentration of ; the subsequent concentration evolution is basically mediated by the expansion of the universe. If a halo collapsed at , then at its concentration will be with a scatter of 0.05–0.06 (see Wechsler et al. 2002; Macciò et al. 2008).
This line of argument implies that all galaxies with the same stellar age have the same halo concentrations, independent of mass. Certainly this is an oversimplified picture and might be undermined by late, minor gas-rich mergers biassing the inferred stellar ages. For now we will adopt this model as an ansatz and see where it leads us, with predictions illustrated by the model concentration-age bands in Fig. 13.
To derive estimates from the data for concentrations, we proceed as follows. First, we collect the individual galaxy results into bins of age and stellar mass, calculating the average values (similar to Fig. 11). We then fit our CDM toy models (Section 3.1) to the data. Given a fixed IMF and DM profile (NFW with or without AC), the remaining free parameters are now and . We fix to be constant in each mass bin, and set it to a value that forces the average (including all ages) to approximately agree with the theoretically predicted mean value. Note that for models with AC, the value denotes the “original” concentration after correcting the observations for AC.
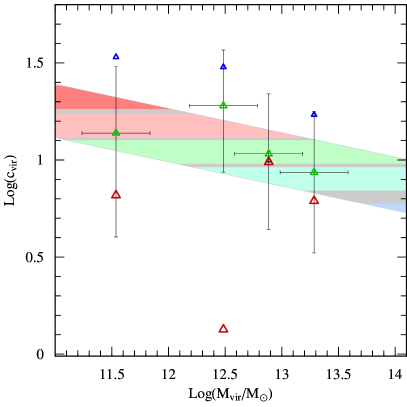
The results of this fitting exercise for a Kroupa IMF and G+04 AC prescription are overplotted as data points in Fig. 13. To reproduce the mean - relation, we find for the lowest mass bin, and for the others; it is noteworthy that such a simple, plausible CDM-motivated model can be constructed to agree with both central and global DM constraints for ETGs.
Now considering the age dependencies, we see that there is a clear trend for older galaxies to have less concentrated haloes—an effect that is diametrically opposed to our assumed trend for star formation to mimic halo collapse. If taken at face value, these concentration results would imply that ETGs on average formed their stars not long after their haloes collapsed ( versus ), but the late-collapsing haloes tended to form their stars very early ( versus ) while the early-collapsing haloes formed their stars very late ( versus )—although these latter trends are more apparent for the low-mass galaxies. We are not aware of any physical mechanism that would produce such counterintuitive variations at a fixed mass, and we suspect that concentration effects do not explain the observed DM-age trends. These conclusions are similar when adopting a Salpeter IMF with no AC.
4.3 Adiabatic contraction
The next alternative for systematic differences in the DM profiles is that the radial profiles have been systematically affected by baryons in different ways. The simplest picture in this context is for AC strength to vary with age. We do not explore this effect in detail, but refer to Fig. 11 for a qualitative understanding. If the IMF has a slightly higher mass normalization than Kroupa (or if the values are somewhat lower than the range adopted so far), then the youngest galaxies are consistent with the B+86 AC recipe, with AC strength decreasing with age until the oldest galaxies have had no AC. Variations in would then play a minor role in the central DM trends. In principle, we could confirm this interpretation by examining the radial profiles for different age bins, but the data are currently too noisy for this purpose.
Is there any theoretical reason to expect AC to correlate with stellar age in this way? Or more generally, since we do not directly confirm the AC models, why should the DM be preferentially shifted away from the centres of “older” galaxies, and towards the centres of “younger” galaxies, by baryonic effects? One possibility concerns the smoothness of baryonic infall: the standard AC model is motivated by smooth gaseous dissipation, while clumpier collapse—both in the baryons and in the DM—is expected to diminish or even reverse the contraction because of “feedback” from dynamical friction (e.g. Debattista et al. 2008; Romano-Díaz et al. 2008; Jardel & Sellwood 2009; Johansson et al. 2009).
Alternatively, more direct baryonic feedback could occur via outflows from AGNs and supernovae, potentially puffing up the DM halo (e.g. Binney et al. 2001; Mo & Mao 2004; Mashchenko et al. 2008; Peirani et al. 2008; Governato et al. 2010; Duffy et al. 2010). The notion of feedback effects on DM haloes is becoming commonplace, but the puzzle here is how to explain a systematic trend with time. Realistic simulations of galaxy formation including baryonic processes are only now becoming powerful enough to investigate such questions in detail.
One specific scenario worth special mention is the emerging paradigm of high- massive galaxy formation by cold streams of DM and baryons (Dekel et al., 2009a, b; Agertz et al., 2009; Kereš et al., 2009a, b). The clumpiness of the infall in this picture could effectively bypass the contraction process (as proposed by Elmegreen et al. 2008). These “wild disk” galaxies are though to initially form hot stellar disks and bulges in situ, and then evolve into low- ellipticals, S0s, and early-type spirals—whether by passive fading or by eventual merging (Conroy et al., 2008; Genel et al., 2008).
We would like to connect the DM-age trends for ETGs with the impacts of physical processes in the cosmological context of galaxy formation. To begin doing so, let us first consider even broader questions relating the different types of massive galaxies. As discussed in Section 3.3, our initial assessment of low- galaxies is that the early-types have haloes with AC, and the late-types without AC. This type difference is not simply an age difference since among the ETGs, younger galaxies appear to have stronger AC. These observations raise an interesting cladistical question: if ETGs are generally formed in the mergers of spirals per the conventional wisdom, do they have roughly the same central DM densities? Also, if the most massive ETGs are assembled by dry mergers of smaller ETGs, are their respective DM densities consistent with this picture?
A related problem was raised long ago for the stellar densities of galaxies. It is well known that in the merger of collisionless systems, the phase space density cannot be increased, but observationally the central stellar values of ETGs are much higher than those of spirals (Carlberg, 1986; Hernquist et al., 1993; Mao & Mo, 1998). This puzzle was solved by taking into account the dissipational infall of gas during a merger, forming new stars in a high-density central starburst (e.g. Kormendy & Sanders 1992; Bekki & Shioya 1998; Springel 2000).
Returning to the DM issues, the 6D density is of course not the same as the 3D density , or 2D , but we will not carry out a rigorous analysis of here181818We have attempted rough estimates of the coarse-grained phase-space density via (e.g. Dalcanton & Hogan 2001), but the results are very sensitive to how the DM dispersion is handled, and will require more careful analysis.. Instead, noting that discrepancies involving tend to be associated with and problems, we will take a very simplified approach of conserving mass: the amount of central DM in a merger remnant should be roughly equal to the sum of the progenitors’ central DM (e.g. Boylan-Kolchin & Ma 2004; Kazantzidis et al. 2006).
The observed DM density differences between early- and late-types appear from Figs. 9 and 10 to be factors of 5. However, in this context the figures are difficult to interpret because the two galaxy types occupy an almost disjoint region of - space. Comparison of the small samples of overlapping objects in this space indicate the real density differences may only be 2 on average.
We illustrate the trends in a different way in Fig. 14, where the mean densities are plotted against stellar masses, in bins of similar physical radius. The simplest expectation here for galaxy mergers is that the DM density within the same radius grows linearly with mass, which the Figure shows is borne out remarkably well if considering the spirals as the progenitors of the ETGs. The full story is more complicated, as the true ETG progenitors are thought to have been high- gas-rich systems with dense DM haloes (e.g. discussions in Section 4.2 and in G+01 and T+09). Also, there are potential effects in the mergers that could raise or lower the densities relative to the linear relation. A detailed theoretical exploration of DM density changes in mergers would be a useful contribution at this point, using also the constraint that the ETG haloes appear cuspier than those of the spirals. However, we can conclude that so far there does not appear to be an obvious problem in generating ETG halo densities from late-type progenitors.
Now returning to the DM trends with age in the ETGs, progenitor bias seems an unlikely explanation. Higher DM densities in the early progenitors would produce the opposite low- correlations to what we observe, and furthermore current observations of candidate high- progenitors indicate relatively low central DM content, similar to low- spirals (Burkert et al., 2010).
Instead, the possibility then remains that halo contraction or expansion is a strong function of . The scenario would be for halo contraction to become more important for ETGs that formed at later times, perhaps in a transition from the cold stream phenomenon discussed above, to a more merger-dominated evolution that produces stronger contraction. Early, strong feedback might also play a role.
An additional effect to consider is dissipationless merging of ETGs: with repeated dry mergers, the initially segregated stellar and DM profiles should eventually converge to a well-mixed NFW-type profile for the total mass, implying a net migration of DM toward the galaxy’s centre. One might surmise on this basis that older galaxies would have increased central DM content because of their longer post-star-formation period of merging. The simulations of Ruszkowski & Springel (2009) highlighted the effect of augmentation through dry merging. However, the main driver here may be the aperture effect due to the merger-induced growth (as the results of Boylan-Kolchin et al. 2005, 2006 suggest), rather than a significant evolution of the DM profile itself.
4.4 Initial mass functions
After exhausting a litany of possibilities for DM properties to vary with age, we consider the alternative that our DM inferences are wrong because we have assumed a universal IMF when estimating the stellar values. The implication would then be that the IMF varies systematically with stellar age, in the sense that younger galaxies have a higher-mass IMF: i.e., they have more stellar mass for a given luminosity, so the high dynamical observations are due not to excess DM but to higher . In this context, when we couch the IMF in terms of “Salpeter” and “Kroupa”, we will not literally mean the same detailed IMF shape as those functions, but rather an equivalent overall normalization.
The subject of IMF variations is highly controversial and unresolved: for a review see Bastian et al. (2010). There are theoretical reasons to expect lower-mass IMFs for stellar populations that formed in the early universe (Larson, 2005; Klessen et al., 2007), and observational suggestions for IMFs to be lower-mass at higher (e.g. van Dokkum 2008; Davé 2008; Holden et al. 2010). These ideas would fit in well with the IMF-age trend we suggest above. All these results might further be consistent with suggestions that the IMF becomes more top-heavy at higher SFRs (Weidner & Kroupa, 2006; Calura & Menci, 2009; Haas & Anders, 2010), since SFRs should have generally been higher at earlier times. Similarly, the more compact nature of the older ETGs might imply higher gas densities in the star-forming epoch, which has also been suggested to produce more top-heavy IMFs (Lee et al., 2004; Meurer et al., 2009; Krumholz et al., 2010).
To be more quantitative about the implied IMF variations, we construct a simple ad hoc model as follows. First we derive an average - trend based on the data (Fig. 2), and for each individual galaxy, solve for the value that would agree with this trend (given its individual value). This value can be expressed relative to the observed Salpeter-based value by a fraction (cf. T+10). The result of this exercise is shown in Fig. 15: we see a clear trend for the data to require a decreasing IMF mass with age, which we roughly parametrize by a linear function of versus age.
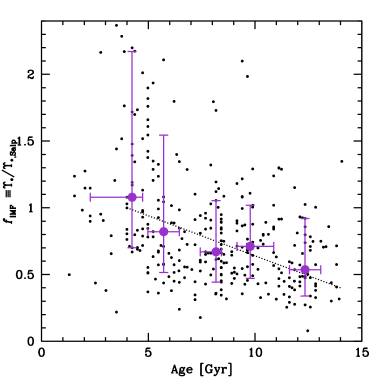
Given this new IMF assumption, we then re-derive some of our DM inferences. First we show the revised -age trends in Fig. 16. As intended by construction, the data show roughly constant DM fractions with age in fixed mass bins (and the galaxies with Salpeter IMFs are not in danger of being unphysical since these were the ones with apparently large to begin with). As we have seen earlier, the -age trends cannot be immediately interpreted without folding in the -age dependencies. Upon investigation, we find that with the varying IMF assumption, the strong -age anti-correlations (Fig. 5) have disappeared, so that there is on average no correlation.
We find it a remarkable coincidence that the same IMF model removes the age trends in both and . This finding suggests that a systematic IMF variation could be real, and that it might account in part for the apparent trends with age and redshift of galaxy sizes (as suggested by Muzzin et al. 2009). Note that with our (somewhat arbitrarily chosen) variable IMF, the observations are now generally consistent with AC halo models.
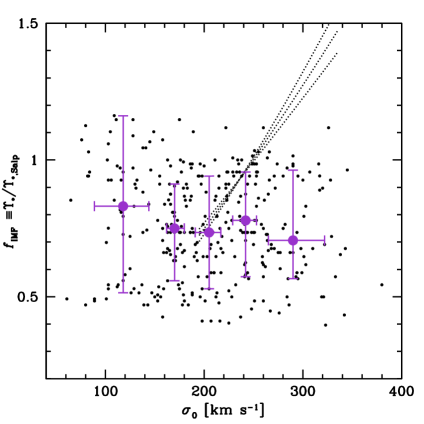
Given the opposing correlations of age with and (Fig. 3), we might expect an anti-correlation between and . We do see a weak suggestion of this effect, which is a bit clearer when considering versus (Fig. 17). This result appears inconsistent with the strong positive - correlation found by T+10. However, these authors did not allow for AC in their models, which may impact their conclusions.
As mentioned above, there are reasons to expect an IMF-age trend for ETGs qualitatively similar to our toy model interpretation. (Further analysis would be required to check for problems involving FP twisting with redshift; cf. Renzini 2006.) Now considering also late-types as relatively young, low-SFR, low-density systems, we would expect their IMFs to be more bottom-heavy (high ). Mergers of these systems to form the younger present-day ETGs would then also be expected to result in bottom-heavy IMFs, which is qualitatively consistent with the trend from Fig. 15, but might be in conflict with IMF constraints in low- galaxy disks.
5 Conclusions
We have continued an analysis begun in paper I of a large data-set of nearby early-type galaxies (ETGs), combining dynamics and stellar populations to constrain the central DM content. After having identified variations in DM as the main cause of the tilt of the fundamental plane, we have moved on to consider various scaling relations of the DM haloes, and connections to the star formation histories of the galaxies.
Our basic observational findings are that the central DM fraction within an effective radius has a strong anti-correlation with stellar age, and that the galaxy sizes also have an age anti-correlation. We have constructed composite profiles of DM density with radius, finding that they are on average cuspy, with inferred density exponents of near . These profiles are steeper than literature findings for spiral galaxies, and the central DM densities of the early-types are denser overall, suggesting that gas-rich mergers would need to produce a net halo contraction.
To further interpret the data, we have generated a series of CDM toy models, including variable contributions from adiabatic contraction (AC).
The results from comparisons of models to data are:
-
•
Models with AC fit well overall with a Kroupa IMF, while models without AC prefer a Salpeter IMF.
-
•
The size-age trends can explain part of the -age trends: older galaxies show less evidence for DM because their more compact stellar centres probe less volume of the DM halo.
-
•
The remaining -age trends are not easily explained by variations in halo mass or concentration, and suggest differences in baryonic effects on the DM, in the sense that younger galaxies have undergone AC while older galaxies have not.
-
•
An alternative scenario is for the IMF to be less massive for older stellar populations.
There is ample scope for future insights and improvements. We plan to further investigate the galaxies’ star formation histories in the context of theoretical mass assembly histories. Environmental trends can be investigated, as these are expected to be important (e.g. Thomas et al. 2005; Wechsler et al. 2006; Rogers et al. 2010; Niemi et al. 2010; La Barbera et al. 2010b). Forthcoming high-quality, homogeneous, multiwavelength large surveys of low-redshift ETGs should also be able to refute, confirm or extend the trends presented here (Graves, 2009; Cappellari et al., 2010). Finally, the gold standard for probing galaxy mass profiles is extended kinematics data along with detailed dynamical modelling—both to provide more leverage on the DM independently of the stellar mass, and to sift individual galaxies for the presence of a DM core or cusp (e.g. Thomas et al. 2007; de Lorenzi et al. 2009; Weijmans et al. 2009; Forestell 2009).
Even if some of our current conclusions turn out to be completely wrong, we hope to have introduced a useful framework for interpreting mass results for large data sets of ETGs over cosmic time. The DM constraints are part of a spectrum of clues that can ultimately be combined to pin down the modes of ETG formation (e.g. Covington et al. 2008). Other avenues with considerable promise include central rotation (Jesseit et al., 2009), extra light (Hopkins & Hernquist, 2010) and orbital structure (Burkert et al., 2008), as well as halo rotation (Hoffman et al., 2010) and metallicity gradients (Weijmans et al., 2009; Foster et al., 2009), and globular cluster constraints (Rhode et al., 2007; Shin & Kawata, 2009; Bekki, 2010).
Acknowledgements
We thank Stacy McGaugh for providing his data tables in electronic form, and Surhud More and Frank van den Bosch for sharing their paper in advance of publication. We thank Nate Bastian, Michele Cappellari, Jürg Diemand, Aaron Dutton, Gianfranco Gentile, Alister Graham, Brad Holden, Mike Hudson, Fill Humphrey, David Koo, Claire Lackner, Stacy McGaugh, Joel Primack, Tommaso Treu and Mike Williams for helpful discussions, and the anonymous referee for constructive comments. AJR was supported by National Science Foundation Grants AST-0507729, AST-0808099, and AST-0909237. CT was supported by the Swiss National Science Foundation and by a grant from the project Mecenass, funded by the Compagnia di San Paolo.
References
- Abadi et al. (2009) Abadi, M. G., Navarro, J. F., Fardal, M., Babul, A., & Steinmetz, M. 2009, arXiv:0902.2477
- Agertz et al. (2009) Agertz, O., Teyssier, R., & Moore, B. 2009, MNRAS, 397, L64
- Allanson et al. (2009) Allanson, S. P., Hudson, M. J., Smith, R. J., & Lucey, J. R. 2009, ApJ, 702, 1275
- Angus et al. (2008) Angus, G. W., Famaey, B., & Buote, D. A. 2008, MNRAS, 387, 1470
- Auger et al. (2009) Auger, M. W., Treu, T., Bolton, A. S., Gavazzi, R., Koopmans, L. V. E., Marshall, P. J., Bundy, K., & Moustakas, L. A. 2009, ApJ, 705, 1099
- Barnabè et al. (2010) Barnabè, M., Auger, M. W., Treu, T., Koopmans, L., Bolton, A. S., Czoske, O., & Gavazzi, R. 2010, MNRAS, submitted, arXiv:1002.1083
- Bastian et al. (2010) Bastian, N., Covey, K. R., & Meyer, M. R. 2010, ARAA, in press, arXiv:1001.2965
- Bekki & Shioya (1998) Bekki, K., & Shioya, Y. 1998, ApJ, 497, 108
- Bekki (2010) Bekki, K. 2010, MNRAS, 401, L58
- Bernardi (2009) Bernardi, M. 2009, MNRAS, 395, 1491
- Bezanson et al. (2009) Bezanson, R., van Dokkum, P. G., Tal, T., Marchesini, D., Kriek, M., Franx, M., & Coppi, P. 2009, ApJ, 697, 1290
- Binney et al. (2001) Binney, J., Gerhard, O., & Silk, J. 2001, MNRAS, 321, 471
- Blumenthal et al. (1986) Blumenthal, G. R., Faber, S. M., Flores, R., & Primack, J. R. 1986, ApJ, 301, 27 (B+86)
- Bolton et al. (2007) Bolton, A. S., Burles, S., Treu, T., Koopmans, L. V. E., & Moustakas, L. A. 2007, ApJ, 665, L105
- Bolton et al. (2008) Bolton, A. S., Treu, T., Koopmans, L. V. E., Gavazzi, R., Moustakas, L. A., Burles, S., Schlegel, D. J., & Wayth, R. 2008, ApJ, 684, 248
- Boyarsky et al. (2009) Boyarsky, A., Neronov, A., Ruchayskiy, O., & Tkachev, I. 2009, arXiv:0911.3396
- Boylan-Kolchin & Ma (2004) Boylan-Kolchin, M., & Ma, C.-P. 2004, MNRAS, 349, 1117
- Boylan-Kolchin et al. (2005) Boylan-Kolchin, M., Ma, C.-P., & Quataert, E. 2005, MNRAS, 362, 184
- Boylan-Kolchin et al. (2006) Boylan-Kolchin, M., Ma, C.-P., & Quataert, E. 2006, MNRAS, 369, 1081
- Brown et al. (2008) Brown, M. J. I., et al. 2008, ApJ, 682, 937
- Brownstein & Moffat (2006) Brownstein, J. R., & Moffat, J. W. 2006, ApJ, 636, 721
- Bruzual & Charlot (2003) Bruzual, A. G. & Charlot, S. 2003, MNRAS, 344, 1000
- Bullock et al. (2001) Bullock, J. S., Kolatt, T. S., Sigad, Y., Somerville, R. S., Kravtsov, A. V., Klypin, A. A., Primack, J. R., & Dekel, A. 2001, MNRAS, 321, 559
- Buote et al. (2007) Buote, D. A., Gastaldello, F., Humphrey, P. J., Zappacosta, L., Bullock, J. S., Brighenti, F., & Mathews, W. G. 2007, ApJ, 664, 123
- Burkert (1995) Burkert, A. 1995, ApJ, 447, L25
- Burkert et al. (2008) Burkert, A., Naab, T., Johansson, P. H., & Jesseit, R. 2008, ApJ, 685, 897
- Burkert et al. (2010) Burkert, A., et al. 2010, ApJ, submitted, arXiv:0907.4777
- Calura & Menci (2009) Calura, F., & Menci, N. 2009, MNRAS, 400, 1347
- Cappellari et al. (2006) Cappellari, M. et al. 2006, MNRAS, 366, 1126 (C+06)
- Cappellari et al. (2009) Cappellari, M., et al. 2009, ApJ, 704, L34
- Cappellari et al. (2010) Cappellari, M., et al. 2010, in Dark Matter in Early-Type Galaxies, eds. L.V.E. Koopmans & T. Treu, in press, arXiv:0908.1904
- Cardone, Angus, & Tortora (2010) Cardone, V. F. & Tortora, C. 2010, MNRAS, submitted
- Cardone et al. (2010) Cardone, V. F., et al., 2010, MNRAS, submitted
- Carlberg (1986) Carlberg, R. G. 1986, ApJ, 310, 593
- Chabrier (2001) Chabrier, G. 2001, ApJ, 554, 1274
- Chabrier (2002) Chabrier, G. 2001, ApJ, 567, 304
- Chabrier (2003) Chabrier, G. 2003, PASP, 115, 763
- Coccato et al. (2009) Coccato, L., et al. 2009, MNRAS, 394, 1249
- Conroy et al. (2008) Conroy, C., Shapley, A. E., Tinker, J. L., Santos, M. R., & Lemson, G. 2008, ApJ, 679, 1192
- Conroy & Wechsler (2009) Conroy, C., & Wechsler, R. H. 2009, ApJ, 696, 620
- Conroy et al. (2009) Conroy, C., Gunn, J. E., & White, M. 2009, ApJ, 699, 486
- Cooper et al. (2010) Cooper, A. P., et al. 2010, arXiv:0910.3211
- Covington (2008) Covington, M. D. 2008, Ph.D. Thesis, Univ. California, Santa Cruz
- Covington et al. (2008) Covington, M., Dekel, A., Cox, T. J., Jonsson, P., & Primack, J. R. 2008, MNRAS, 384, 94
- Daddi et al. (2005) Daddi, E., et al. 2005, ApJ, 626, 680
- Dalcanton & Hogan (2001) Dalcanton, J. J., & Hogan, C. J. 2001, ApJ, 561, 35
- Davé (2008) Davé, R. 2008, MNRAS, 385, 147
- Debattista et al. (2008) Debattista, V. P., Moore, B., Quinn, T., Kazantzidis, S., Maas, R., Mayer, L., Read, J., & Stadel, J. 2008, ApJ, 681, 1076
- Dekel & Cox (2006) Dekel, A., & Cox, T. J. 2006, MNRAS, 370, 1445
- Dekel et al. (2009a) Dekel, A., et al. 2009a, Nature, 457, 451
- Dekel et al. (2009b) Dekel, A., Sari, R., & Ceverino, D. 2009b, ApJ, 703, 785
- de Lorenzi et al. (2009) de Lorenzi, F., et al. 2009, MNRAS, 395, 76
- Donato et al. (2009) Donato, F., et al. 2009, MNRAS, 397, 1169
- Duffy et al. (2008) Duffy, A. R., Schaye, J., Kay, S. T., & Dalla Vecchia, C. 2008, MNRAS, 390, L64
- Duffy et al. (2010) Duffy, A. R., Schaye, J., Kay, S. T., Dalla Vecchia, C., Battye, R. A., & Booth, C. M. 2010, MNRAS, submitted, arXiv:1001.3447
- Dutton et al. (2007) Dutton, A. A., van den Bosch, F. C., Dekel, A., & Courteau, S. 2007, ApJ, 654, 27
- Elmegreen et al. (2008) Elmegreen, B. G., Bournaud, F., & Elmegreen, D. M. 2008, ApJ, 688, 67
- Ferreras et al. (2005) Ferreras, I., Saha, P., & Williams, L. L. R. 2005, ApJ, 623, L5
- Ferreras et al. (2008) Ferreras, I., Saha, P., & Burles, S. 2008, MNRAS, 383, 857
- Ferreras et al. (2009) Ferreras, I., Mavromatos, N. E., Sakellariadou, M., & Yusaf, M. F. 2009, Phys Rev D, 80, 103506
- Forestell (2009) Forestell, A. D. 2009, Ph.D. Thesis, Univ. Texas
- Forte et al. (2009) Forte, J. C., Vega, E. I., & Faifer, F. 2009, MNRAS, 397, 1003
- Foster et al. (2009) Foster, C., Proctor, R. N., Forbes, D. A., Spolaor, M., Hopkins, P. F., & Brodie, J. P. 2009, MNRAS, 400, 2135
- Frigerio Martins & Salucci (2007) Frigerio Martins, C., & Salucci, P. 2007, MNRAS, 381, 1103
- Gargiulo et al. (2009) Gargiulo, A., et al. 2009, MNRAS, 397, 75
- Gavazzi et al. (2007) Gavazzi, R., Treu, T., Rhodes, J. D., Koopmans, L. V. E., Bolton, A. S., Burles, S., Massey, R. J., & Moustakas, L. A. 2007, ApJ, 667, 176
- Genel et al. (2008) Genel, S., et al. 2008, ApJ, 688, 789
- Gentile et al. (2009) Gentile, G., Famaey, B., Zhao, H., & Salucci, P. 2009, Nature, 461, 627
- Gerhard et al. (2001) Gerhard, O., Kronawitter, A., Saglia, R. P., & Bender, R. 2001, AJ, 121, 1936 (G+01)
- Glazebrook et al. (2004) Glazebrook, K., et al. 2004, Nature, 430, 181
- Gnedin et al. (2004) Gnedin, O. Y., Kravtsov, A. V., Klypin, A. A., & Nagai, D. 2004, ApJ, 616, 16 (G+04)
- Gnedin et al. (2007) Gnedin, O. Y., Weinberg, D. H., Pizagno, J., Prada, F., & Rix, H.-W. 2007, ApJ, 671, 1115
- Governato et al. (2010) Governato, F., et al. 2010, Nature, 463, 203
- Graham et al. (2006a) Graham, A. W., Merritt, D., Moore, B., Diemand, J., & Terzić, B. 2006a, AJ, 132, 2701
- Graham et al. (2006b) Graham, A. W., Merritt, D., Moore, B., Diemand, J., & Terzić, B. 2006b, AJ, 132, 2711
- Graves et al. (2009a) Graves, G. J., Faber, S. M., & Schiavon, R. P. 2009a, ApJ, 693, 486
- Graves et al. (2009b) Graves, G. J., Faber, S. M., & Schiavon, R. P. 2009b, ApJ, 698, 1590
- Graves (2009) Graves, G. J. 2009, Ph.D. Thesis, Univ. California, Santa Cruz
- Grillo & Gobat (2010) Grillo, C., & Gobat, R. 2010, MNRAS, 402, L67
- Guo et al. (2010) Guo, Q., White, S., Li, C., & Boylan-Kolchin, M. 2010, MNRAS, submitted, arXiv:0909.4305
- Gustafsson et al. (2006) Gustafsson, M., Fairbairn, M., & Sommer-Larsen, J. 2006, Phys Rev D, 74, 123522
- Haas & Anders (2010) Haas, M. R., & Anders, P. 2010, A&A, submitted, arXiv:1001.2009
- Hernquist et al. (1993) Hernquist, L., Spergel, D. N., & Heyl, J. S. 1993, ApJ, 416, 415
- Hoffman et al. (2010) Hoffman, L., Cox, T. J., Dutta, S., & Hernquist, L. 2010, ApJ, submitted, arXiv:1001.0799
- Holden et al. (2010) Holden, B., et al. 2010, ApJ, submitted
- Hopkins et al. (2008) Hopkins, P. F., Cox, T. J., & Hernquist, L. 2008, ApJ, 689, 17
- Hopkins et al. (2010) Hopkins, P. F., Bundy, K., Hernquist, L., Wuyts, S., & Cox, T. J. 2010, MNRAS, 401, 1099
- Hopkins & Hernquist (2010) Hopkins, P. F., & Hernquist, L. 2010, MNRAS, 402, 985
- Humphrey et al. (2009) Humphrey, P. J., Buote, D. A., Brighenti, F., Gebhardt, K., & Mathews, W. G. 2009, ApJ, 703, 1257
- Humphrey & Buote (2010) Humphrey, P. J., & Buote, D. A. 2010, MNRAS, 135
- Jardel & Sellwood (2009) Jardel, J. R., & Sellwood, J. A. 2009, ApJ, 691, 1300
- Jesseit et al. (2009) Jesseit, R., Cappellari, M., Naab, T., Emsellem, E., & Burkert, A. 2009, MNRAS, 397, 1202
- Jiang & Kochanek (2007) Jiang, G., & Kochanek, C. S. 2007, ApJ, 671, 1568
- Johansson et al. (2009) Johansson, P. H., Naab, T., & Ostriker, J. P. 2009, ApJ, 697, L38
- Jun & Im (2008) Jun, H. D., & Im, M. 2008, ApJ, 678, L97
- Kalirai et al. (2010) Kalirai, J. S., et al. 2010, ApJ, in pres, arXiv:0911.1998
- Kassin et al. (2006) Kassin, S. A., de Jong, R. S., & Weiner, B. J. 2006, ApJ, 643, 804
- Kauffmann et al. (2003) Kauffmann, G., et al. 2003, MNRAS, 346, 1055
- Kazantzidis et al. (2006) Kazantzidis, S., Zentner, A. R., & Kravtsov, A. V. 2006, ApJ, 641, 647
- Kereš et al. (2009a) Kereš, D., Katz, N., Fardal, M., Davé, R., & Weinberg, D. H. 2009a, MNRAS, 395, 160
- Kereš et al. (2009b) Kereš, D., Katz, N., Davé, R., Fardal, M., & Weinberg, D. H. 2009b, MNRAS, 396, 2332
- Klessen et al. (2007) Klessen, R. S., Spaans, M., & Jappsen, A.-K. 2007, MNRAS, 374, L29
- Koopmans et al. (2009) Koopmans, L. V. E., et al. 2009, ApJ, 703, L51
- Koposov et al. (2009) Koposov, S. E., Yoo, J., Rix, H.-W., Weinberg, D. H., Macciò, A. V., & Escudé, J. M. 2009, ApJ, 696, 2179
- Kormendy & Freeman (2004) Kormendy, J., & Freeman, K. C. 2004, Dark Matter in Galaxies, 220, 377
- Kormendy & Sanders (1992) Kormendy, J., & Sanders, D. B. 1992, ApJ, 390, L53
- Kroupa (2001) Kroupa P., 2001, MNRAS, 322, 231
- Krumholz et al. (2010) Krumholz, M. R., Cunningham, A. J., Klein, R. I., & McKee, C. F. 2010, ApJ, submitted, arXiv:1001.0971
- La Barbera et al. (2010a) La Barbera, F., de Carvalho, R. R., de la Rosa, I. G., & Lopes, P. A. A. 2010a, MNRAS, submitted, arXiv:0912.4558
- La Barbera et al. (2010b) La Barbera, F., Lopes, P. A. A., de Carvalho, R. R., de la Rosa, I. G., & Berlind, A. A. 2010b, MNRAS, submitted, arXiv:1003.1119
- Lackner & Ostriker (2010) Lackner, C. N., & Ostriker, J. P. 2010, ApJ, 712, 88
- Lagattuta et al. (2010) Lagattuta, D. J., et al. 2010, ApJ, submitted, arXiv:0911.2236
- Larson (2005) Larson, R. B. 2005, MNRAS, 359, 211
- Lee et al. (2004) Lee, H.-c., Gibson, B. K., Flynn, C., Kawata, D., & Beasley, M. A. 2004, MNRAS, 353, 113
- Li et al. (2009) Li, Y.-S., Helmi, A., De Lucia, G., & Stoehr, F. 2009, MNRAS, 397, L87
- Macciò et al. (2008) Macciò, A. V., Dutton, A. A., & van den Bosch, F. C. 2008, MNRAS, 391, 1940
- Macciò et al. (2009) Macciò, A. V., Kang, X., & Moore, B. 2009, ApJ, 692, L109
- Mancini et al. (2010) Mancini, C., et al. 2010, MNRAS, 401, 933
- Mashchenko et al. (2008) Mashchenko, S., Wadsley, J., & Couchman, H. M. P. 2008, Science, 319, 174
- McGaugh (2005) McGaugh, S. S. 2005, ApJ, 632, 859
- McGaugh et al. (2007) McGaugh, S. S., de Blok, W. J. G., Schombert, J. M., Kuzio de Naray, R., & Kim, J. H. 2007, ApJ, 659, 149
- McGaugh (2008) McGaugh, S. S. 2008, ApJ, 683, 137
- Meurer et al. (2009) Meurer, G. R., et al. 2009, ApJ, 695, 765
- Mao & Mo (1998) Mao, S., & Mo, H. J. 1998, MNRAS, 296, 847
- Mo & Mao (2004) Mo, H. J., & Mao, S. 2004, MNRAS, 353, 829
- More et al. (2009) More, S., van den Bosch, F. C., Cacciato, M., Mo, H. J., & Yang, X., & Li, R. 2009, MNRAS, 392, 801
- More et al. (2010) More, S., van den Bosch, F. C., Cacciato, M., Skibba, R., Mo, H. J., & Yang, X. 2010, MNRAS, in prep.
- Moster et al. (2010) Moster, B. P., Somerville, R. S., Maulbetsch, C., van den Bosch, F. C., Macciò, A. V., Naab, T., & Oser, L. 2010, ApJ, 710, 90
- Muzzin et al. (2009) Muzzin, A., van Dokkum, P., Franx, M., Marchesini, D., Kriek, M., & Labbé, I. 2009, ApJ, 706, L188
- Naab et al. (2009) Naab, T., Johansson, P. H., & Ostriker, J. P. 2009, ApJ, 699, L178
- Napolitano et al. (2005) Napolitano, N. R., et al. 2005, MNRAS, 357, 691
- Napolitano et al. (2009) Napolitano, N. R., et al. 2009, MNRAS, 393, 329 (N+09)
- Navarro et al. (1997) Navarro, J. F., Frenk, C. S., & White, S. D. M. 1997, ApJ, 490, 493
- Niemi et al. (2010) Niemi, S.-M., Heinämäki, P., Nurmi, P., & Saar, E. 2010, MNRAS, in press, arXiv:1002.0847
- Nipoti et al. (2009) Nipoti, C., Treu, T., & Bolton, A. S. 2009, ApJ, 703, 1531
- Okamoto & Frenk (2009) Okamoto, T., & Frenk, C. S. 2009, MNRAS, 399, L174
- Oñorbe et al. (2005) Oñorbe, J., Domínguez-Tenreiro, R., Sáiz, A., Serna, A., & Artal, H. 2005, ApJ, 632, L57
- Oñorbe et al. (2006) Oñorbe, J., Domínguez-Tenreiro, R., Sáiz, A., Artal, H., & Serna, A. 2006, MNRAS, 373, 503
- Pedrosa et al. (2009) Pedrosa, S., Tissera, P. B., & Scannapieco, C. 2009, MNRAS, 395, L57
- Pedrosa et al. (2010) Pedrosa, S., Tissera, P. B., & Scannapieco, C. 2010, MNRAS, 402, 776
- Peirani et al. (2008) Peirani, S., Kay, S., & Silk, J. 2008, A&A, 479, 123
- Peñarrubia et al. (2010) Peñarrubia, J., Benson, A. J., Walker, M. G., Gilmore, G., McConnachie, A., & Mayer, L. 2010, MNRAS, submitted, arXiv:1002.3376
- Pointecouteau & Silk (2005) Pointecouteau, E., & Silk, J. 2005, MNRAS, 364, 654
- Proctor et al. (2009) Proctor, R. N., Forbes, D. A., Romanowsky, A. J., Brodie, J. P., Strader, J., Spolaor, M., Mendel, J. T., & Spitler, L. 2009, MNRAS, 398, 91
- Prugniel & Simien (1996) Prugniel, Ph. & Simien F. 1996, A&A, 309, 749
- Renzini (2005) Renzini, A. 2005, The Initial Mass Function 50 Years Later, 327, 221
- Renzini (2006) Renzini, A. 2006, ARAA, 44, 141
- Rhode et al. (2007) Rhode, K. L., Zepf, S. E., Kundu, A., & Larner, A. N. 2007, AJ, 134, 1403
- Richtler et al. (2008) Richtler, T., Schuberth, Y., Hilker, M., Dirsch, B., Bassino, L., & Romanowsky, A. J. 2008, A&A, 478, L23
- Robertson et al. (2006) Robertson, B., Cox, T. J., Hernquist, L., Franx, M., Hopkins, P. F., Martini, P., & Springel, V. 2006, ApJ, 641, 21
- Rogers et al. (2010) Rogers, B., Ferreras, I., Pasquali, A., Bernardi, M., Lahav, O., & Kaviraj, S. 2010, MNRAS, in press, arXiv:1002.0835
- Romanowsky (2006) Romanowsky, A. J. 2006, EAS Publications Series, 20, 119
- Romanowsky et al. (2009) Romanowsky, A. J., Strader, J., Spitler, L. R., Johnson, R., Brodie, J. P., Forbes, D. A., & Ponman, T. 2009, AJ, 137, 4956
- Romano-Díaz et al. (2008) Romano-Díaz, E., Shlosman, I., Hoffman, Y., & Heller, C. 2008, ApJ, 685, L105
- Ruszkowski & Springel (2009) Ruszkowski, M., & Springel, V. 2009, ApJ, 696, 1094
- Salpeter (1955) Salpeter, E.E. 1955 ApJ, 121, 161
- Sánchez-Blázquez et al. (2007) Sánchez-Blázquez, P., Forbes, D. A., Strader, J., Brodie, J., & Proctor, R. 2007, MNRAS, 377, 759
- Sanders (2003) Sanders, R. H. 2003, MNRAS, 342, 901
- Sanders & Land (2008) Sanders, R. H., & Land, D. D. 2008, MNRAS, 389, 701
- Saracco et al. (2009) Saracco, P., Longhetti, M., & Andreon, S. 2009, MNRAS, 392, 718
- Saxton & Ferreras (2010) Saxton, C. J., & Ferreras, I. 2010, MNRAS, in press, arXiv:1002.0845
- Schmitt et al. (1999) Schmitt, H. R., Storchi-Bergmann, T., & Cid Fernandes, R. 1999, MNRAS, 303, 173
- Schulz et al. (2010) Schulz, A. E., Mandelbaum, R., & Padmanabhan, N. 2010, MNRAS, submitted, arXiv:0911.2260 (S+10)
- Sellwood & McGaugh (2005) Sellwood, J. A., & McGaugh, S. S. 2005, ApJ, 634, 70
- Sérsic (1968) Sérsic, J. L. 1968, Atlas de Galaxies Australes, Observatorio Astronomico de Cordoba
- Shankar & Bernardi (2009) Shankar, F., & Bernardi, M. 2009, MNRAS, 396, L76 (SB09)
- Shankar et al. (2010) Shankar, F., Marulli, F., Bernardi, M., Dai, X., Hyde, J. B., & Sheth, R. K. 2010, MNRAS, in press, arXiv:0912.0012
- Shen & Gebhardt (2010) Shen, J., & Gebhardt, K. 2010, ApJ, in press, arXiv:0910.4168
- Shin & Kawata (2009) Shin, M.-S., & Kawata, D. 2009, ApJ, 691, 83
- Sommer-Larsen & Toft (2010) Sommer-Larsen, J., & Toft, S. 2010, ApJ, submitted, arXiv:0909.0943
- Spergel et al. (2007) Spergel, D. N., et al., 2007, ApJS, 170, 377
- Spolaor et al. (2008) Spolaor, M., Forbes, D. A., Proctor, R. N., Hau, G. K. T., & Brough, S. 2008, MNRAS, 385, 675
- Springel (2000) Springel, V. 2000, MNRAS, 312, 859
- Strigari et al. (2008) Strigari, L. E., Bullock, J. S., Kaplinghat, M., Simon, J. D., Geha, M., Willman, B., & Walker, M. G. 2008, Nature, 454, 1096
- Stringer et al. (2010) Stringer, M., Cole, S., & Frenk, C. 2010, arXiv:0911.1888
- Terlevich & Forbes (2002) Terlevich, A. I., & Forbes, D. A. 2002, MNRAS, 330, 547
- Thomas et al. (2005) Thomas, D., Maraston, C., Bender, R. & Mendes de Oliveira, C. 2005, ApJ, 621, 673
- Thomas et al. (2007) Thomas, J., Saglia, R. P., Bender, R., Thomas, D., Gebhardt, K., Magorrian, J., Corsini, E. M., & Wegner, G. 2007, MNRAS, 382, 657
- Thomas et al. (2009) Thomas, J., Saglia, R. P., Bender, R., Thomas, D., Gebhardt, K., Magorrian, J., Corsini, E. M., & Wegner, G. 2009, ApJ, 691, 770 (T+09)
- Tiret et al. (2007) Tiret, O., Combes, F., Angus, G. W., Famaey, B., & Zhao, H. S. 2007, A&A, 476, L1
- Tissera et al. (2010) Tissera, P. B., White, S. D. M., Pedrosa, S., & Scannapieco, C. 2010, MNRAS, submitted, arXiv:0911.2316
- Tortora et al. (2009) Tortora, C., Napolitano, N. R., Romanowsky, A. J., Capaccioli, M., & Covone, G. 2009, MNRAS, 396, 1132 (paper I)
- Treu et al. (2010) Treu, T., Auger, M. W., Koopmans, L. V. E., Gavazzi, R., Marshall, P. J., & Bolton, A. S. 2010, ApJ, 709, 1195 (T+10)
- Trujillo et al. (2004) Trujillo, I., Burkert, A., & Bell, E. F. 2004, ApJ, 600, L39
- Trujillo et al. (2006) Trujillo, I., et al. 2006, ApJ, 650, 18
- Valentinuzzi et al. (2010) Valentinuzzi, T., et al. 2010, ApJ, in press, arXiv:0907.2392
- van der Wel et al. (2009) van der Wel, A., Bell, E. F., van den Bosch, F. C., Gallazzi, A., & Rix, H.-W. 2009, ApJ, 698, 1232
- van Dokkum (2008) van Dokkum, P. G. 2008, ApJ, 674, 29
- van Dokkum et al. (2009) van Dokkum, P. G., Kriek, M., & Franx, M. 2009, Nature, 460, 717
- van Dokkum et al. (2010) van Dokkum, P. G., et al. 2010, ApJ, 709, 1018
- Walker et al. (2009) Walker, M. G., Mateo, M., Olszewski, E. W., Peñarrubia, J., Wyn Evans, N., & Gilmore, G. 2009, ApJ, 704, 1274
- Walker et al. (2010) Walker, M. G., Mateo, M., Olszewski, E. W., Peñarrubia, J., Wyn Evans, N., & Gilmore, G. 2010, ApJ, 710, 886
- Wechsler et al. (2002) Wechsler, R. H., Bullock, J. S., Primack, J. R., Kravtsov, A. V., & Dekel, A. 2002, ApJ, 568, 52
- Wechsler et al. (2006) Wechsler, R. H., Zentner, A. R., Bullock, J. S., Kravtsov, A. V., & Allgood, B. 2006, ApJ, 652, 71
- Weidner & Kroupa (2006) Weidner, C., & Kroupa, P. 2006, MNRAS, 365, 1333
- Weijmans et al. (2009) Weijmans, A.-M., et al. 2009, MNRAS, 398, 561
- Wolf et al. (2010) Wolf, J., Martinez, G. D., Bullock, J. S., Kaplinghat, M., Geha, M., Munoz, R. R., Simon, J. D., & Avedo, F. F. 2010, MNRAS, submitted arXiv:0908.2995
- Woodley et al. (2010) Woodley, K. A., Gomez, M., Harris, W. E., Geisler, D., & Harris, G. L. H. 2010, AJ, in press, arXiv:1002.3142
- Xue et al. (2008) Xue, X. X., et al. 2008, ApJ, 684, 1143
- Zhao et al. (2008) Zhao, H., Xu, B.-X., & Dobbs, C. 2008, ApJ, 686, 1019
- Zheng et al. (2007) Zheng, Z., Coil, A. L., & Zehavi, I. 2007, ApJ, 667, 760
Appendix A Investigating negative dark matter fractions
Our derivation of from estimates of and yields a number of cases where galaxies have an unphysical . These cases comprise 2%, 7% and 25% of the sample for the Chabrier, Kroupa and Salpeter IMFs, respectively. Here we investigate whether these fractions could be compatible with simple observational scatter in and .
We have estimated the uncertainties in to be 15% using Monte Carlo simulations of SED fitting. For , we may generically consider it as derived via a virial relation:
| (2) |
where is a virial coefficient, is the gravitational constant, and is the luminosity (see C+06 equation 19). In this context, the value of is arbitrary, and the uncertainty in the physical units is dominated by the 10% distance uncertainty. To estimate we first consider the central with a measurement error of 5%, and extrapolate this to the value averaged over —an exercise with a 5% uncertainty (C+06; we consider systematics separately). The value of was found by C+06 to have a 15% scatter. The net uncertainty in is then 23%, and the uncertainty on varies from 0.1 to 0.2 for high to low values.
We begin by assuming some fraction of the galaxy sample have true , which we find is the lowest plausible value in a CDM context (Section 3.1). Using the uncertainties discussed above, we generate a random sample of measurements and scale a histogram of their frequency to reproduce the number of observations while not exceeding any of the frequencies (Fig. 18). For the Chabrier and Kroupa IMFs, this scaling process implies that 15% of the sample have . For the Salpeter IMF on the other hand, it is difficult to find a scaling that reproduces the negative- tail without violating the observed distribution to higher values; the best fit has 55% with .
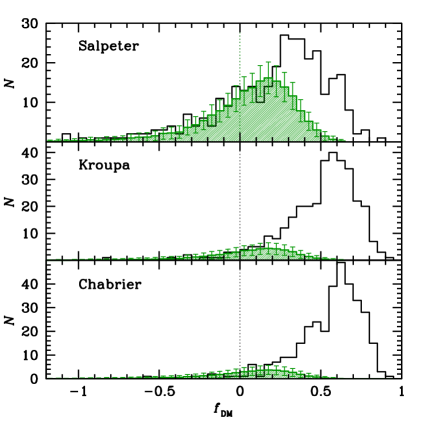
This difficulty with Salpeter would be eased if a true is assumed for half the galaxies, if there were systematic errors at the level of 15%, or if the random measurement errors were actually at the level of 25%, or were non-Gaussian. We would not at present rule out any of these possibilities and so cannot categorically exclude a universal Salpeter IMF. Recalibrating our and estimates to external results (as discussed in paper I Appendix A) would on the other hand make the situation more problematic for Salpeter by increasing the number of objects with .
Appendix B Cross-checks on age dependencies
Here we carry out various tests on the robustness of the DM-age trends found in Section 2.2. In Section B.1 we compare our results to other literature results, and in Section B.2 we examine the implications of results at larger radii. We explore systematic effects in our stellar populations models in Section B.3.
B.1 Central DM content
We check here whether our results on central and age are consistent with other results in the literature. First we consider the SDSS-based analysis of SB09. They estimated central dynamical and stellar masses for a large sample of ETGs at 0.1–0.2 using somewhat different techniques to ours in paper I. After correcting the galaxy luminosities to a common age, they found total trends that depend systematically on age (their Fig. 2). Using the information in Bernardi (2009) to convert these corrected luminosities to stellar masses, we convert their values to and then to . It also appears that they assumed a Chabrier IMF, so we further convert their results to a Kroupa IMF for comparison with our default models and results.
The results of this exercise are plotted in Fig. 19: there are indications of an anti-correlation between and age, particularly for the higher mass bins. For comparison, our results are also plotted; other than a 30% overall offset in whose origin is unclear, the results are generally consistent. The SB09 data do suggest somewhat shallower correlations that might be explained by a pure -age effect (as stated by these authors) but they do not cover a large enough range in age to be sure.
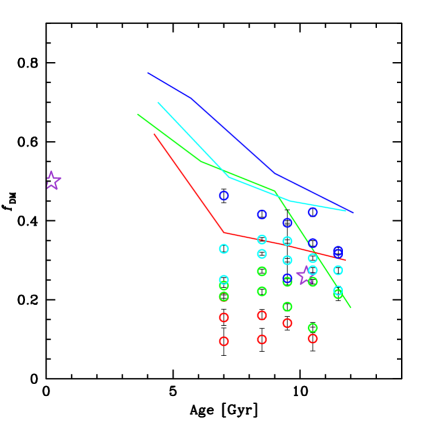
Graves et al. (2009b) carried out a different analysis of quiescent ETGs in the SDSS. They again analyzed the central dynamical and stellar masses separately, and mapped various stellar populations parameters on approximate slices of the FP defined by and . Although these results do imply a systematic correlation between size and age at fixed mass, if one considers a single - grid-point, then one can control for size and mass dependencies and look for any residual correlations in the perpendicular direction of surface brightness.
These authors found a negative correlation between age and surface brightness, which because dynamical mass is approximately constant implies that there is a positive correlation between age and overall . They mentioned that in a forthcoming paper they will find that stellar populations effects are not enough to explain this age- correlation, which therefore implies a net positive age- correlation. This result is opposite to the trend that we find for a residual negative age- correlation after the age- correlations are accounted for. It remains to be seen exactly how and why our results differ.
Bastian et al. (2010) Fig. 4 provides an intriguing compilation of comparisons between and at and for ETGs from C+06 and Cappellari et al. (2009). While there are many issues in making such a direct comparison between the two galaxy samples the apparent trend does agree qualitatively with our results, although we cannot evaluate the potential residuals from a size-driven trend (Fig. 19).
Since Graves et al. (2009b) among others emphasize the primary importance of (rather than ) in correlating with stellar populations parameters, we show in Fig. 20 our results for -age in bins of constant . The trends are similar to those found in bins of constant . However, we do not use in general in this paper because it is less straightforward to incorporate in the toy models, and because depends on a dynamical mass determination that is intrinsically correlated with .
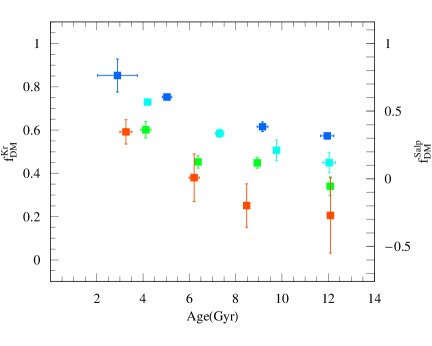
B.2 Large radius DM content
Next we consider DM conclusions from dynamical studies extending to large galactocentric radii, quantified as the gradient parameter introduced in Napolitano et al. (2005). The data-set of 25 galaxies is from paper I (Fig. C2, with an update on NGC 4374 from Napolitano et al., in prep), where we confirmed that the gradient correlated well with from the central regions. We show some of our toy model predictions from this paper in Fig. 21 (upper left panel). In the absence of any residual DM-age trends, the gradient is expected to decrease with age, since it is defined relative to the galaxy , which in turn decreases with age.
At first glance, the data appear to support this expectation, with the residuals unclear because of the scatter. However, closer examination of the data-sets plotted raises a red flag: the four “young”, DM-dominated galaxies are all well-known nearby massive group- and cluster-central ellipticals that are normally thought to have very old stellar populations (averaged over ), not with ages 4–5 Gyr (NGC 1407, M49, M87, NGC 5846; e.g. C+06; Sánchez-Blázquez et al. 2007; Spolaor et al. 2008).
It turns out that these galaxies were all fitted with an unrealistic super-solar metallicity () which is probably a reflection of the fundamental age-metallicity degeneracy in stellar populations analyses. We re-ran our analysis with all the metallicities fixed to , which for the four problematic galaxies yielded more credible ages of 14 Gyr191919For galaxies with a previous best fit of , the age and results with fixed are not exactly the same as before. This is because our procedure does not involve a simple best fit, but rather a Monte Carlo approach using the median of a distribution of best-fit values: see paper I.. The revised -gradient results are shown in the top right panel of Fig. 21, where it now appears that the DM content may increase with age. The first thing to keep in mind when considering this apparent inconsistency with our main -age result is that the DM content within and within 5 may very well not be tightly correlated. The central DM content may be less a reflection of the overall DM content and more closely related to the details of the baryonic-DM interplay at the centres of haloes.
The main effect however appears to be small number statistics coupled with selection effects. In the bottom panels of Fig. 21 we show the results for both metallicity assumptions. The stellar is not very sensitive to the age-metallicity degeneracy, and in fact is affected in a way that roughly parallels the overall -age trend: higher age and lower yield higher and lower . Thus the general trend for our full sample is not qualitatively affected by changing , but quantitatively shifts to larger ages overall (see also Fig. 22).
The subsample of galaxies that have large-radius data is not so fortunate. When fixing , their -age results buck the overall trend, just as seen from the large-radius results. This sample has only one “young” object ( 7 Gyr), and the old objects are dominated by systems like M87 which are known to reside at the centres of massive groups and clusters, and appear to comprise the high- tail of the overall distribution. Such galaxies are some of the first targets of large-radius dynamical studies because of their rich supply of mass tracers such as globular clusters and planetary nebulae. The price to pay from selecting such systems is that they could provide a very biassed view of the Universe—as now appears to be the case when considering central DM content.
This selection effect may explain the curious DM halo mass-concentration trends found by N+09, and demonstrates the importance of constructing an unbiassed galaxy sample. For now, the DM-age implications from large-radius tracers are totally inconclusive, and will require completion of a large systematic survey to make any progress. In the meantime, valuable spot-checks could be provided by studying the large-radius DM content of a few galaxies that help drive the apparent -age relation, e.g. young DM-rich systems like NGC 3626 or old DM-poor ones like NGC 7454.
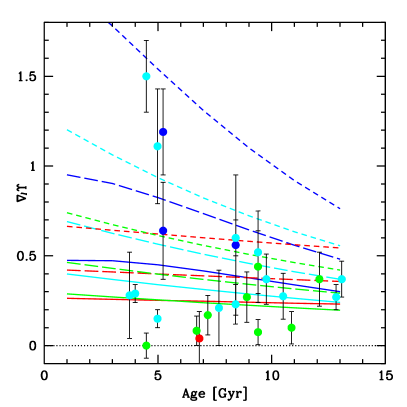
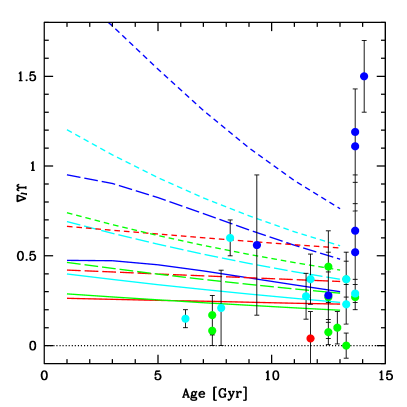
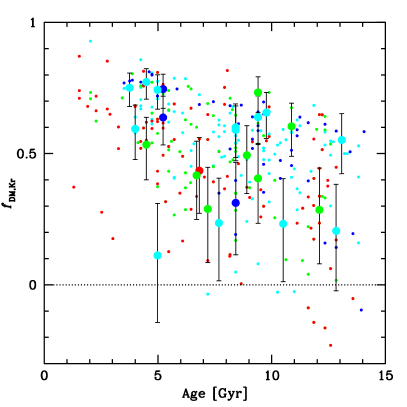
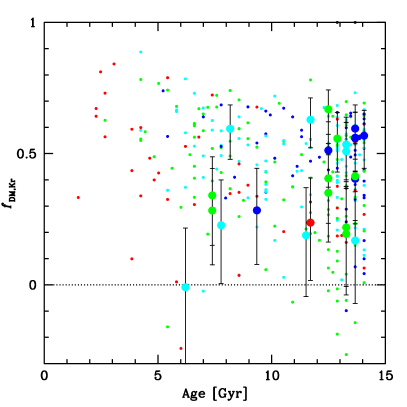
B.3 Modelling systematics
We next consider whether systematic uncertainties in our stellar populations modelling could be affecting our DM inferences. We have already explored this issue for the -mass relations in paper I; here we consider -age. Age and stellar are both derived from the same models, and a positive error in age would correlate with a positive error in stellar which would produce a negative error in and thus mimic an anti-correlated -age trend solely because of the correlated errors.
To see if such a systematic could account for our observational result, we experiment with different stellar populations assumptions, showing the results in Fig. 22. The only cases where the -age trend is appreciably different from our standard estimate is when we unrealistically fix (green lines).
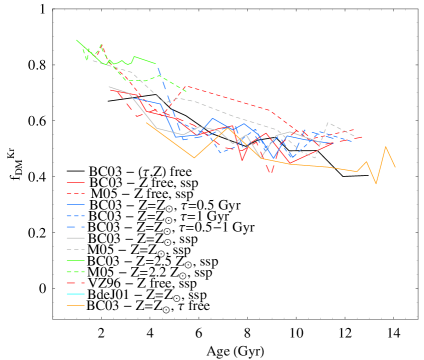
Given the problem identified in Section B.2 where allowing the metallicity to vary freely can result in too many “young” galaxies, we consider in particular our results when we fix . The implications for were shown in Figs. 21 (right panels) and 22 (solid orange line), and we also show the overall - trend in Fig. 23. The results are similar to our standard model.
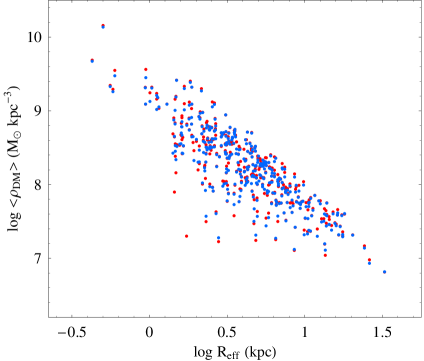
As a reminder, in paper I (Appendix A) we compared independent estimates of and to C+06 for galaxies in common. Our values for the same IMF were 20% lower, and our values were higher (by 10% for the brighter galaxies and 30% for the fainter galaxies). Thus our values are systematically higher, becoming more discrepant for fainter galaxies (up to ). The C+06 results on their own may imply consistency with no-AC models for the fainter galaxies, and strong AC for the brighter ones (Romanowsky, 2006), which would be in better agreement with the results of N+09. We have also checked the -age trends using a recalibration as discussed in paper I, and found that for the fainter galaxies, the anti-correlation becomes somewhat steeper, so our basic -age result does not go away.
An issue not discussed in paper I is the potential effect of AGN emission on the observed galaxy colours and thus on the and age inferences. The AGN colours would generally mimic a stellar population of 3 Gyr age and skew the inferences toward younger ages and higher . Matching the SDSS DR4 ETG catalogue with the AGN catalogue of Kauffmann et al. (2003), we find that 15% of the galaxies in our sample’s mass range have strong AGNs (Type II with strong [O III] emission; see also Graves et al. 2009a). However, based on the AGN study of Schmitt et al. (1999), we estimate that the contaminant light would account for only 1–2% of the total light within , and would bias our results by at most 5%.