A Region of Violent Star Formation in the Irr Galaxy IC 10: Structure and Kinematics of Ionized and Neutral Gas
Abstract
We have used observations of the galaxy IC 10 at the 6-m telescope of the Special Astrophysical Observatory with the SCORPIO focal reducer in the Fabry–Perot interferometer mode and with the MPFS spectrograph to study the structure and kinematics of ionized gas in the central region of current intense star formation. Archive VLA 21-cm observations are used to analyze the structure and kinematics of neutral gas in this region. High-velocity wings of the H and [SII] emission lines were revealed in the inner cavity of the nebula HL 111 and in other parts of the complex of violent star formation. We have discovered local expanding neutral-gas shells around the nebulae HL 111 and HL 106.
1 INTRODUCTION
The dwarf Irr galaxy IC 10 is the nearest galaxy with violent star formation; it is often classified as a BCD galaxy based on its high H and IR luminosity (Richer et al. 2001). The stellar population of IC 10 displays two bursts of star formation; the first occured at least 350 million years ago, and the second 4–10 million years ago (cf. Hunter 2001; Zucker 2002; Massey et al. 2007; Vacca et al. 2007, and references therein). One consequence of the latest star-formation burst is the multi-shell fine-filamentary structure of the interstellar medium in IC 10: images of the galaxy in the H and [SII] lines reveal a giant complex of multiple shells and super-shells, arc and ring structures, from 50 pc to 800–1000 pc in size (Zucker et al. 2000; Wilcots and Miller 1998; Gil de Paz et al. 2003, Leroy et al. 2006; Chyzy et al. 2003; Lozinskaya et al. 2008, and references therein). The unusually high number of Wolf-Rayet (WR) stars (whose spatial density in IC 10 is the highest among dwarf galaxies and is comparable to that in massive spiral galaxies) is a result of a recent star-formation burst that was short but encompassed most of the galaxy (Massey et al. 1992; Richer et al. 2001; Massey and Holmes 2002; Crowther et al. 2003; Massey et al. 2007; Vacca et al. 2007, and references therein). This high density of WR stars means that we are actually witnessing a short time interval at the close of the latest episode of star formation.
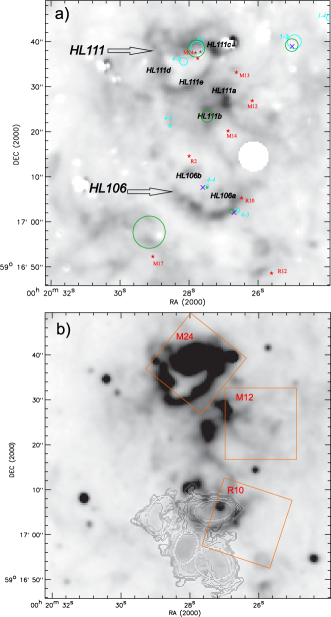
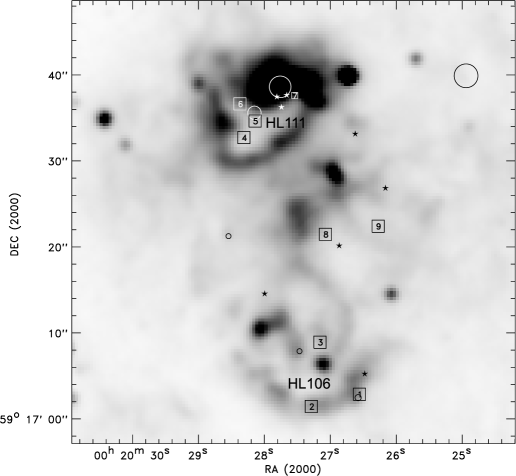
The central region of current vigorous star formation activity is located in the galaxy’s south-eastern sector. It contains the highest-density HI cloud, a CO molecular cloud, and a brightest complex of emission nebulae about 300–400 pc in size, including the two shell nebulae HL 111 and HL 106 (the names are from the catalog Hodge and Lee (1990), as well as the youngest star clusters and a dozen WR stars (Wilcots and Miller 1998; Gil de Paz et al. 2003; Leroy et al. 2006; Lozinskaya et al. (2009), and references therein). Images of the region in the H and [SII] ( Å) lines are shown in Fig. 1.
According to Vacca et al. (2007), the center of the latest star formation episode is located near the object earlier identified as the WR star M24. (Here and below, we use the prefix “R” for WR stars listed in Royer et al. (2001) and “M” for those listed in Massey and Holmes 2002.) The nebula HL 111c surrounding M24 is the brightest part of the shell HL 111 (Fig. 1); the size of the shell defined by its three arcs HL 111c, HL 111d and HL 111e is about , or 35 pc for the distance 800 kpc. Hunter (2001) identified two clusters in the region of HL 111: the brightest part, HL 111c, contains the cluster 4-1 which includes M24; the cluster 4-2 is in the middle of the internal cavity. These are the youngest clusters in the galaxy, with ages of three to four million years (Hunter 2001).
It was noted earlier that the WR star M24 actually consists of the three blue stars M24-A, M24-B, and M-24C, separated by ; one of the components was suspected to be an O3If star, a WN star, or a cluster containing WN stars (Crowther et al. 2003). Vacca et al. (2007) demonstrated that M24 was actually a close stellar group consisting of at least of six blue stars (three blue stars were identified in M24A and two in M24B). Four of these six stars are WR candidates.
The southern part of the above-mentioned HI and CO cloud – the highest-density one in the galaxy – contains the shell nebula HL 106, whose sources of ionizing radiation are probably the WR stars R2 and R10, as well as the clusters 4-3 and 4-4 (Fig. 1). According to the estimates by Hunter (2001), the clusters are appreciably older than the young clusters 4-1 and 4-2 in the HL 111 region.
The aim of the current paper is a detailed study of the structure and kinematics of the ionized and neutral gas in the region of violent star formation. Our study is based on observations with the 6-m telescope of the Special Astrophysical Observatory (SAO) using the SCORPIO focal reducer working in the Fabry–Perot interferometer (FPI) mode. We also use observations with the MPFS panoramic spectrograph and with SCORPIO in the long-slit spectroscopy mode (the latter observations are discussed in detail in Lozinskaya et al., 2009). The following sections describe our observations, and present and discuss our results, while the last section summarizes our conclusions.
| Mode | Field | Date | Range | , Å | , s | Seeing |
| FPI | The whole galaxy | Hα | 0.8 | |||
| FPI | The whole galaxy | [SII] | 0.8 | 1.4–2.0 | ||
| MPFS | M24 | 2004.08.08/09 | 3990–6940 | 6.5 | 2700 | 1.7–2.0 |
| MPFS | R10 | 2004.08.08/09 | 3990–6940 | 6.5 | 1800 | 1.4 |
| MPFS | M12 | 2005.09.28/29 | 3990–6940 | 6.5 | 3600 | 2.0 |
All radial velocities in this paper are heliocentric. The distance to the galaxy is assumed to be 800 kpc (the angular scale is pc per arcsecond; cf. Section 4).
2 OBSERVATIONS AND DATA REDUCTION
A log of our observations with the SAO 6-m telescope using the SCORPIO focal reducer in the FPI mode and the MPFS is presented in the Table. Its columns contain (1) the instrument, (2) the field covered or the designation of the MPFS field (according to the central WR star), (3) the observation epoch, (4) the wavelength range, (5) the spectral resolution, (6) the exposure time, and (7) the seeing.
2.1 Observations with the Fabry–Perot Interferometer
Our observations with the 6-m telescope using SCORPIO and the scanning FPI were made in two lines: H and [SII] Å. The capabilities of the SCORPIO for interferometric observations are described in detail by Moiseev (2002). We used a scanning FPI working in the 501st interference order at Å. In these observations, the distance between adjacent interference orders, Å for H line and Å for the [SII] Å line, corresponded to a region free of overlapping orders km/s wide in radial velocity. The width (FWHM) of the instrumental profile was about Å, km/s. We performed preliminary monochromatization using interference filters with a FWHM of Å, centered on the H and [SII] Å lines. The detector was a -pixel EEV 42-40 CCD array. To reduce the readout time, we observed with -pixel binning in the H line and -pixel binning in the [SII] Å line. In this way, we obtained -pixel images for H and -pixel images for the [SII] line in each spectral channel, with the scales being per pixel and per pixel, respectively; the full field of view was .
In the course of our observations, we obtained a sequence of 36 interferometric images of the object for different distances between the FPI plates, so that the width of a spectral channel was Å in H and Å in the [SII] Å line, i.e. about 17 km/s in radial velocity. To correctly remove stray ghost images from numerous regions of emission in the galaxy, we observed at two different alignments of the instrument’s field of view. The total exposure time was 10800 s for observations in H and 12960 s for the [SII] Å line.
We reduced the observations using IDL-based software (Moiseev 2008). After the preliminary data reduction, the data were presented as data cubes with size of and , where an each spatial element (“spaxel”) contains a 36-channel spectrum. We removed ghost images using the algorithms described by Moiseev and Egorov (2008). Each time, we observed for two orientations of the field of view and then compiled the resulting preliminary data cubes. This procedure guarantees the removal of ghosts due to bright stars, which is important for our studies of spectral-line shapes. The final angular resolutions (after averaging during the data reduction) were and in H and [SII] Å lines, respectively. The uncertainty in the wavelength scale was 3-5 km/s.
Using narrow-band filters for preliminary monochromatization of the light considerably reduced the flux from neighboring spectral lines in overlapped interference orders. A possible residual contribution from the second component of the [SII] Å, when observing in the [SII] Å line may be present near km/s, with the system velocity being km/s (thus, at km /s relative to the maximum of the primary line component). There may be contributions from the [NII] Å line to H at about km/s and km /s ( and km/s from the principal component); from the [NII] Å line at about km/s ( km/s relative to the main component); and the Å night sky line, if it is not completely subtracted, at km/s.
2.2 MPFS Observations
We observed selected regions in the galaxy using the integral-field Multi-Pupil Fiber Spectrograph (MPFS) at the primary focus of the 6-m telescope (Afanasiev et al. 2001; see also http://www.sao.ru/hq/lsfvo/devices.html). The detector was a -pixel EEV 42-20 CCD array. The spectrograph enables simultaneous recording of spectra from 256 spatial elements (structurally designed as square lenses) that form an array of elements in the plane of the sky. The angular size of each image element is .
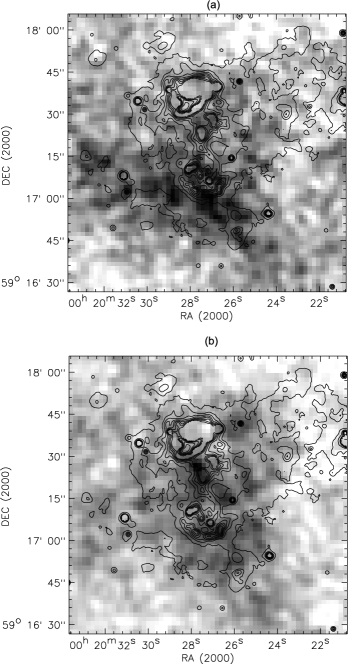
In this study, we partially use spectra for three of the six fields observed for IC10 with a resolution of about 6.5 Å in the range Å, their positions are shown in Fig. 1b.
We reduced our observations using software developed at the SAO Laboratory of Extragalactic Spectroscopy and Photometry, working in the IDL environment. The result of this reduction is a data cube in which each image element is represented by a spectrum of 2048 elements.
We also used images of the galaxy in the [SII] and H lines that we obtained earlier (Lozinskaya et al. 2008). The image in the [SII] (6717+6731) Å lines displayed in Fig. 1a is based on narrow-band direct imaging with SCORPIO; the monochromatic H image in Fig. 1b was obtained by integrating the fluxes in the spectra derived from FPI observations.
3 RESULTS OF THE OBSERVATIONS
3.1 Kinematics of Ionized Gas
We studied the kinematics of the ionized gas in the region of violent star formation, including HL 111 and HL 106, using the observations with the scanning FPI in the H and [SII] Å lines. We also used the MPFS observations for comparison.

Taking into account the complex, multi-shell, fine-filamentary structure of the studied region and the presence of the multiple sources of stellar wind mentioned in the Introduction, the region required an extremely detailed analysis of its radial-velocity field.
The first stage of the analysis consisted of a systematic search for areas with high (supersonic?) velocities or other kinematic peculiarities. For this purpose, we used our scanning-FPI observations to cover the entire program region in two perpendicular directions with a grid of abutting sections, along which we plotted diagrams of the gas radial-velocity distribution (so-called diagrams). We performed a search of high-velocity features in both H and [SII] Å lines observations.
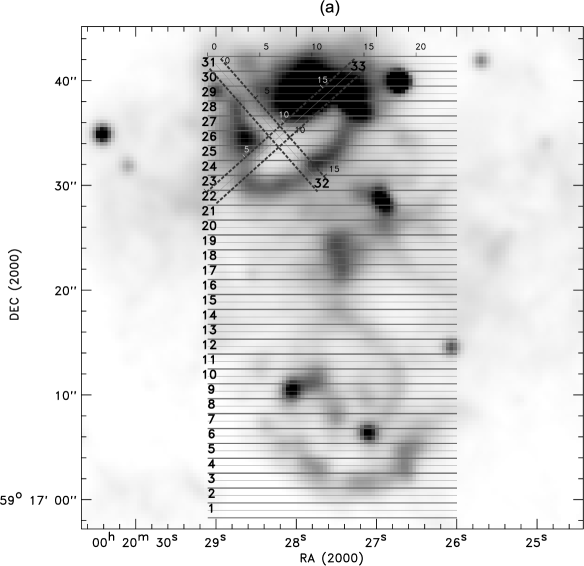
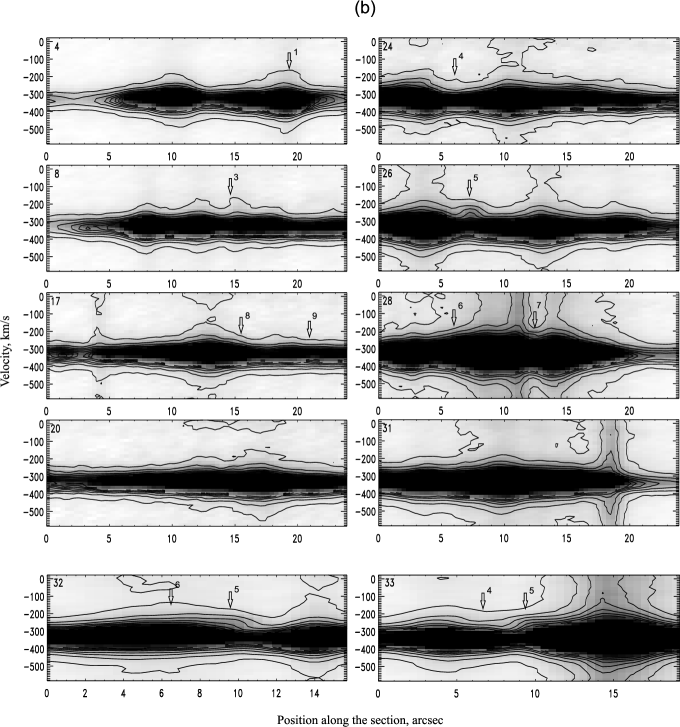
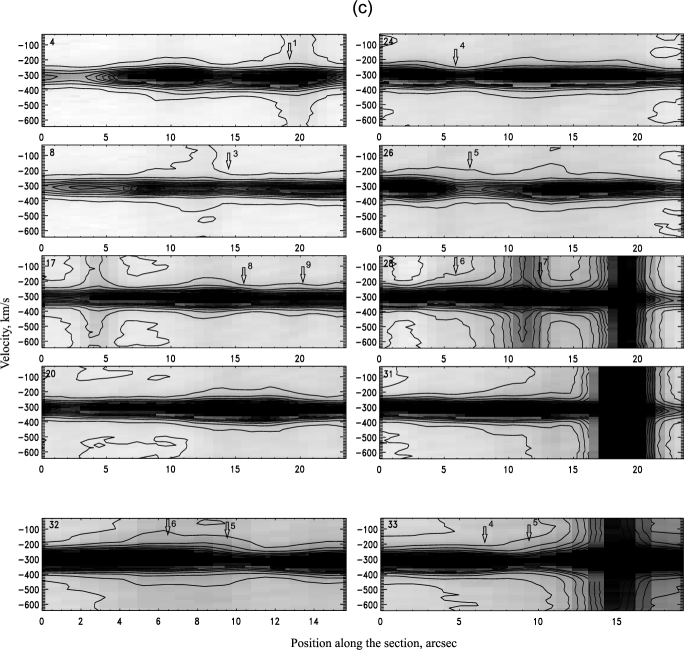
Figure 2 presents an image in the H line showing the positions of the sections in the east-west direction. We plotted diagrams in both lines along these sections. We show the most interesting diagrams in the H and [SII] Å lines as examples. To convenience, the sections in the figure have “markings” in arcseconds. The arrows in Figs. 2b, 2c indicate the places used to plot the profiles of the two lines shown in Fig. 4 below.
The second stage of our study consisted in a more detailed analysis of the kinematics for those regions where our systematic search had revealed velocity shifted line features. For this purpose, we plotted diagrams for individual nebulae on a large spatial scale and also considered the profiles of both lines.
Two diagrams of this kind and their positions on the image of the nebula HL 111 are shown in Fig. 2 (sections No. 32 and No. 33). These diagrams clearly show weak high-velocity features inside the cavity (marked with arrows).
The positions of the H and [SII] Å profiles obtained from our FPI observations are shown in Fig. 3. Figure 4 presents the corresponding H (top) and [SII] (bottom) profiles in relative units.
When deriving the profiles, we fit the main component of the line with a Voigt function. Weak high-velocity components were identified as excesses above the Voigt wings; the residual line features remaining after subtraction of the Voigt profile were fitted with Gaussians. Thus, the figure displays for each line: the observed profile, its fit with a Voigt function, its high-velocity components identified as excesses above the Voigt wings (fitted with Gaussians), and a sum of all the identified components (which virtually coincides with the observed profile).
Summarizing the results of our analysis of the ionized-gas kinematics in the region of violent star formation, we can draw the following conclusions.
According to our FPI observations, the gas velocity in the region containing the nebulae HL 111 and HL 106 is from km/s to km/s. Velocity variations from to km/s can be noted in the [SII] line. The mean velocity of the ionized gas in the region of violent star formation is km/s.
These findings agree with the H measurements of Thurow and Wilcots (2005) (whose observations cover one-third of the bright star-forming region we are studying, in its western part; see Fig. 5 in Thurow and Wilcots 2005). The neutral gas in the region has the same mean velocity (Willcots and Miller 1998; see below).
The diagrams plotted from our FPI observations in H and the [SII] lines did not show a classical “velocity ellipse” (with the radial velocities of the front and back sides of the expanding shell decreasing in magnitude with radius in the plane of the sky). The individual cross sections presented in Fig. 2 reveal slight deviations of the velocity of the line maximum from the mean velocity derived for “unperturbed” gas in the region, but such deviations never exceed 15 -20 km/s. The velocities determined for the line maximum, i.e. those corresponding to the brightest emission, suggest a possible expansion velocity of the HL 111 shell within 10 -15 km/s. At the same time, some regions of the nebula HL 111 exhibit profile asymmetry or weak features in the red line wing, at a level of about of the maximum intensity, at velocities between km/s and km/s. High-velocity features in the blue line wing are seen between km/s and km/s.
It follows from Figs. 3 and 4 that the most prominent high-velocity features are observed in the red wing of the H line, in an irregularly shaped cavity inside HL 111.
A similar pattern is observed for the nebula HL 106. The velocities measured for the maximum of the H line and characterizing the brightest clumps in the shell exhibit small variations, and imply a possible mean expansion velocity not exceeding 10- 15 km/s. Weak features in the H wings, at about of the maximum intensity, are observed in HL 106 at velocities between km/s and km/s and between km/s and km/s.
There also exist appreciable features in the red wing of the [SII] Å line in the inner cavity of the nebula HL 111, at the same velocities as for H (Fig. 4). The good coincidence between the velocities of weak features in the wings of both lines is also observed in other regions of the studied complex, supporting their reality. The fact that some regions of the complex display weak H wings, while the [SII] Å observations do not indicate such wings, can be explained by the low intensity of the latter line (it is about an order of magnitude weaker than H).
We used MPFS observations of three fields in the region to check the FPI results. The MPFS observations were used to derive average profiles of the H, [SII] Å, and [NII] Å lines for the three fields shown in Fig. 1b.
We do not reproduce the corresponding line profiles here because the MPFS observations have a much poorer spectral resolution than the FPI observations. However, our MPFS observations fully confirm the presence of the weak H and [SII] Å wings detected with the FPI. Due to their low spectral resolution, the velocities of the weak line components sometimes differ considerably from those derived from the FPI observations (by as much as 50–100 km/s). Therefore, we used the MPFS data only to verify the presence of red line wings in these regions, while all our velocity estimates were made from the FPI observations.
We wish to emphasize that weak features can be detected in line wings in several regions of this complex of violent star formation, but their intensities do not exceed of the line peak intensity. The [SII] Å profile appears more symmetric, but this line’s integrated brightness is between and of that of the H line, making the identification of weak wings less reliable in this case.
The most prominent high-velocity features in the red H wings are observed in an irregularly shaped cavity inside the shell of HL 111, near the cluster 4-2.
Thurow and Wilcots (2005) noted the presence of red H wings in the western part of the region between HL 111 and HL 106. However, the velocities of the feature left after subtraction of the main line component, given in Table 4 of Thurow and Wilcots (2005) ( km/s), differ from our measurements for the same places.
3.2 Kinematics of Neutral Gas
The large-scale kinematics of the neutral hydrogen in IC 10 was studied by Wilcots and Miller (1998). The HI velocity dispersion in the complex of violent star formation and, in particular, in the extended surroundings of M24 is not the highest in the galaxy (Wilcots and Miller 1998, Fig. 14). The mean velocities at the maximum of the 21-cm line give a possible expansion velocity of the large arc structures revealed by Wilcots and Miller (1998) not exceeding 10–15 km/s.
We reanalyzed the data cube of VLA observations of IC 10 in the 21 cm line, which was made available to us, to study in more detail the “local” structure and kinematics of the HI in the close neighborhood of the star-forming complex and the brightest nebulae, HL 111 and HL 106. For this purpose, we used data with an angular resolution of , or about 20 pc for the distance of 800 kpc.
The results of our analysis are presented in Figs. 5 and 6. Figure 5a shows the H image of the bright region of violent star formation, overlaid with the integrated brightness distribution in the 21 cm line. Figure 5b shows the same H image overlaid with the distribution of neutral hydrogen emitting at km/s, close to the velocity of ionized gas in HL 111 and HL 106. Figure 5a indicates the presence of a band with the highest column density of neutral hydrogen, extending from northeast to southwest between HL 106 and the Synchrotron Superbubble that coincides with the absorbing dust band in the optical images of the region. (The unique Synchrotron Superbubble in IC 10, earlier believed to be formed by multiple explosions of about a dozen supernovae (Yang and Skillman 1993; Thurow and Wilcots 2005), was demonstrated by Lozinskaya and Moiseev (2007) to be a hypernova remnant.)
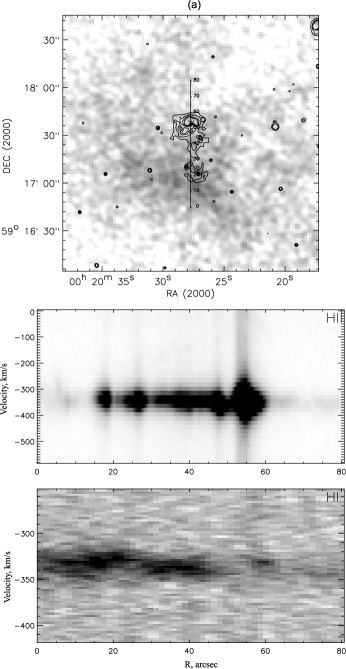
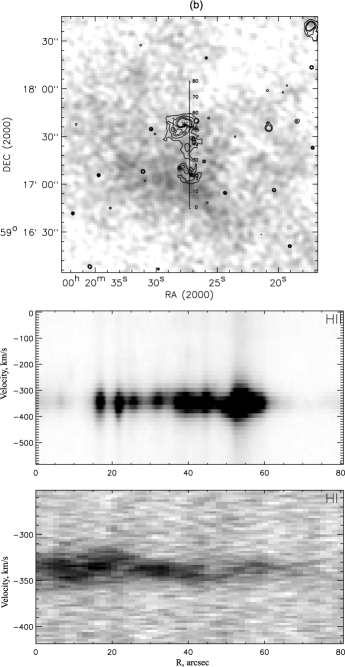
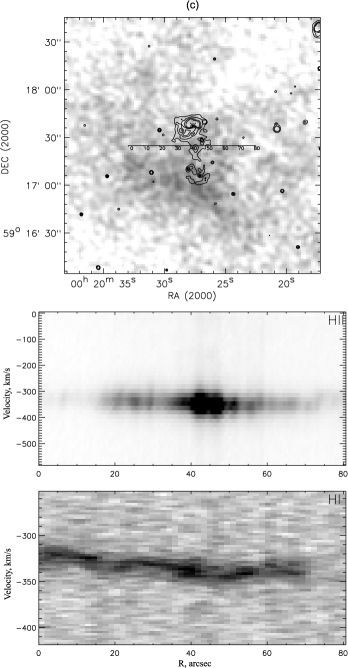
It follows from Fig. 5b that a “local” extended HI cloud emitting at the same velocity as the ionized gas is observed in the vicinity of the bright star-forming region that includes HL 111 and HL 106.
Figures 6a–6c present some of our diagrams for the emission of the ionized and neutral gas in the same direction. The positions of the corresponding directions are shown in the overlaid images of the region in the 21 cm and H lines (isophotes).
It follows from the displayed diagrams that an expanding shell of neutral gas is present just outside the ionized shell nebula HL 111 (see the positions 37–57 in Fig. 6a, 35–56 in Fig. 6b, 35–56 in Fig. 6c). The mean radial velocity of this outer neutral shell is km/s, i.e. it coincides with the mean velocity of the optical nebula. The mean expansion velocity of the HI shell surrounding HL 111 is km/s, so that the receding side of the neutral shell has a mean velocity of about 10 km/s and the approaching side a mean velocity of about 15 km/s. Weaker features of the expanding neutral gas shell are observed at velocities differing by up to km/s from the mean “unperturbed” velocity.
Thus, apart from the extended shells of neutral gas, about in size visible in the entire field of the galaxy in Fig. 9 of Wilcots and Miller (1998), our detailed analysis of 21 cm observations has revealed a neutral shell about in size around the optical nebula HL 111. The mean expansion velocity of this shell is km/s; weak features of the 21 cm line correspond to an expansion velocity about 30 km/s. This expanding neutral shell could have formed under the influence of wind from a group of WR stars that belong to M24 as well as from the above-mentioned clusters 4–1 and 4–2 (cf. Section 4).
It follows from Fig. 6 that a similar “local” shell, expanding at a mean rate of km/s, is also observed around the nebula HL 106 in the southern part of the region of violent star formation (positions 4–29 in Fig. 6a, 4–28 in Fig. 6b, 8–27 in Fig. 6c). Here, we also observe weaker features corresponding to expansion at velocities up to 25 km/s. The sources of mechanical energy responsible for the formation of the HI shell around HL 106 are probably the WR stars R2 and R10 and the clusters 4–4 and 4–3.
Note that both the detected neutral shells have non-uniform brightness distributions and a clumpy structure. The receding side of the HI shell around HL 111 is fainter than the approaching side, in virtually all sections crossing it in different direction. In contrast, as a rule, the receding side of the neutral shell around HL 106 is brighter.
The third link in the chain of expanding shells situated in the high-density cloud of neutral gas is the HI shell around the Synchrotron Superbubble (Lozinskaya et al. 2008). This third shell is at the opposite side of the dense gas and dust band and expands with the highest mean velocity of km/s, which can be naturally explained with a more powerful energy source, such as a hypernova explosion (Lozinskaya and Moiseev 2007).
The cross-section shown in Fig. 6c passes the faint regions of ionized gas between HL 111 and HL 106. We also see local “perturbations” of neutral gas here, against the smooth change of the mean HI velocity in the direction from east to west. The highest neutral-gas velocities vary between km/s and km/s relative to the mean velocities for the corresponding regions. Similar local neutral-gas “perturbations” are also visible in other diagrams, to the east and west from the bright region of violent star formation (to save space, we do not reproduce them here).
4 DISCUSSION
The galaxy IC 10 is a very promising object for studies of the interaction of stellar winds and supernovae with interstellar gas in a region of intensive star formation. First, it is the nearest Irr galaxy with violent star formation; second, it follows from the arguments presented in the Introduction that the most recent star formation event in the galaxy is also the closest overall in time. We are studying the structure and kinematics of ionized and neutral gas in the region of the recent star formation burst in detail. This bright region includes the nebulae HL 111 and HL 106 and is located in the northern part of the highest density HI cloud in the galaxy (Wilcots and Miller 1998), connected with the highest-density cloud of molecular gas (Leroy et al. 2006; Bolatto et al. 2000) and the brightest IR emission from heated dust (Bolatto et al. 2000). The column density of this cloud is cm-2; according to Wilcots and Miller (1998) and Leroy et al. (2006), the column density towards M24 is cm-2. This is above the star formation threshold for dwarf galaxies ( cm-2) according to Begum et al. (2006), and can naturally explain the location of the center of the latest violent star-formation event at this position in IC 10.
Early estimates of light extinction and distance to IC 10 varied strongly due to the low galactic latitude of IC 10; current estimates agree.
According to our estimates (Lozinskaya et al. 2009), the color excess for the galaxy’s HII regions is ; based on old stellar populations, Vacca et al. (2007) derived , . A similar value, , was found by Kniazev et al. (2007) from planetary nebulae; Sanna et al. (2008a,b) used three different methods to derive the distance moduli , , and . According to Tikhonov and Galazutdinova (2009) , kpc. Taking into account all these estimates, we take the distance to IC 10 to be kpc for the purposes of this study. (The recent estimate by Kim et al. (2009), kpc, does not significantly change our results.)
The color excess in the region of HL 111 is somewhat below the mean level for the galaxy derived from old stars and below the reddening estimated for other HII regions (Hunter 2001; Vacca et al. 2007; Lozinskaya et al. 2009, and references therein).
Our long-slit spectrograph observations yielded in the nebula HL 111 and in HL 106. From the MPFS observations in this study (the M24 field in Fig. 1b), we derived the mean in the bright region of HL 111 and inside the cavity. We can identify two local maxima here: the color excess in the north-west of the central bright part, HL 111c, reaches and in the south-east, .
Vacca et al. (2007) obtained based on young blue stars for the region of HL 111, in agreement with our estimates. In the central part of the galaxy closest to HL 111 (field S4), the color excess was derived by Sanna et al. (2008b), and a reddening decrease from the central star-forming region to the periphery of the galaxy was detected. Both these findings are easy to explain. On the one hand, the central star-forming region is adjacent to the highest-density cloud of neutral and molecular gas in the galaxy, and it is quite probable that some of its regions are embedded in this cloud. On the other hand, a local decrease in the reddening could mean that the wind from young stars of the most recent star-formation event has swept away the surrounding gas.
The HL 111 shell around M24 is the brightest and most interesting object in the star-forming complex. As is noted in the Introduction, the brightest star M24, which was earlier resolved into three components, is actually a close group of stars consisting at least of six blue stars, four of which are possible WR candidates (Vacca et al. 2007). The cluster 4-1 identified by Hunter (2001) near the brightest, northern part of the shell nebula HL 111 is the richest and youngest in the galaxy; it also includes the close group of WR stars M24. In the middle of the cavity inside the shell of HL 111 is the cluster 4-2. The radius of 4-1 at its half-brightness level is 5 pc, while the radius of 4-2 is 3 pc; the ages of both clusters are three to four million years (Hunter 2001). (We use the term “cluster” following Hunter (2001); in fact, it was demonstrated by Hunter (2001) that most stellar groups identified in IC 10 were OB associations, comparable in the number and concentration of their stars to average associations in the Galaxy and Magellanic Clouds.)
The stellar density in the field around M24 is very high; Vacca et al. (2007) found stars from two star-formation bursts in this central region: one burst younger than 10 million years, and another older burst with million years. According to Vacca et al. (2007), young blue stars in the region of M24 form an association, with a size at the half-brightness level of about 6 pc. This is actually the cluster 4-1 discovered by Hunter (2001): because the coordinates of the star M24-A in Vacca et al. (2007) are in error by about (Vacca 2009), the relative positions of the association and the cluster 4-1 in Fig. 13 of Vacca et al. (2007) are incorrect, and in fact, these objects coincide. Old red stars are uniformly distributed in the field. The location of the two populations of different ages along the line of sight also differs: Vacca et al. (2007) concluded based on the color excesses that the blue stars forming the association were situated at the front boundary of the high-density cloud, in front of the population of old stars. We show below that the results of our kinematic study do not unambiguously confirm this location for the young stars.
According to Vacca et al. (2007), 19 blue stars of spectral type O8 or earlier identified in the central cluster around M24, including four WR candidates, provide an ionizing flux of about photons/s. With the electron density of cm-3 we measured in the region, this flux is sufficient to explain the observed bright optical emission of the gas in HL 111. Young stars of the cluster 4-2 provide an additional source of ionizing radiation.
Interaction of the winds from the stars of M24 and the two clusters 4-1 and 4-2 with the ambient gas can also explain the observed small velocity deviations at the maximum of the H and [SII] lines, as well as the weak high-velocity features in their wings. According to our diagrams (Fig. 2 displays some of them as examples), the observed shifts of the mean velocity at the maxima of the H and [SII] lines indicate a possible systematic expansion velocity of the bright shell HL 111 not exceeding 10–15 km/s. At the same time, we are the first to detect weak high-velocity features in the H line wings in the cavity inside HL 111, which are displaced towards positive velocities by up to 100–120 km/s relative to the velocity at the line maximum. The features in the blue wings of the H line are somewhat weaker here.Weak features displaced towards positive and negative velocities are also observed in the [SII] Å line (Fig. 4). The location of these high-velocity motions in the image of HL 111 suggests they are associated with winds from the stars of M24 belonging to the cluster 4-1, as well as from the stars of the cluster 4-2. Note that the most prominent features in the red wings of the line are revealed near the cluster 4-2.
Generally speaking, the weak high-velocity features shifted towards positive velocities, like those we observe most clearly in the cavity inside HL 111, should be associated with the receding side of the wind-swept, blister-type shell, at the far boundary of the high-density cloud. However, if, as Vacca et al. (2007) believe, the young blue stars of M24 and the surrounding cluster are located at the front boundary of the high-density cloud, the receding side of the shell should be brighter and have a lower velocity than the approaching side. Vacca et al. (2007) favor such a localization because of the lower reddening of the young M24 stars and the cluster compared to old stars in the field. However, we cannot rule out the possibility that M24 and the parent young star cluster are located at the back side of the HI layer, and that their low reddening is due to strong winds from several WR stars that have swept away the ambient gas, considerably reducing the local extinction.
If the stars of M24 are located closer to the far side of the high-density gas layer, it becomes easy to explain the observed velocity pattern. In this case, bright features of ionized-gas lines with low shifts correspond to the bright approaching side of a blister-type shell in a high-density medium, whereas weak high-velocity features correspond to the blister’s receding side in a low-density medium. This model is favored by the results of our studies of the neutral-gas kinematics. The fact that the approaching side of the HI shell around HL 111 is brighter than the receding side in virtually all of our 21 cm diagrams indicates a lower density of the ambient neutral gas at the far side of the envelope.
However, if the localization suggested by Vacca et al. (2007) is correct, we are forced to assume that the observed high velocities in the red line wings characterize a shock induced by the stellar wind, which propagates in a rarefied medium between high-density gas clumps in the cloud. In fact, the distribution of the HI column density displayed in Fig. 5 provides evidence for a non-uniform “clumpy” structure of the ambient neutral hydrogen; the same is also indicated by the diagrams in Fig. 6. In this case, the weak high-velocity features in the blue line wings could be associated with a stellar-wind-induced shock propagating in a low-density medium at the approaching side of the swept shell.
In both described schemes for the relative location of the HI layer and the young stars, the kinetic energy of the wind from the four WR stars detected here and from the two young clusters, 4-1 and 4-2, is more than sufficient to form the bright shell nebula HL 111 35 pc in size and the expanding HI shell around it, even taking into account the reduced mass-loss rate in low-metallicity galaxies. (According to Bouret (2003), the mass loss rate depends on metallicity as , where . For in the galaxy IC 10 (Lozinskaya et al. 2009, and references therein), the stellar winds become weaker by a factor of two to five.)
We found the electron density in the nebula HL 111 using the intensity ratio of the [SII] doublet lines from our MPFS observations. In its brightest part, HL 111c, the density reaches cm-3, decreasing to cm-3 in weaker regions. These estimates agree with those based on slit-spectrograph observations by Lozinskaya et al. (2009).
In the classical theory of Castor et al. (1975) and Weaver et al. (1977), the time required for a stellar wind to sweep out the HL 111 shell, which is 35 pc in size and expanding at a rate of km/s, is yrs, in agreement with the duration of the WR stage. Here, the required energy of the stellar wind in an unperturbed medium with a density of cm-3 reaches erg/s. For a metallicity of , this energy corresponds to the wind from the four WR stars belonging to M24. An additional source of mechanical energy is the wind from the stars of the two clusters 4-1 and 4-2. In both spatial schemes, the bright line-profile features at low velocities are due to gas behind the front of the shock propagating in a high-density medium, while the weak features in the wings at high velocities of about 100–120 km/s are due to the emission of gas behind the front of the shock in a low-density medium.
We can compare the structure and kinematics of the ionized and neutral gas in the neighborhood of the center of recent star formation M24 and HL 111 to an isolated star-forming region studied in detail in the wing of the Small Magellanic Cloud: the young cluster NGC 602 and the related nebula N90. Observations in the 21 cm line and the optical provide evidence that the cluster NGC 602 was formed at the periphery of an HI cloud, and that the nebula N90 is a blister at its edge (Nigra et al. 2008). Here, in contrast to the M24 – HL 111 region in IC 10, the blister and cloud edge are situated in the plane of the sky, considerably simplifying interpretation of the observations. The age of NGC 602 is about four to five million years (Hutchings et al. 1991; Carlson et al. 2007), the same as the age of the clusters 4-1 and 4-2. The two elongated groups of young stars detected here probably indicate propagating star formation (Gouliermis et al. 2007). Parameters of the HI cloud are also very similar to those of the star-forming region in IC 10: its column density is cm-2, its diameter is 220 pc, and its mass is about . The ionized shells N90 and HL 111 in IC 10 are also similar: the size of N90 in H is 40–50 pc, with ionized-gas velocities between 175 and 184 km/s. Thus, the nebula N90, like the bright shell HL 111, is kinematically very “quiet” judging from the velocities at the line maximum. Unlike HL 111, the region of N90 reveals no high-velocity features in the line profile, which can be explained by the spatial orientation of the “blister”.
The nebula HL 106 is located towards the molecular cloud that is brightest in the CO line. Figure 1b shows the structure of this cloud, overlaid on the H image of the region. (We plotted a combined map of the cloud by putting together maps for its individual components: B11a, B11b, B11c, and B11d from Fig. 7 in Leroy et al. 2006.)
The distribution of interstellar extinction in the field can clarify the relative position of the high-density cloud and the nebula HL 106 in the line of sight. The slit spectrogram PA 331 (the positions in Fig. 1 of Lozinskaya et al. 2009) reveals a color excess at the eastern edge of HL 106 and the CO cloud B11b from a comparison of the observed line-flux ratio, H, to the theoretical ratio H (Aller 1984). Only here does the color excess reach its highest value, , however the values observed in the center of the region crossed with the slit are average for the region, .
In the present study, we used the same lines from our MPFS observations to estimate the color excess in the western part of HL 106 and the cloud B11b (Fig. 1b). The color excess at the bright arc near the WR star R10 is , then decreases towards the shell center to values of about , and further increases to near the compact HII region HL 106a in the central part of the CO cloud.
The extinction for the six brightest compact HII regions in the area was determined from observations in the Br line by Borissova et al. (2000). For the compact region Br5, coincident with HL 106a, ; the color excesses in three other Br sources of the star-forming complex are within . The values derived in this study differ somewhat from the data of other authors, however it indicate a higher extinction in the central part of the CO cloud B11b. (Note the systematic shift of the coordinates of the Br sources in Table 2 of Borissova et al. (2000); for this reason, their positions in Fig. 16 of Hunter (2001) are incorrect. We independently determined the positions of these compact sources from the Br isophotes by identifying them in the H image of the galaxy.)
Thus, the existing estimates indicate a slight increase in the extinction in the region of the CO cloud B11b, by about , corresponding, for solar abundances, to an increase in the column density by cm-2. Even taking into account the low metallicity of IC 10, this is a small fraction of the column density towards the high-density cloud, which reaches cm-2 (Wilcots and Miller 1998). The total density of neutral and molecular hydrogen derived from observations of CO emission in the region is cm-2 (Leroy et al. 2006; Bolatto et al. 2000). Thus, it may be that the optical nebula HL 106 is not behind the dense layer of clouds, but is instead partially embedded in it. Such a relative position of HL 106 and the molecular cloud is also favored by the fact that the far side of the HI shell we detected around HL 106 is brighter than the front side (Figs. 6a, 6b).
Note that the cloud B11b is probably physically associated with the optical nebula. First of all, the radial velocity of the CO cloud B11b ( km/s according to Leroy et al. 2006) exactly coincides with the velocity of the ionized gas in the shell HL 106 (Figs. 3, 4). The most important thing, however, is that the brightest southern arc of HL 106 exactly follows the edge of the B11b cloud (Fig. 1b). This perfect coincidence cannot be due to chance, and testifies to a physical association between the thin ionized shell and the molecular cloud B11b. It is possible that the shell HL 106 exactly outlining the CO cloud B11b was formed by photo-dissociation of molecular gas at the edge of this cloud and ionization by UV radiation from the WR stars R2 and R10 and the two clusters 4-3 and 4-4 (Fig. 1). The age of these clusters estimated in Hunter (2001) is about 20- 30 million years.
Our study of the kinematics of ionized and neutral gas in the nebula HL 106 has demonstrated that we observe here a pattern similar to that for HL 111. The velocities derived from the maxima of the H and [SII] lines and characterizing the brightest clumps in the nebula show slight variations and give a mean expansion rate of the shell of 10- 15 km/s. Weak features are seen in the line wings in HL 106, at levels of about of the peak intensity, at velocities km/s and km/s.
The outer neutral-gas shell around HL 106 also has a size and expansion rate similar to those for the HI shell around HL 111.
As in HL 111, it is easy to establish that the winds from the WR stars R2 and R10 and from the clusters 4-3 and 4-4 supply a mechanical energy sufficient to form the shell.
The kinematics of gas in the star-formation complex results from the complicated structure of the ambient neutral gas in the region, the presence of molecular clouds and numerous sources of stellar wind. In this situation, it is difficult to expect regular morphology and kinematics of the ionized gas in the region of violent star formation.
As was shown using the example of the two shells HL 111 and HL 106, the interaction of the WR stars and massive blue stars of the clusters situated here with the ambient HI cloud, possibly influenced by the previous stellar generation, can explain the observed slight deviations of the mean velocity at the maxima of the H and [SII] lines, as well as the weak high-velocity features in their wings.
The column density of neutral hydrogen is lower in the western part of the region between HL 111 and HL 106 (Fig. 5). As it was demonstrated in Section 3.1, high-velocity features are also observed here in the H and [SII] Å line profiles. The effects of the winds from the three WR stars located here M13, M12, and M14 can explain the presence of high-velocity wings in this region. The winds from these stars produce a clear pattern of interaction with the ambient medium: weak arc and ring structures are observed at this position (Fig. 1). The two brighter, compact HII regions, HL 111a and HL 111b, are probably the highest-density clumps of the HI cloud ionized by these stars. Here, at the western edge of the cloud, the winds from WR stars disrupt the “parent” HI cloud most strongly because of the reduced neutral-gas density.
As was demonstrated in Section 3.1, weak high-velocity features in the wings of both lines are also observed in other regions of the star-formation complex. It is easy to understand the abundance of high-velocity motions in the complex, given the high density of stellar-wind sources and the non-uniform ambient interstellar medium.
The study of the large-scale kinematics of neutral hydrogen in IC 10 presented by Wilcots and Miller (1998) revealed extended shells of neutral gas about in size (cf. Fig. 9 in Wilcots and Miller 1998). Our re-analysis of the 21-cm VLA observations of IC 10 was aimed at a more detailed study of the “local” structure and kinematics of HI in the star-formation complex. As a result, we were able to identify two local neutral shells about in size around the two brightest optical nebulae, HL 111 and HL 106, to measure their expansion rates, and to suggest possible sources of the kinetic energy needed to form them.
We also detected neutral-gas motions with velocities up to 30 km/s on scales of to the east and west of the complex of bright nebulae. WR stars and young clusters that can initiate such motions are located here.
5 CONCLUSIONS
We have used our observations of the galaxy IC 10 using the SAO 6-m telescope with the SCORPIO focal reducer in the Fabry- Perot interferometer mode and with the MPFS panoramic spectrograph to study the structure and kinematics of ionized gas in the central region of intense recent star formation. We have also used archival 21-cm VLA observations to examine the structure and kinematics of neutral gas in the area. The velocity of the ionized gas in the region of violent star formation, which contains the brightest nebulae, HL 111 and HL I06, varies between and km/s, with a mean velocity of about km/s. The neutral gas in the region has the same velocity. These findings agree with the H measurements of Thurow and Wilcots (2005) (whose observations cover one-third of the bright star-forming region we have studied) and with the estimates of Wilcots and Miller (1998) based on 21 cm data.
We have demonstrated that the mean expansion rate of the bright shells HL 111 and HL 106 do not exceed 10- 15 km/s. We have also detected for the first time high-velocity wings of the H and [SII] emission lines at velocities between and km/s and between and km/s in the inner cavity of the nebula HL 111, as well as in other parts of the violent star-formation complex.
The archival 21-cm VLA observations revealed two neutral shells about in size around the nebulae HL 111 and HL 106. The mean expansion rate of both HI shells is 15 -20 km/s, and the highest expansion velocity of neutral-gas clumps reaches 25 -30 km/s. We have suggested possible sources of the kinetic energy needed to form the HII shells and the surrounding HI shells.
We also detected neutral-gas motions with velocities up to 30 km/s on scales of to the east and west of the complex of bright nebulae. The WR stars and young clusters located here are able to initiate such motions.
We have discussed a spatial scheme for the interaction between the stellar and gaseous populations in the central violent star-formation complex in the galaxy.
ACKNOWLEDGEMENTS
This study was supported by the Russian Foundation for Basic Research (project code 07-02-00227). The study was based on observations with the 6-m telescope of the Special Astrophysical Observatory, which is funded by the Ministry of Education and Science (registration number 01-43). The authors thank W.D. Vacca for discussions of the fit of coordinates of the star M24-A in his paper; E. Wilcots for providing the data cube of the HI observations; and N.Yu. Podorvanyuk for providing one of the codes used to reduce these data. We have made use of the NASA/IPAC Extragalactic Database (NED), which is operated by the Jet Propulsion Laboratory, California Institute of Technology, under contract with the National Aeronautics and Space Administration (USA).
REFERENCES
Afanasiev, V. L., Dodonov, S. N., and Moiseev, A. V., in: Stellar dynamics: from classic to modern, eds Osipkov, L. P., Nikiforov, I. I. (Saint-Petersburg: Saint-Petersburg Univ. Press, 2001), p. 103.
Aller, L. H., Physics of thermal gaseous nebulae (D. Reidel Publ. Comp., 1984).
Begum, A., Chengalur, J. N., Karachentsev, I. D., et al., Monthly Not. Roy. Astron. Soc. 365, 1220 (2006).
Bolatto, A. D., Jackson, J. M., Wilson, C. D., and Moriarty-Schieven, G., Astrophys. J. 532, 909 (2000).
Borissova, J., Georgiev, L., Rosado, M., et al., Astron. and Astrophys. 363, 130 (2000).
Bouret, J. C., Lanz, T., Hillier, D. J., et al., Astrophys. J. 595, 1182 (2003).
Carlson, L. R., Sabbi, E., Sirianni, E., et al., Astrophys. J. (Letters) 665, L109 (2007).
Castor, J., McCray, R., and Weaver, H., Astrophys. J. (Letters) 200, L107 (1975).
Chyzy, K. T., Knapik, J., Bomans, D. J., et al., Astron. and Astrophys. 405, 513 (2003).
Crowther, P. A., Drissen, L., Abbott, J. B., et al., Astron. and Astrophys. 404, 483 (2003).
Gil de Paz, A., Madore, B. F., and Pevunova, O., Astrophys. J. Suppl. Ser. 147, 29 (2003).
Gouliermis, D. A., Quanz, S. P., and Henning, T., Astrophys. J. 665, 306 (2007).
Hodge, P. and Lee, M. G., Publs Astron. Soc. Pacif. 102, 26 (1990).
Hunter, D. A., Astrophys. J. 559, 225 (2001).
Hutchings, J. B., Cartledge, S., Pazder, J., and Thompson, I. B., Astron. J. 101, 933 (1991).
Kim, M., Kim, E., Hwang, N., et al., Astrophys. J. 703, 816 (2009); e-Print arXiv:astro-ph/0907.4844.
Kniazev, A. Y., Pustilnik, S. A., and Zucker, D. B., Monthly Not. Roy. Astron. Soc. 384, 1045 (2008).
Leroy, A., Bolatto, A., Walter, F., and Blitz, L., Astrophys. J. 643, 825 (2006).
Lozinskaya, T. A. and Moiseev, A. V., Monthly Not. Roy. Astron. Soc. 381, 26L (2007).
Lozinskaya, T. A., Moiseev, A. V., Podorvanyuk, N. Yu., and Burenkov,A. N., Pis’ma Astron. Zh. 34, 243 (2008).
Lozinskaya, T. A., Egorov, O. V., Moiseev, A. V., and Bizyaev, D. V., Pis’ma Astron. Zh. 35, 811 (2009).
Massey, P., Armandroff, T. E., and Conti, P. S., Astron. J. 103, 1159 (1992).
Massey, P. and Holmes, S., Astrophys. J. (Letters) 580, L35 (2002).
Massey, P., Olsen, K., Hodge, P., et al., Astron. J. 133, 2393 (2007).
Moiseev, A. V., Bull. Spec. Astophys. Observ. 54, 74 (2002); e-Print arXiv:astro-ph/0211104.
Moiseev, A. V., Egorov, O. V., Astrofiz. Byull. 63, 193 (2008).
Nigra, L., Gallagher, J. S., Smith, L. J., et al., Publs Astron. Soc. Pacif. 120, 972 (2008); e-Print arXiv:astro-ph/0808.1033.
Richer, M. G., Bullejos, A., Borissova, J., et al., Astron. and Astrophys. 370, 34 (2001).
Royer, P., Smartt, S. J., Manfroid, J., and Vreux, J., Astron. and Astrophys. 366, L1 (2001).
Sanna, N., Bono, G., Stetson, P. B., et al., Astrophys. J. (Letters) 688, L69 (2008a).
Sanna, N., Bono, G., Monelli, M., et al., Mem. Soc. Astron. Ital. 79, 747 (2008b).
Sharina, M. E., Chandar, R., Puzia, T. H., Coudfrooij, P., and Davoust, E., Monthly Not. Roy. Astron. Soc. in press (2010); e-Print arXiv:astro-ph/1002.2144v1
Thurow, J. C. and Wilcots, E. M., Astron. J. 129, 745 (2005).
Tikhonov, N. A. and Galazutdinova, O. A., Pis’ma Astron. Zh. 35, 829 (2009).
Vacca, W. D., private commun. (2009).
Vacca, W. D., Sheehy, C. D., and Graham, J. R., Astrophys. J. 662, 272 (2007).
Weaver, H., McCray, R., Shapiro, P., and Moore, R., Astrophys. J. 218, 377 (1977).
Wilcots, E. M. and Miller, B. W., Astron. J. 116, 2363 (1998).
Yang, H. and Skillman, E. D., Astron. J. 106, 1448 (1993).
Zucker, D. B., Bull. Amer. Astron. Soc. 32, 1456 (2000).
Zucker,D. B., Bull. Amer. Astron. Soc. 34, 1147 (2002).