Anisotropic and quasipropagating spin excitations in superconducting Ba(Fe0.926Co0.074)2As2
Abstract
Inelastic neutron scattering from superconducting (SC) Ba(Fe0.926Co0.074)2As2 reveals anisotropic and quasi-two-dimensional (2D) magnetic excitations close to Q - the 2D antiferromagnetic (AFM) wave-vector of the parent BaFe2As2 compound. The correlation length anisotropy of these low energy fluctuations is consistent with spin nematic correlations in the - model with 1. The spin resonance at 8.3 meV in the SC state displays the same anisotropy. The anisotropic fluctuations experimentally evolve into two distinct maxima only along the direction transverse to Q above 80 meV indicating unusual quasi-propagating excitations.
pacs:
74.20.Mn, 74.25.Ha, 74.70.-b, 78.70.NxThe unconventional superconductivity in the newly discovered RFeAs(OF) (R = rare earth) superconductors Kamihara2008 with critical temperatures up to 55 K Chen2008 ; Ren2008 emerges upon suppression of an antiferromagnetic (AFM) phase and is accompanied by a spin resonance in the magnetic excitation spectrum Christianson2008-1 ; Lumsden2009-1 ; Pratt2009 ; Chi2009 ; Li2009 ; Qiu2009 , indicating a close connection between magnetism and superconductivity.
In the tetragonal structure of parent ferropnictides, degenerate magnetic states and frustration arise from competition between nearest-neighbor (NN) and next-NN (NNN) AFM exchange couplings. Magnetic frustration is thought to produce an emergent nematic degree of freedom Chandra1990 , which couples to orthorhombic distortions, inducing a structural transition Fang2008 ; Xu2008 ; Fernandes2009 . Nematic fluctuations may also be present in the superconducting (SC) phase Fernandes2009 , potentially leading to local spin and electronic anisotropies within the Fe layers. The relationship between nematicity and unconventional superconductivity in iron arsenides chuang2010 is a subject under intense debate.
Here we examine the in-plane wave-vector dependence of magnetic fluctuations in SC Ba(Fe0.926Co0.074)2As2 Ni2008-1 over a wide range of energies using inelastic neutron scattering (INS). Our results show that the anisotropic spin fluctuations within the Fe layer consistent with the square symmetry of the Fe layer evolve into unusual modes propagating only along the direction of ferromagnetic (FM) near neighbor spin correlations. We also find an analogous Q-space anisotropy of the spin resonance in the SC state.
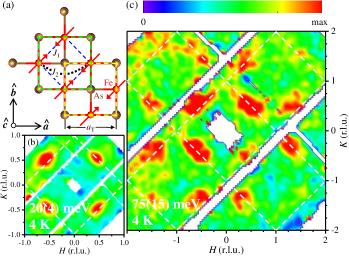
High-quality Ba(Fe0.926Co0.074)2As2 single crystals display a sharp SC transition at 22.2 K Ni2008-1 . INS measurements were performed on the wide Angular-Range Chopper Spectrometer (ARCS) at the Spallation Neutron Source with incident energies up to 250 meV and on the HB-3 triple-axis spectrometer at the High Flux Isotope Reactor with fixed final energy at 14.7 meV. The mosaic of the coaligned samples (5.40 g, 26 crystals) for the ARCS (HHL) measurements is 3.30 and 3.50 full width at half maximum for rotations about the and directions, respectively. The HB-3 measurements in the (HK0) scattering plane were carried out on a realigned subset of six of the ARCS crystals with a total mass of 2.58 g and a mosaic spread of 0.53 for both and directions.
An overview of the dependence of the magnetic scattering at 4 K measured by the ARCS is shown in Figs. 1(b) and 1(c). Due to the 2D nature of the spin fluctuations Christianson2008-1 ; Lumsden2009-1 ; Lester2010 , we present L-integrated data. Maxima are observed for , and being integers, as for the AFM stripe ordering in BaFe2As2. The scattering peaks are quite broad and feature a distinct anisotropy, indicating short-ranged spin correlations with an anisotropic correlation area in the paramagnetic state. Similar observations in Ba(Fe0.935Co0.065)2As2 Lester2010 and paramagnetic CaFe2As2 Diallo2010 suggest that this anisotropy is a universal property of spin fluctuations in the iron arsenides. The spin-space anisotropy of magnetic fluctuations in BaFe1.9Ni0.1As2 Lipscombe2010 bears not directly related to the reciprocal space anisotropy observed here.
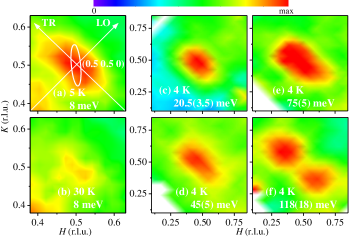
In Figs. 2(c)-2(f), all scattering patterns display a twofold symmetry with respect to . In particular the Q-width is considerably larger along the direction transverse (TR) to Q than along the longitudinal optical (LO) direction. Two distinct maxima split off in the TR direction at 100 meV as shown in Fig. 2(f). Figure 1(a) shows that the TR direction at corresponds to FM spin correlations in the stripe AFM structure. At first sight, it might seem that this twofold symmetry breaks the fourfold symmetry of the Fe square lattice. However, Fig. 1 shows that the point already has twofold symmetry. While the twofold symmetry of the observed scattering pattern thus does not break the symmetry of the Fe sublattice, it indicates a spin-correlation area that is anisotropic with respect to the direction of correlated NN spins.
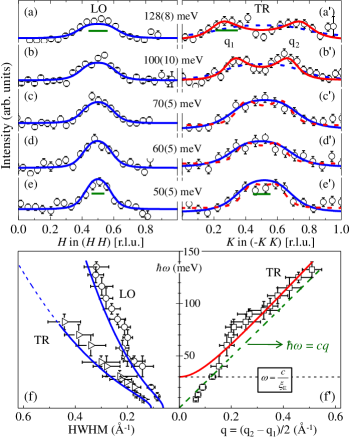
The quality of the data can be ascertained in constant energy cuts passing through along the LO and TR directions (circles in Fig. 3). We analyze our data by starting with the assumption that, in the low-, low- limit, the spin fluctuations near an AFM critical point can be described by a diffusive model Moriya1985 ; Inosov2009 . As in Ref. Diallo2010 , this model can be extended to include anisotropic spin correlation lengths within the Fe layer,
| (1) | |||||
Here represents the strength of the AFM response function, is a damping constant and and are spin correlation lengths along LO and TR directions relative to . Fits to the neutron intensities, , where is the magnetic form factor of the Fe2+ ion, were performed by a procedure where was varied while keeping = meV as obtained from fitting the 30 K data in Fig. 4(a). The resulting averaged anisotropy of the LO and TR spin-correlation lengths is given by the ratio ( Å)/( Å) = at 4 K. Despite the expectation that the diffusive model is valid only at low energies, we find that the parameters above describe constant energy cuts over the entire energy range in the LO direction, as shown in Figs. 3(a)-3(e). Along the TR direction, the diffusive model works well up to 80 meV [Figs. 3(c′)-3(e′)]. Above 80 meV, the TR spectrum splits into two peaks as shown in Figs. 3(a′) and 3(b′) that cannot be described by the diffusive model (to be discussed).
The spectral features within the diffusive model are described by a single peak centered at whose -space half-width at half maximum (HWHM) depends on energy according to . To confirm the validity of the diffusive model over a wide energy range, we show that the Lorentzian HWHM of the constant energy cuts vs energy agrees with the as shown in Fig. 3(f), which also highlights the anisotropy between LO and TR widths.
The in-plane anisotropy is consistent with an itinerant description of the dynamical magnetic susceptibility due to the ellipticity of the electron pockets at Knolle2010 . Alternatively, a local-moment picture yields the same phenomenology and allows the anisotropy to be associated with competing NN () and NNN () exchange interactions. We thus note that our analysis cannot address the question of the appropriateness of an itinerant or local-moment description for the iron arsenides. For a region of stripe AFM correlations corresponding to , the LO (TR) direction is along AFM (FM) correlated spins [Fig. 1(a)]. When evaluated in the - model, the dynamical magnetic susceptibility near takes an identical form to model Eq. (1), allowing the anisotropy observed in the correlation lengths to be associated with the exchange ratio. Specifically it can be shown that Diallo2010 . indicates that is AFM and acts to destabilize (stabilize) FM (AFM) near-neighbor correlations. Using the experimental correlation lengths we obtain = 1.0 0.2 at 4 K, which is similar to the ratio found in Ba(Fe0.935Co0.065)2As2 Lester2010 , and in the AFM ordered CaFe2As2 Diallo2009 ; Zhao2009 , and indicates NNN interactions are important in the iron arsenides. We emphasize that the observed anisotropy does not break the fourfold symmetry of the Fe square lattice but it does imply anisotropic correlations and hence interactions between NN spins. The inferred exchange ratio is indeed within the regime of frustrated magnetism () where spin nematic properties have been predicted.
The absence of any splitting in the LO direction is unusual because one expects the diffusive excitations to evolve into damped spin-wave modes at short wavelengths (high energies). Assuming a typical conical spin-wave dispersion, constant energy cuts should display ringlike features at high energy, instead of split maxima. Rather, the TR splitting bears some similarity to magnetic excitations in incommensurate spin-density-wave systems such as Cr Fawcett1988 , and in the FeTe1-xSex pnictide superconductors Lumsden2009-2 . The phenomenological Sato-Maki function Sato1974 has been used to describe the spin fluctuations in these incommensurate systems. However, in our case, there is no indication of incommensurability at low energies and we thus treat the TR excitations as damped propagating modes by including a ballistic term in the diffusive model,
| (2) |
where corresponds to the velocity of the propagating mode and is an effective TR correlation length. The TR splitting above 80 meV can be fit to Eq. (2), shown as solid lines in Figs. 3(a′) and 3(b′). This produces = Å and c = meVÅ. The obtained is somewhat larger than = Å from Eq. (1). Despite the unusual splitting, we find that is comparable to the spin-wave velocity in the TR direction in AFM ordered CaFe2As2 (300-350 meVÅ) Diallo2009 ; Zhao2009 . Lester et al.Lester2010 report a similar TR velocity (230 meVÅ) in paramagnetic Ba(Fe0.935Co0.065)2As2.
To better determine the evolution of the TR splitting, we also fit the experimental TR spectra with a symmetric pair of Lorentzians, whose peak splitting is plotted in Fig. 3(f′). According to the ballistic model, a diffusive (single-peaked) response is obtained below 33 meV in the TR direction. Above this energy, the ballistic model predicts split peaks at , which only approaches a damped simple harmonic oscillator (DSHO) response at high energies (with splitting ), as shown in Fig. 3(f′). The actual observation of a splitting depends on the statistical quality of the data which, in our case, allows a clear observation of the TR splitting only above 80 meV. However, the relatively low value of explains the agreement between the TR velocities obtained from our ballistic model and DSHO model of Lester et al. Lester2010 . In the LO direction, the magnetic response appears diffusive at all energies (subject to the statistical quality of the data), apparently due to a much higher LO velocity. The report of a LO dispersion with 580 meVÅ based on DHSO model analysis is probably a lower bound. The finite correlation length of the system allows one to estimate that 56 meV suggesting that most if not all of the LO data analyzed in Ref. Lester2010 is within the diffusive limit.
Despite the agreement of the diffusive/ballistic models along the LO and TR directions, the nature of the excitations in the full plane is still unclear. The unidirectional nature of the split modes and the strong anisotropy cannot be easily modeled by Eq. (2), which highlights the anomalous nature of the high-energy magnetic spectrum.
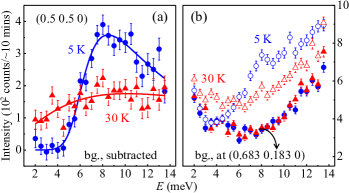
We now discuss the effects of superconductivity on the anisotropic spin excitations, which were examined using the triple-axis spectrometer HB-3. Figure 4 shows the inelastic intensity at constant as a function of energy transfer at 5 and 30 K. Spectral weight is pushed to higher energies as superconductivity develops. To obtain magnetic scattering only, we measured identical energy scans at a point in reciprocal space Q = (0.683 0.183 0) [Fig. 4(b)], where no appreciable temperature dependence is observed between 5 and 30 K. We subtracted their average from the data at to obtain the background-subtracted magnetic scattering spectra shown in Fig. 4(a). The spectra can be fit, respectively, to a single imaginary-pole-response function in the normal state (overdamped response) and a damped harmonic oscillator in the SC state. The normal state relaxation rate at the critical wave-vector is found to be meV. In the SC state the damping rate has decreased to meV and the resonance energy is meV.
To examine the spatial correlations associated with the spin resonance, we measured the momentum dependence at 8 meV and 5 K [Fig. 2(a)]. A quasielliptical feature around was observed similar to the data below 80 meV. The anisotropic scattering extends beyond the instrumental resolution ellipsoid shown in Fig. 2(a). At 30 K [Fig. 2(b)], the normal-state spin fluctuations display a similar momentum space anisotropy. The LO and TR cuts through the resonance can also be well fit to the diffusive model yielding peak positions (TR) and peak widths that are consistent with those data as shown in Figs. 3(f) and 3(f′). We conclude that within errors there are no changes in the spatial correlations above and below . It is predominantly the spectrum of magnetic excitations that is modified by superconductivity.
To summarize, we have observed collective magnetic excitations in SC Ba(Fe0.926Co0.074)2As2 close to the wave-vector of the parent BaFe2As2 compound. At low energies, the excitations have a pronounced in-plane anisotropy that can be associated with frustrated versus satisfied NN interactions in the parameter regime of dynamic nematic correlations. The spin resonance in the SC state is found to have the same anisotropy. At energies above 80 meV, quasipropagating modes are observed experimentally along the TR direction, while modes in the LO direction appear to have a very large energy scale.
This research is supported by the U.S. Department of Energy (USDOE), Office of Basic Energy Sciences, Division of Materials Sciences and Engineering. Ames Laboratory is operated for the USDOE by Iowa State University under Contract No. DE-AC02-07CH11358. Johns Hopkins Institute for Quantum Matter is supported by the USDOE under Grant No. DE-FG02-08ER46544. Research at Oak Ridge National Laboratory’s High Flux Isotope Reactor and Spallation Neutron Source is sponsored by the Scientific User Facilities Division, Office of Basic Energy Sciences, DOE. We thank M. J. Loguillo for assistance with the ARCS measurements. We acknowledge the expert technical assistance of Scott Spangler at JHU in machining the sample mount for HB-3 measurements.
References
- (1) Y. Kamihara et al., J. Am. Chem. Soc. 130, 3296 (2008).
- (2) X. H. Chen et al., Nature (London) 453, 761 (2008).
- (3) Z. A. Ren et al., Chin. Phys. Lett. 25, 2385 (2008).
- (4) A. D. Christianson et al., Nature 456, 930 (2008).
- (5) M. D. Lumsden et al., Phys. Rev. Lett. 102, 107005 (2009).
- (6) D. K. Pratt, W. Tian, A. Kreyssig, J. L. Zarestky, S. Nandi, N. Ni, S. L. Bud′ko, P. C. Canfield, A. I. Goldman, and R. J. McQueeney, Phys. Rev. Lett. 103, 087001 (2009).
- (7) S. X. Chi et al., Phys. Rev. Lett. 102, 107006 (2009).
- (8) S. Li, Y. Chen, S. Chang, J. W. Lynn, L. Li, Y. Luo, G. Cao, Z. Xu, and P. Dai, Phys. Rev. B 79, 174527 (2009).
- (9) Y. Qiu et al., Phys. Rev. Lett. 103, 067008 (2009).
- (10) P. Chandra, P. Coleman, and A. I. Larkin, Phys. Rev. Lett. 64, 88 (1990).
- (11) C. Fang, H. Yao, W.-F. Tsai, J. P. Hu, and S. A. Kivelson, Phys. Rev. B 77, 224509 (2008).
- (12) C. Xu, M. Mller, and S. Sachdev, Phys. Rev. B 78, 020501(R) (2008).
- (13) R. Fernandes, L. Vanbebber, S. Bhattacharya, P. Chandra, V. Keppens, D. Mandrus, M. Mcguire, B. Sales, A. Sefat, and J. Schmalian, Phys. Rev. Lett. 105, 157003 (2010).
- (14) T. M. Chuang et al., Science 327, 181 (2010).
- (15) N. Ni, M. E. Tillman, J.-Q. Yan, A. Kracher, S. T. Hannahs, S. L. Bud′ko, and P. C. Canfield, Phys. Rev. B 78, 214515 (2008).
- (16) C. Lester, J.-H. Chu. J. G. Analytis, T. G. Perring, I. R. Fisher, and S. M. Hayden, Phys. Rev. B 81, 064505 (2010).
- (17) S. O. Diallo et al., Phys. Rev. B 81, 214407 (2010).
- (18) O. J. Lipscombe et al., Phys. Rev. B 82, 064515 (2010).
- (19) T. Moriya, Spin Fluctuations in Itinerant Electron Magnetism (Springer-Verlag, Berlin Heidelberg, 1985).
- (20) D. S. Inosov et al., Nature Physics 6, 178 (2010).
- (21) J. Knolle, I. Eremin, A. V. Chubukov, and R. Moessner, Phys. Rev. B 81, 140506(R) (2010).
- (22) S. O. Diallo et al., Phys. Rev. Lett. 102, 187206 (2009).
- (23) J. Zhao et al., Nature Physics 5, 555 (2009).
- (24) E. Fawcett, Rev. Mod. Phys. 60, 209 (1988).
- (25) M. D. Lumsden et al., Nature Physics 6, 182 (2010).
- (26) H. Sato and K. Maki, Int. J. Magn. 6, 183 (1974).