A mid-IR study of Hickson compact groups I :
Probing the effects of environment in galaxy interactions
Hickson compact groups (HCGs) are among the densest galaxy environments of the local universe. To examine the effects of the environment on the infrared properties of these systems, we present an analysis of Spitzer and ISO mid-infrared imaging, as well as of deep ground-based near-infrared imaging of 14 HCGs containing a total of 69 galaxies. Based on mid-infrared color diagnostics we identify the galaxies that appear to host an active nucleus, while using a suite of templates, and fit the complete infrared spectral energy distribution for each group member. We compare our estimates of galaxy mass, star formation rate, total infrared luminosities, and specific star formation rates (sSFR) for our HCG sample to samples of isolated galaxies and interacting pairs and find that overall there is no discernible difference among them. However, HCGs that can be considered as dynamically “old” host late-type galaxies with a slightly lower sSFR than the one found in dynamically “young” groups. This could be attributed to multiple past interactions among the galaxies in old groups, that have led to the build up of their stellar mass. It is also consistent with our prediction of the presence of diffuse cold dust in the intergalactic medium of 9 of the dynamically “old” groups.
Key Words.:
Infrared: galaxies — Galaxies: evolution — Galaxies: interactions — Galaxies: peculiar1 Introduction
Compact groups of galaxies were identified as systems of several galaxies that, owing to their small projected separations and signs of tidal distortion, appear to be real physical entities of gravitationally interacting systems (Hickson 1997). Since the discovery in 1877 of Stephan’s Quintet, the prototypical group, many others have been found by both visual and automated searches of the Palomar Observatory Sky Survey plates. Although the criteria for assigning group membership based only on imaging data have often been debated, it is now generally accepted that the most complete and better studied of these samples is the one compiled by Hickson (1982). His catalog of the so–called Hickson compact groups (hereafter HCGs) consists of 451 galaxies contained in 100 groups of four or more galaxies, that occupy compact configurations within relatively isolated regions where no excess of other surrounding galaxies can be seen (see Hickson 1982, for details on the criteria used). More recently, it has been revealed that the HCG catalog is incomplete because several compact groups are apparent associations of galaxies along the line of sight. However, compact group catalogs, produced with redshift information, to select galaxies that are physically close, are dense (Mamon & Diaz-Gimenez 2009).
Over the past 20 years, various detailed analyses of HCGs have been performed using multi–wavelength imaging and spectroscopy. Based on optical morphology alone, it is obvious that the overwhelming majority of HCGs display an excess of elliptical galaxies (31% of the total) while their spiral fraction is just 43%, nearly a factor of two less than what is observed in the field (Hickson 1982). Rubin et al. (1991) have found that two thirds of HCG spirals display peculiar rotation curves, while Zepf & Whitmore (1993) report that ellipticals in compact groups are likely to have irregular isophotes and exhibit lower internal velocity dispersions for their luminosities, so that they do not lie on the fundamental plane of isolated field ellipticals. Interestingly, the luminosity function derived for HCG members is deficient at the faint end compared to other samples. All these clues are consistent with an evolutionary pattern of tidal encounters and the accretion of small companions by the group members. Furthermore, Mendes de Oliveira & Hickson (1994) also show that 43% of all HCG galaxies display morphological features of interactions and mergers, such as bridges, tails, and other distortions.
The HCGs appear to occupy a unique position in the range of galaxy environments found in the local universe. While their density enhancements are high, close to those seen in rich clusters, the overdensities appear to be more locally contained, with a much smaller population involved in the enhancement. Furthermore, the HCG velocity dispersions are 250 km s-1, lower than what is seen in rich clusters but higher than that of typical loose groups. In addition, a clear correlation exists between the group velocity dispersion and the elliptical galaxy fraction, with the highest values of to be found in the most elliptical rich groups (Hickson et al 1988).
Despite this progress, several open questions remain. Are compact groups a transient phenomenon fading out after the merging of all their galaxies into a giant field elliptical? Were they more numerous in the early universe, and can they account for all, or most, present-day giant ellipticals? Are they dynamically closed systems, or can they replenish the intergalactic medium with reprocessed material in the form of diffuse tails and tidal dwarf galaxies?
A necessary step in determining of the evolutionary state of HCGs is the complete census and analysis of the member galaxies’ stellar population, gas content, and star formation properties. Even though only a few HCGs have been mapped in detail in neutral hydrogen, single-dish measurements reveal that they are generally deficient in HI with a median mass of M, two times less than what is observed in loose groups (Williams & Rood 1987; Verdes-Montenegro et al. 2001). However, the molecular gas content of their individual galaxies, as traced by the CO emission, is similar to that of interacting pairs and starburst galaxies (Leon et al. 1998). Nearly 40% of the HCG members for which nuclear spectroscopy has been obtained display evidence of active galactic nuclei (AGN), and it has been argued that those contain copious amounts of dust (Shimada et al. 2000). Up to now, however, there is scant information on the far-IR colors and luminosities of the individual galaxies of the groups, because the available IRAS measurements have typically not resolved the groups, especially at 60 and 100 m, providing only a single value and color for the ensemble of their galaxies. Despite this limitation, it has been shown that compact groups have warm far-IR colors, similar to those of merging gas-rich galaxies (Zepf 1993). If one recalls that HCGs are in fact deficient in spirals and that the far-IR flux of field ellipticals is typically below the IRAS detection limit, one may speculate that vigorous star formation activity may actually take place in some locations within the groups. Could this activity be in circumnuclear regions of weak, enshrouded AGN because of the dynamical torques exerted in the gas from small nuclear bars funneling it to the center (Combes 2001)? Would it be possible instead that there is star formation due to shocked compressed gas outside the main bodies of galaxies as seen in Stephan’s Quintet (Xu et al 1999; Appleton et al. 2006)?
A first analysis of the mid-infared properties of 12 HCG using Spitzer imagery has been presented by Johnson et al. (2007) and Gallagher et al. (2008). These authors use near- and mid-IR color diagnostics to reveal a possible excess thermal emission due to an active nucleus (AGN). They also separate the groups into three types based on the ratio of their neutral hydrogen to dynamical mass, and find that most groups are either gas-rich or gas-poor, while very few groups are found in an intermediate state. As expected, gas-rich groups are the ones that are more actively forming stars. In addition, an absence of intermediate stage groups is apparent, which would be consistent with a rapid evolution of the group members, probably the result of dynamical interactions.
In this paper we present the first results of our detailed analysis of the deep near-IR, mid-IR, and far-IR imagery of 14 HCGs and place them in the context of similar results for samples of isolated galaxies and early-stage interacting systems. In Section 2, we describe our data and reduction processes, along with the control samples used. In Section 3, we describe how we model the infrared spectral energy distribution (SED) of all galaxies in the groups. Our results on the physical properties of each galaxy such as star formation rate (SFR), stellar mass, dust content, and specific star formation rate (sSFR) are presented in Section 4. We discuss the implications of these findings in Section 5, and present our conclusions in Section 6.
2 Observations and data reduction
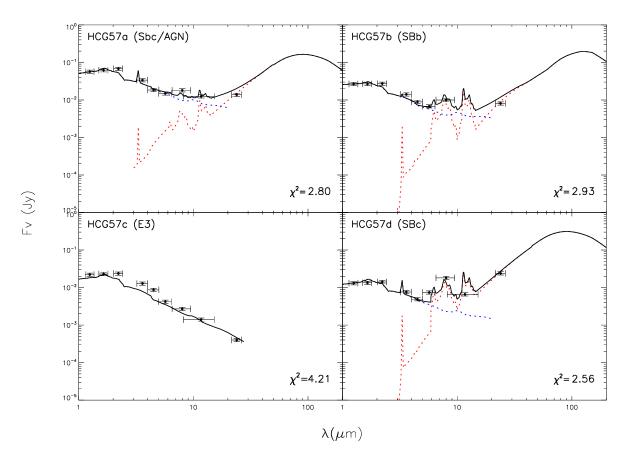
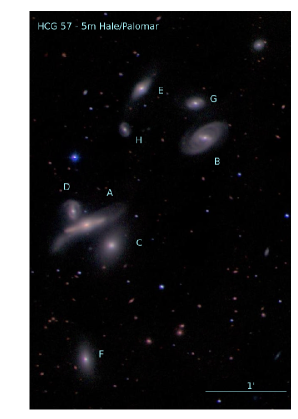
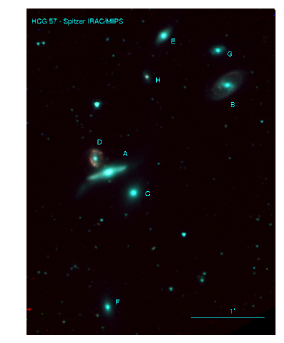
Our sample of 14 HCGs contains 69 galaxies, 31 of which are early-type and 38 late-type galaxies. It was selected in a random fashion from the original Hickson catalog (see Table 1 of Hickson 1982) and is presented in Table 1. The only constraint applied was that the group members had to be separated enough to allow more accurate photometry, but also contained enough within to be efficiently imaged by the Wide-field Infrared Camera (WIRC) at the Palomar 5m telescope. This constrains our sample to nearby groups typically with 5 or 6 members. Despite the small numbers, the sample can be considered representative of Hickson’s catalog having an early-type galaxy fraction of and a spiral and irregular galaxy fraction of just of the total. Furthermore, as we discuss in section 4.2, Kolmogorov-Smirnov (KS) tests indicate that the mass distribution of our subsample, estimated by their Ks-band luminosites, is representative of the whole HCG sample. Nine galaxies of our sample are classified as AGN based on optical spectroscopy, even though this number is probalby a lower limit given the sparse spectroscopic coverage. In Figures 1 and 2, we show typical images of one group of our sample, HCG 57, using the J, H, Ks, and IRAC filters.
2.1 Near-infared observations
Deep near-IR observations were obtained with the Wide Field Infrared Camera (WIRC) of the 5m Hale telescope at Palomar, during several observing runs in the 2002 and 2003 observing periods. All groups were imaged in the J, H, and Ks bands for an on-source time of 20 minutes per filter (Slater et al. 2004). The 20 minute exposures were taken in multiple shorter segments to avoid saturation by the sky brightness. The telescope was dithered in a 3- or 5-position pattern during the exposure. Due to sizable telescope nodding as well as dithering, it was necessary to perform astrometry on each of the shorter exposure images separately. This was done with the software-package WCSTools (Mink 2004), matching foreground stars to the USNO A2.0 and 2MASS point source catalogs. Once a World Coordinate System (WCS) was established for each image, they were pixel-resampled and coadded using the Swarp package (Bertin 2008). Source extraction was performed with SExtractor (Bertin & Arnouts 1996). The flux was calibrated to a level of 0.1mag using near-IR standards, and it was bootstrapped to 2MASS foreground stars, which were detected in both our images. Our 1 sensitivity limit was 21.5 mag arcsec-2 in J and H bands and 20.5 mag arcsec-2. A near-IR image of the group HCG 57 is presented in Figure 1.
2.2 Mid-infrared Spitzer observations
Observations of these groups were obtained between 2008 January and 2009 March in the , and m broadband filters of the Spitzer Infrared Array Camera (IRAC, Fazio et al. 2004) and the m band of the Multiband Imaging Photometer for Spitzer (MIPS, Rieke et al. 2004) (PID: 40459). The IRAC observations were obtained with a 270sec exposure per filter for each set of cameras (see Fig. 2). All groups had an angular size small enough to fit within the field of view of IRAC. The on-source time for the 24m MIPS observations was 375.4sec.
The IRAC postpipeline Basic Calibrated Data were downloaded and mosaicked onto the same grid with a pixel scale of . The 1 sensitivity limits varyied slightly for each group owing to changes in the background. Typical limits were measured to be MJy sr-1, MJy sr-1, MJy sr and MJy sr-1, for the 3.6, 4.5, 5.8, and 8.0m filters, respectively. Since most of the galaxies have disturbed morphologies, simple fixed aperture photometry was often not the most appropriate method of measuring the object flux. Thus, we carefully calculated the isophotal contours around each source to properly account for variations in the shape of the emitting region. Examining the local background for each galaxy we defined a limiting isophote 3 above the overall background and measured the flux within this region, after subtracting the corresponding sky. Even this method was challenging in some cases, so we defined the physical extent of each galaxy by hand using a polygon, and performed the photometry accordingly. The fluxes we report are for the same regions for all IRAC, and MIPS, images. Finally, we applied an extended source correction to our photometry by multiplying our measured fluxes with a correction factor of 0.91, 0.94, 0.71, and 0.74 for the corresponding 1 to 4 IRAC bands as indicated in the IRAC data handbook.
The MIPS postpipeline images have a pixel scale of , and their depth was measured as MJy sr-1 or Jy for a point source. In several cases the nuclei of galaxies were saturated and the frames were corrected using the IDP3 of IDL111IDP3 is the Image Display Paradigm 3 package available for the Interactive Data Language (IDL). We estimate that our final uncertainties in the IRAC and MIPS photometry are .
To ascertain variations between the nuclear and total mid-IR SED of each galaxy, we also performed nuclear photometry for our sources using the smallest aperture possible. The motivation behind this work was to examine whether the observed SEDs of some sources are dominated by the contribution of a strong nuclear emission, possibly due to the presence of an AGN. The apertures used were 3 pixels (3.6) in diameter for the IRAC images and 5 pixels (12.2) for the MIPS, based on the size of the corresponding point spread function (PSF).
2.3 Mid-infrared 12m ISO/CAM data
Archival observations for a fraction of the galaxies were retrieved from the Infrared Space Observatory (ISO) data archive. The observations were performed with the ISO/CAM instrument (Cesarsky et al. 1996), using the LW10 filter (Program HCGROU-A). The LW10 filter is centered on m, and covers the m range so that it matches the IRAS 12m bandpass. The pixel size was , and it is larger than the PSF of the telescope at this wavelength. The total on-source exposure time for the galaxies varied between 200 and 300sec.
The ISO/CAM data were analyzed with the CIR data processing software, an implementation of the algorithms of Starck (1999) developed by P. Chanial. The standard ISO/CAM data reduction procedure was followed. First the data, were read into the CIR environment. Then the “correct-dark-vilspa” routine was applied to correct for the dark current. This was followed by applying the multiresolution algorithm “correct-glitch-mr”. Next, the “correct-transient-fs” routine, based on the Fouks-Schubert transient correction method (Coulais & Abergel 2000), was applied to the data to remove transient effects. The frames were flat-fielded using the CIR’s library flat field, and subsequently combined to produce a final image. Some masking on the edges of the images was performed to correct for bad pixels. Photometry was performed by selecting the regions of galaxies with emission greater than 3 above the sky background noise. We estimate that the absolute uncertainty of our photometric measurements is 10, mainly owing to errors in the correction of the detector transient effect.
2.4 Comparison samples
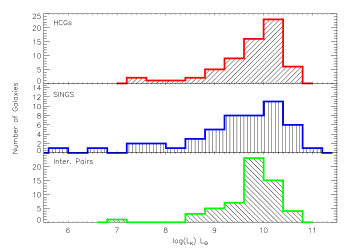
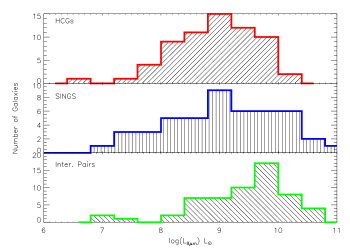
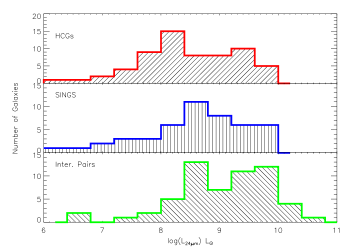
We compare our findings to the published mid-IR data on the HCG of the Johnson et al. (2007) sample, as well as on two “control” samples, for which a similar type of data exist. One is the nearby “normal” sample of 75 field galaxies from the Spitzer Infrared Nearby Galaxies Survey (SINGS; Kennicutt et al. 2003; Dale et al. 2005). The SINGS sample was selected to cover a wide range in Hubble type and luminosity. Most objects are late-type systems that have angular sizes between 5′ and 15′. It also contains four early-type galaxies (NGC 855, 1377, 3773, and 4125) with the last one being a LINER. The second comparison sample contains the 36 nearby (v11.000 km s-1) early stage interacting galaxy pairs of Smith et al. (2007a). The galaxies in the Smith sample are tidally disturbed and fairly extended, with linear sizes . We note that 13 galaxies of this sample are classified as LINERs and 3 as Seyferts. The motivation behind the comparison of our HCG sample to these samples was to investigate how the group environment affects the infrared properties of galaxies, in contrast to isolated systems, because of a single companion galaxy. The basic properties of the three samples are presented in Figure 3. The mid-IR activity in groups, as traced by the 24m and 8m luminosity, is similar in all three samples, suggestive that as samples there is no substantial difference in their SFR. This has already been pointed out by Smith et al. (2007a), who find that there was no more than a factor of two difference between the SFR in isolated (SINGS) galaxies and early stage interacting pairs. The K-band luminosities, hence the stellar mass distributions, are also similar with the exception of the interacting pairs, who do not extend to masses below M⊙.
3 Spectral energy distribution fitting
To estimate the physical properties of the galaxies in our sample in a systematic way, we first fit the observed SED of each galaxy with a set of theoretical and empirical SED models from Le Phare222For more information on Le Phare visit the web page of the package at http://www.cfht.hawaii.edu/arnouts/LEPHARE/cfhtlephare/lephare.html (see Arnouts et al. 2007; Ilbert et al. 2009). We compared the observed near-IR J, H, and Ks fluxes, as well as the mid-IR fluxes from Spitzer and ISO to the ones predicted using the Le Phare template SEDs.
Using multi-wavelength template libraries, Le Phare is able to perform a two-component galaxy SED modeling by decomposing the fit of each source into the contribution of its stellar populations and the contribution from thermal dust emission. The near-IR observations is strongly dominated by stellar blackbody emission, with a possibly small contribution from very hot dust in the case of an active nucleus (AGN). In late-type, star-forming galaxies, two of the IRAC bands, centered on 5.8 and 8m, may contain the contribution of polycyclic aromatic hydrocarbons (PAHs), and finally the m luminosity traces thermal emission from dust mostly heated in embedded star-forming regions. Consequently the templates used to fit the data should be compatible with those characteristics. A first fit of the near-IR J, H, and Ks photometry was obtained using pure stellar templates taken from the library of SEDs used by Ilbert et al. (2009) to derive galaxy photometric redshifts. The goal of this initial step was to estimate the contribution of the underlying stellar component to the emission observed in the Spitzer bands at longer wavelengths. This contribution was subsequently subtracted from the IRAC and MIPS fluxes assuming an extrapolation of a typical stellar blackbody emission, and the resulting fluxes were fitted between 5 and 24m using a separate library of IR SEDs. For the IR SEDs, we used a modified version of the IR template library of Chary & Elbaz (2001), which includes 105 star-forming galaxy IR SEDs over a broad range of total IR luminosities. These templates cover the optical to radio wavelength range, so their stellar component was systematically removed prior to the fitting with Le Phare to reproduce only the thermal dust component of our sources. For each galaxy of our sample, the best total fit was then obtained by co-adding the fit derived for the stellar component and the one obtained in the mid-IR. Galaxies with very low m emission, mostly early-type systems, were only fitted with a single stellar component, since subtracting it from the 24m flux would introduce a large uncertainty to the final estimate of the thermal dust emission.
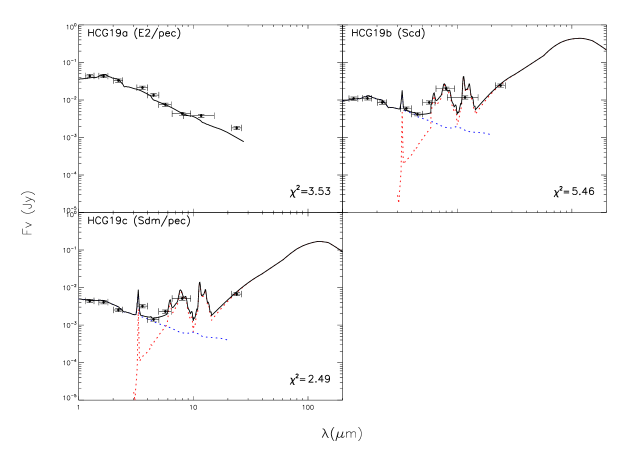
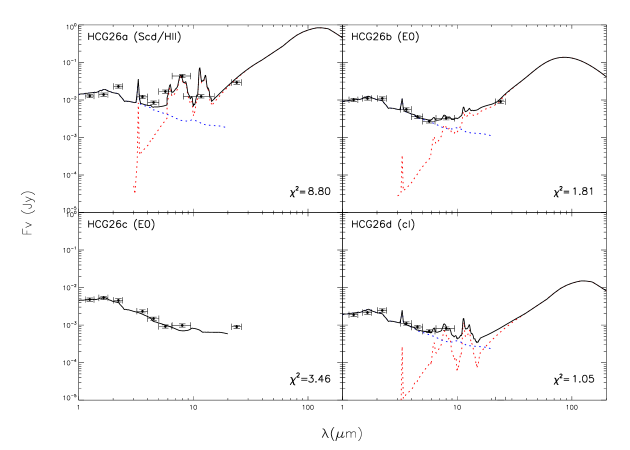
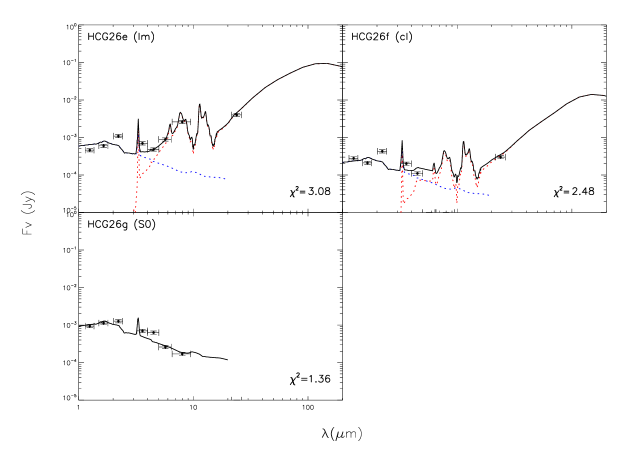
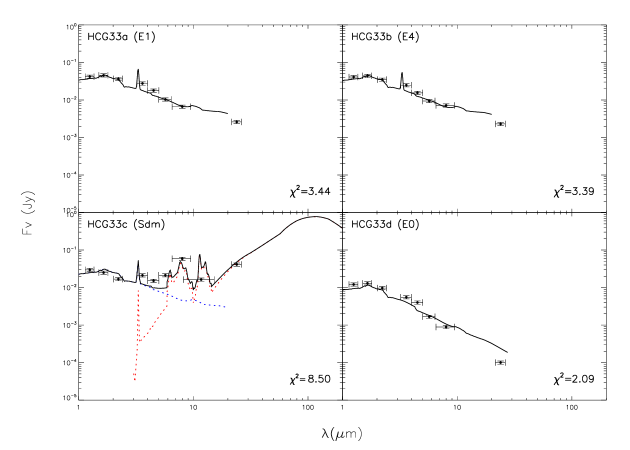
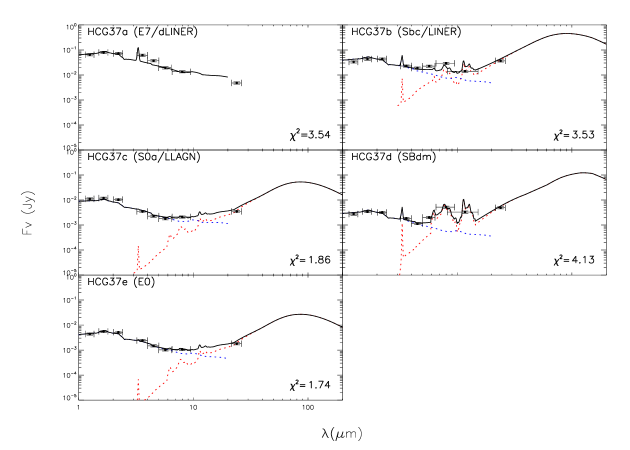
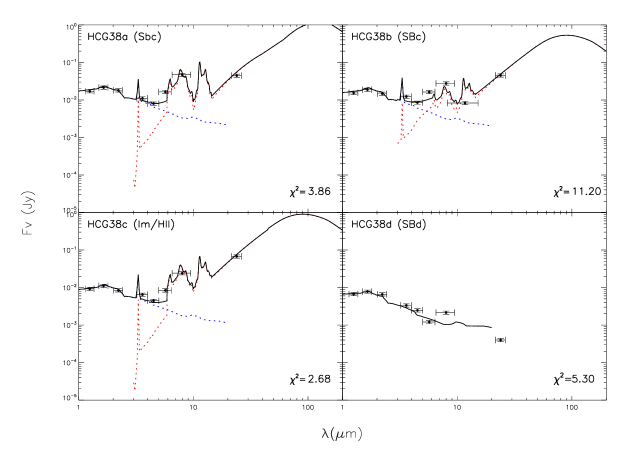
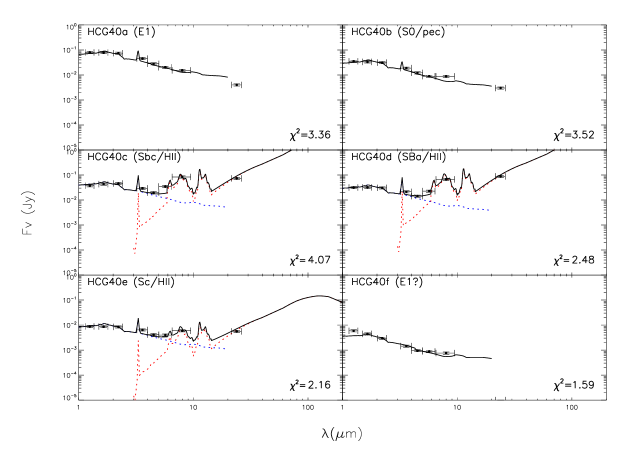
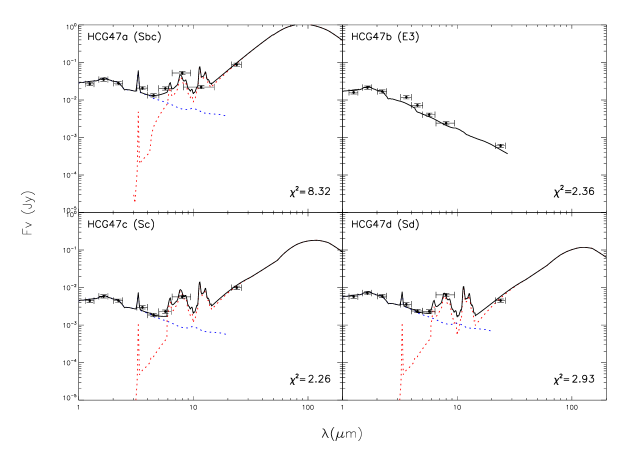
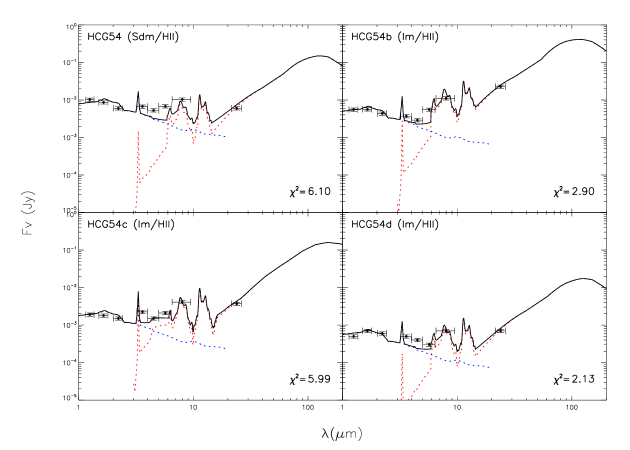
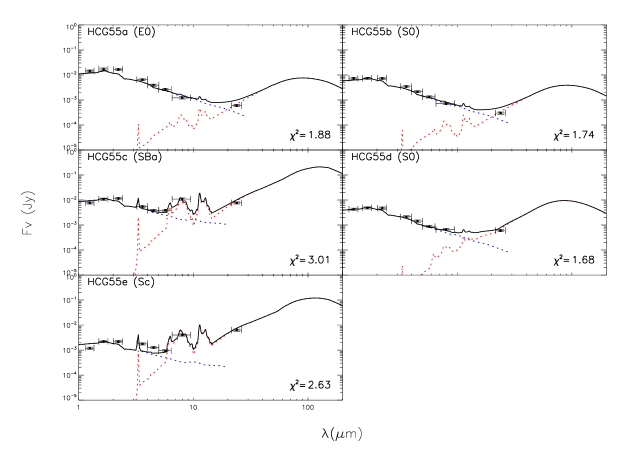
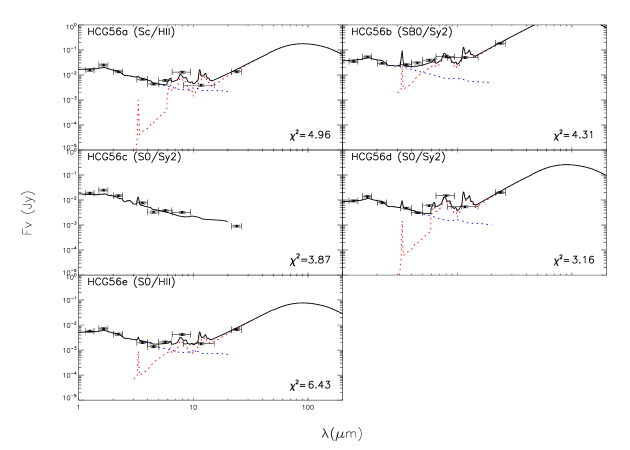
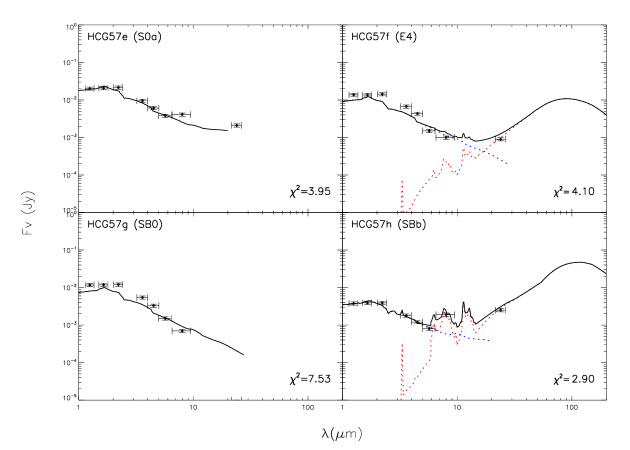
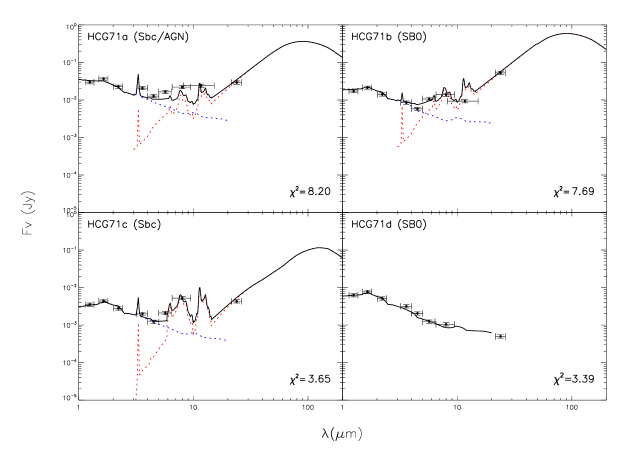
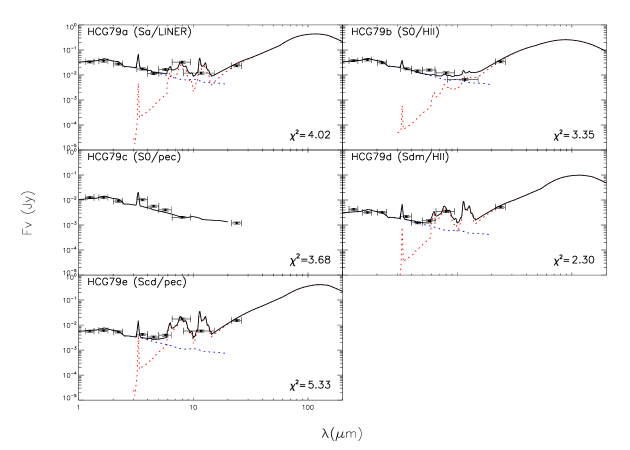
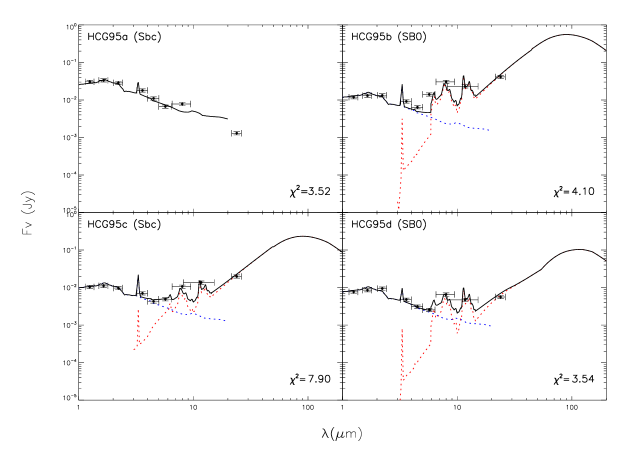
In Figure A.1 of the appendix we present the infrared SEDs of each galaxy along with the best-fit model from Le Phare. Each panel corresponds to one group; groups with more than six members are plotted in two figures. The galaxies are labeled with their HCG number, type, and spectral classification, if known. The vertical error bars indicate the uncertainty of each measurement, while horizontal bars show the bandwidth of the corresponding filter.
Most SED fits are fairly good as is evident from the plots and the corresponding reduced values, which vary between 1 and 11 and are marked in each plot. A number of galaxies display mid-IR fluxes consistent with strong PAH emission and often warm dust, a sign of enhanced star formation activity. There are, though, some galaxies (such as HCG26a, 26e, or 57a) that are not fitted as well by the templates. These galaxies display an excess emission in the Ks-band and/or mid-IR, which is suggestive of some type of nuclear activity, possibly from an AGN. Even if star formation and thus PAH emission were present in these systems, the nuclear thermal dust emission would dominate the emitted flux, resulting in rather flat or rising mid-IR spectrum.
We also compared our galaxy classification based on the templates of the SED fit to existing optical morphology classification. Our data, as do the SED fits, indicate that some of the galaxies, classified as early-type based on the optical images, do have excess dust emission. These are HCG26b, 37c, 37e, 55a, 55b, 55d, 56b, 56d, 56e, 71b, 79b, 95b, and 95d. This implies that either embedded star formation or accretion of gas-rich dwarf galaxies have fueled these systems with enough dust and gas to emit strongly in the mid-IR. All of them seem to have late-type galaxy SEDs in the infrared. Three (HCG37c, 56b, and 56d) are spectroscopically classified as AGN in the optical, while others exhibit a mid-IR SED that is suggestive of emission from an AGN. Interestingly, there are also galaxies that have IR SEDs consistent with that of an early-type galaxy. These include HCG38d and HCG95b, which are nonetheless classified as late-type in the optical. This could be due to the loss of a large fraction of their gas and dust, probably because of interactions, which would be the result of the absence of far-infrared emission. One of the galaxies in our sample, HCG 40f, which did not have a classification in the literature, has been fitted with an E1 galaxy template, consistent with its morphological appearance in the optical and infrared images.
It is known that the Ks band luminosity is a good tracer of the stellar mass because light in this band is dominated by the emission of low-mass stars, which are responsible for the bulk of stellar mass in galaxies. Similarly, the m emission is a good tracer of star formation because it originates in regions of dust mainly heated by young stars.
We used the observed Ks-band and m luminosities (LK and L24μm) to estimate the corresponding stellar mass and SFR for each galaxy. To obtain the galaxy mass, we used the Bell et al. (2003) relation where the mass, in M⊙, is (0.950.03) LK(L⊙), where LK is in units of K-band solar luminosity (LK,⊙=4.97W), with systematic errors of , owing to uncertainties in the star formation history and dust. The SFR was estimated from the m by the calibration developed by Calzetti et al. (2007) for the SINGS sample :
SFR(M⊙yr-1) = 1.27(L24μm (erg sec-1))0.885.
Our mass and SFR estimates are reported in Table 2 along with a measure of the sSFR of our sources defined as the ratio of SFR over the galaxy stellar mass.
4 Results
4.1 IRAC colors and AGN diagnostics

AGN are often deeply enshrouded in dust that may heavily absorb the emitted radiation, in particular in the UV, optical, and even in the X-rays in some extreme cases. The energy is then re-emitted isotropically at longer wavelengths in the mid- and far-IR (see Charmandaris 2008; Elitzur 2008, and references therein). As a result, active galaxies often display an excess of continuum emission at wavelengths m, compared to normal or starbursting galaxies. In addition, there is a weak PAH emission in their mid-IR spectrum, which is attributed to the destruction of their carriers by the strong radiation field surrounding the AGN (i.e. see Weedman et al. 2005; Brandl et al. 2006; Smith et al. 2007b). We can use our Spitzer infrared photometric measurements to probe for an AGN among the galaxies in our sample. Lacy et al. (2004) have defined a locus in the IRAC [8.0-4.5] vs [5.8-3.6] color-color plot populated by AGN which are dominant in the infrared. Similarly, Stern et al. (2005) propose using of the IRAC [3.6-4.5] vs [5.8-8.0] colors to identify their AGN candidates. Among our galaxies optical spectra were available for 24 Shimada et al. (2000), with 15 classified as H II galaxies and 9 as AGNs, (3 as Sy2 and 3 as LINERs).
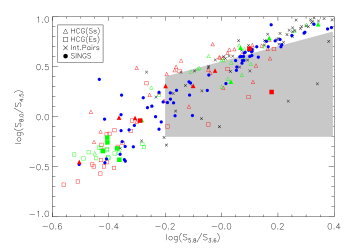
In Figure 4, we present the IRAC colors for our sample following the Lacy et al. (2004) criteria. We separate our sample in early and late-type galaxies, and identify the galaxies that we already know from optical spectroscopic observations host an active nucleus. We also include in Figure 4 the galaxies from the Johnson et al. (2007) HCG sample, as well as the SINGS and interacting galaxy samples. By construction, the galaxies located in the lower left of the color-color plot are those dominated by the stellar photospheric emission. As a result, they are expected to have very weak dust or PAH emission, if any. Most of our early-type galaxies lie in this region. On the other hand, galaxies found in the upper right quadrant of the figure should have strong PAH features, as well as some hot dust contribution, because of intense star formation, and/or AGN activity. Furthermore, as we discuss in section 4.4, most of the galaxies in this quadrant are spirals found in spiral-rich groups. According to Lacy et al. (2004), galaxies located within the shaded area are AGN candidates. A total of 16 galaxies in our sample () are AGN candidates based on this criterion, almost half of which are found in previous optical spectroscopy studies (Shimada et al. 2000; Coziol et al. 2000). These are 11 late-type systems (HCG 37b, 38b, 38c, 47c, 54abcd, 57d, 71a, 79a) and 5 early-type systems (HCG 40f, 56b, 56e, 71b, and 95b). Of those galaxies, four are spectroscopically classified as AGN, while eight are classified as H II galaxies. In addition, as we can see from their mid-IR SEDs in Figure A.1, several of them do show signs of active nuclei, such as a flat rising continuum. It is possible, though, that either because of obscuration or because some may harbor low-luminosity AGNs (LLAGNs), the colors of the AGN are diluted when we perform the photometry over the whole galaxy. To better probe the properties of the nuclear emission, we can examine the nuclear SEDs of our sample, which was obtained using circular apertures with a diameter of 3.6 in the IRAC images and 12.2 in the MIPS 24m band. Among the AGN candidates based on the Lacy plot, the ratio of the nuclear to their total flux is not constant in all mid-IR bands, in five galaxies, HCG 37b, 47c, 56b, 71a, and 79a, but it peaks at m. This suggests that the nuclear contribution which possibly caused by hot dust heated in near sublimation temperatures by an AGN, contributes substantially in this band. On the other hand, nine galaxies, HCG 38b, 38c, 54abcd, 56e, 71b, and 95b, have a rising nuclear SED and a constant ratio of nuclear to total flux in all IRAC bands. This would be consistent with their being star-forming H II galaxies.
Contrary to SINGS galaxies, which are distributed fairly uniformly along the diagonal of the color-color plot in Figure 4 and the interacting galaxy pairs which are located in the upper right quadrant due to the fact that they contain only late-type galaxies, there might be a small gap in the distribution of the HCG galaxies at the position log(S5.8/S3.6) and log(S8.0/S4.5). This gap is identified in Figure 11 of Johnson et al. (2007), even though it is more obvious there. These authors combine the mid-IR colors with estimates of the neutral hydrogen mass and dynamical mass of the their HCG sample and suggest that this small gap separates the gas-rich and gas-poor groups. The explanation is consistent with the notion that gas-poor groups will mostly contain early-type galaxies where PAH emission will be suppressed by low star formation activity; and they will populate the lower left part of the plot, while late-type gas-rich galaxies will be found on the upper right. The absence of HCG galaxies with intermediate mid-IR colors would imply that their evolution from the gas-rich to the gas-poor state is more rapid than what is observed in field galaxies, and it could be understood as the result of more frequent dynamical interactions between galaxies in groups. As a result of the interactions, tidal forces drive the gas in their nuclei and create instabilities in their disk, forcing them to use their gas in a more accelerated fashion.
In Figure 5, we also examine how the Stern et al. (2005) color-color diagnostic is applied in our data. As was the case in Figure 4, galaxies located in the lower left region of the plot have SEDs dominated by the stellar photospheric emission, while the galaxies found on the right should display strong PAH and hot dust emission. The shaded area denotes the colors of potential AGN candidates. When we compare this to Figure 4, we notice that only one galaxy, HCG56b, is identified as an AGN candidate. However, as discussed in the detail by Donley et al. (2008) the Stern criteria may suffer in low-z because of contamination from star-forming galaxies. Consequently, in this work we adopt the ones fulfilling the Lacy criteria as mid-IR identified AGN.
4.2 Star formation activity in Hickson compact groups
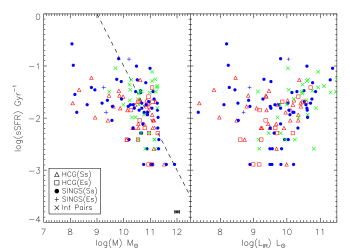
As mentioned in the previous section, one would expect that galaxies in groups would have enhanced SFR, because of tidal interactions. The m emission is a good tracer of the SFR and following the approach of (Calzetti et al. 2007), we calculated the SFR for each galaxy of our groups in Section 3. In Figure 6a, we plot the sSFR as a function of the mass of each galaxy, which was estimated using the observed K-band luminosity (Bell et al. 2003). We include 57 the galaxies of our sample that were detected in 24m. In the same figure 61 normal galaxies of the SINGS sample are presented, along with 30 of the interacting pairs of Smith et al. (2007a) for which integrated K-band 2MASS photometry was available. For the interacting pairs, the average sSFR of the two components is given. Galaxies found over the dashed line, have SFRs greater than 1M⊙yr-1. Galaxies in interacting pairs display a median sSFR of 2.96 yr-1. This is slightly higher than what is found in HCGs and field galaxies, which have a corresponding value of 1.68 yr-1. However, given the scatter seen in each population there is no strong statistical difference among them. As mentioned in Section 2.3, the interacting pair sample does not extend to the lower galaxy masses of the two other samples. However, even when we restrict the galaxy masses to a range that is identical in all three samples, an analysis using Kolmogorov-Smirnov test still indicates that there is no statistical difference between the samples. In Figure 6b, we plot the sSFRs as a function of the total infrared luminosity (LIR). For similar infrared luminosities, HCG members seem to have sSFRs similar to field galaxies and slightly lower than interacting pairs. How is this understood given that HCGs are also interacting systems?
To better address this issue, we decided to separate the late-type galaxies of the HCGs into two categories depending on whether the group they belong to has a high or low fraction of late-type galaxies. We classify a group as “spiral-rich” if fewer than 25% of its galaxies are early-type. Conversely, a group is “spiral-poor”, or elliptically dominated, if fewer than 75% of its galaxies are late-type. The sSFR is a tracer of the star formation history of a galaxy, and galaxies in compact groups do experience multiple encounters with the various group members. Consequently we would expect that if the group is dynamically “young” (that is, its galaxies are gravitationally interacting for the first time) it is more likely to be dominated by late-type galaxies. Furthermore, these spiral galaxies would have not built up much of their stellar mass, but would have larger amounts of gas and dust, as well as higher SFRs and sSFR. On the other hand, if the group is dominated by ellipticals, it could be dynamically “old”, since interactions and possible merging of its members over its history would have led to the formation of some of those ellipticals. As a result, the spirals in these groups could have already built some of their stars, and their sSFR would be lower.
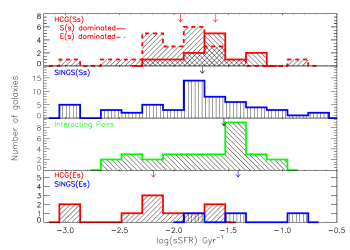
We thus present in Figure 7 histograms of the sSFR distribution of the samples. We notice that spirals in elliptically dominated groups have a median sSFR that is lower than in spiral-rich groups. However, when we examine their distribution in detail, we see that they have a median of 1.29 yr-1, while galaxies in spiral-rich groups have a median of 2.71 yr-1. As explained above, this minor difference could be attributed to the possibility that, in dynamically “old” groups, spiral galaxies have already interacted several times in the past with the other members of their groups and as a result had more time to increase their stellar mass. Also their SFR is much lower than in the past, since they have consumed most of their gas. These galaxies are located in the lower left part of Lacy’s plot.
It is interesting to note that the sSFR of spirals in spiral-rich groups is similar to the sSFR of interacting pair spirals. This appears to contrast to the fact that galaxies in compact groups do experience more interactions from their close neighbors, either major or minor mergers, than a single galaxy by its companion. A possible explanation could be that the higher velocity dispersion of compact groups (330 km s-1 Hickson et al. 1992), compared to typical values seen in near parabolic prograde encounters of galaxy pairs, reduces the gravitational impulse exerted on each galaxy. Furthermore, the complex geometry and orbits of the group members could strip some of the gas out of these galaxies rather than funnel it to the central part, thereby increasing the SFR. This is consistent with the observed morphology of the group members, since of them display features such as tidal tails, bridges, etc. (Mendes de Oliveira & Hickson 1994). Another explanation for this similarity could be that spiral-rich compact groups are simply chance alignments of interacting pairs (Mamon 2008). In this scenario, two or more interacting galaxy pairs at different redshifts have a projected separation that makes them appear as a compact group. However, this is not the case for our sample, as only real group members were considered in our analysis.
4.3 Cold dust in Hickson compact groups
For estimating the total amount of dust in a galaxy, far-IR observations are essential, since the bulk of the dust mass in galaxies is at low temperatures (K). The only far-IR data available for our sample are based on IRAS (see Allam et al. 1996), since the Akari all-sky maps have not yet been released. However, the IRAS data suffer from poor spatial resolution and in nearly all cases one cannot resolve the emission of individual group members. Even though there is no high spatial-resolution, far-IR imagery for groups, one would expect that gas and dust could be stripped from the group members during their tidal interactions. This material could remain outside the areas of the galaxies and would have low temperature (see Xilouris et al. 2006). Such a case has been detected in the nearby giant elliptical galaxy Centaurus A, where 15K dust has been detected outside the main body of the galaxy (see Stickel et al. 2004). This was understood as a consequence of the accretion by a number of gas-rich dwarf companion galaxies that surround Centaurus A and have led to the formation of its dust lane, as well as to the filaments of atomic and molecular gas that surrounds it (see Schiminovich et al. 1994; Charmandaris et al. 2000). Based on our Spitzer data, warm dust in the intragroup environment has been seen in some groups (HCG40, 54, 55, and 79) in the form of diffuse mid-IR light or an extended halo around groups members.

Using the mid-IR imaging and extrapolating to the far-IR by the SED fits in this work, we can estimate the fraction of the far-infrared luminosity that is contributed by each group member to the total far-IR luminosity of the whole group. We can calculate the “synthetic” IRAS 60m and 100m flux densities of each group and compare them to the ones deduced by Allam et al. (1996). The results are presented in Table 3 and Figure 8. In most cases, IRAS could not detect all the members of each group, so upper limits were used for then. Consequently, our total flux estimate is an upper limit. We observe that there are 9 groups, HCG19, HCG26, HCG33, HCG37, HCG55, HCG57, HCG71, HCG79, and HCG95, where the emission detected by IRAS is clearly higher than the total emission estimated using our galaxy SED fits. Most of these groups display evidence of strong tidal encounters and merging. This agrees with half or more of their members are early-type or peculiar galaxies and are classified as dynamically “old”, while only one (HCG55) has the form of a compact chain. It is thus likely that these groups have diffuse cold dust in the intragroup region. Part of this excess could also be caused by the uncertainties introduced by our SED fits when we extrapolated to the 60 and 100m flux of the galaxies. This uncertainty is real and can be seen if we notice that, in most groups, the m flux ratio is higher than the 60m one, possibly because it is farther away than our last anchor point at m. A more detailed analysis of the SEDs from the UV to the mid-IR for all these groups using the models developed by da Cunha et al. (2008), along with observations with PACS and SPIRE instrument onboard the Herschel Space Telescope, will address this issue conclusively.
5 Conclusions
In this paper we have presented our first analysis of the near- and mid-infrared SED of 69 galaxies contained in 14 Hickson compact groups, and found the following:
- Nearly half of the galaxies in the groups, 14 out of the 32, which are optically classified as ellipticals, have mid-IR emission and colors consistent with those expected for late-type systems. We suggest that this stems from enhanced star formation as a result of recent gas accretion from companion galaxies in the groups.
- Based on their integrated mid-IR color, 16 galaxies (23%) are AGN candidates. Detailed nuclear photometry reveals that 6 of these have nuclear mid-IR SEDs, which are inconsistent with a mid-IR spectrum dominated by star formation.
- We find no evidence of the SFR and build up of stellar mass, which would substantially differentiate late-type galaxies in groups from galaxies in early-stage interacting pairs, or spiral galaxies in the field. This is a surprise given that the group environment has played an important role in the evolution of the galaxies, shown by the fact that most groups contain a large fraction of early-type systems. However, late-type galaxies in dynamically “old” HCGs might have a lower, though not statistically significant, sSFR than those in dynamically “young” groups, which could be attributed to multiple past interactions.
- We investigated the contribution of each galaxy to the total far-IR emission of its group, and identify 9 groups where extended cold dust emission may be present.
Acknowledgements.
We would like to thank E. da Cunha, G. Magdis and D. Elbaz for useful discussions, an anonymous referee for the detailed comments that improved this paper. TB, VC, and TDS, would like to acknoledge partial support from the EU ToK grant 39965 and FP7-REGPOT 206469.References
- Allam et al. (1996) Allam, S., Assendorp, R., Longo, G., Braun, M., & Richter, G. 1996, A&AS, 117, 39
- Appleton et al. (2006) Appleton, P. N., et al. 2006, ApJ, 639, L51
- Arnouts et al. (2007) Arnouts, S., et al. 2007, A&A, 476, 137
- Bell et al. (2003) Bell, E.F., McIntosh, D.H., Katz, N., Weinberg, M.D. 2003, ApJS, 149, 289
- Bertin & Arnouts (1996) Bertin, E., & Arnouts, S. 1996, A&AS, 117, 393
- Bertin (2008) Bertin, E. 2008, SWarp, http://astromatic.iap.fr/software/swarp
- Brandl et al. (2006) Brandl, B. R., et al. 2006, ApJ, 653, 1129
- Calzetti et al. (2000) Calzetti, D., Armus, L., Bohlin, R. C., Kinney, A. L., Koornneef, J., & Storchi-Bergmann, T. 2000, ApJ, 533, 682
- Calzetti et al. (2007) Calzetti, D., et al. 2007, ApJ, 666, 870
- Cesarsky et al. (1996) Cesarsky, C. J., et al. 1996, A&A, 315, L32
- Charmandaris et al. (2000) Charmandaris, V., Combes, F., & van der Hulst, J. M. 2000, A&A, 356, L1
- Charmandaris (2008) Charmandaris, V. 2008, Infrared Diagnostics of Galaxy Evolution, 381, 3
- Chary & Elbaz (2001) Chary, R., & Elbaz, D. 2001, ApJ, 556, 562
- Coziol et al. (2000) Coziol, R., Iovino, A., & de Carvalho, R. R. 2000, AJ, 120, 47
- Combes (2001) Combes, F. 2001, Fueling the AGN. In Lectures on the Starburst-AGN Connection, NAOE, ed. D. Kunth, I. Aretxaga arXiv:astro-ph/0010570
- Coulais & Abergel (2000) Coulais, A., & Abergel, A. 2000, A&AS, 141, 533
- da Cunha et al. (2008) da Cunha, E., Charlot, S., Elbaz, D. 2008, MNRAS, 388, 1595
- Dale et al. (2005) Dale, D. A., et al. 2005, ApJ, 633, 857
- Donley et al. (2008) Donley, J. L., Rieke, G. H., Pérez-González, P. G., & Barro, G. 2008, ApJ, 687, 111
- Elitzur (2008) Elitzur, M. 2008, New Astronomy Review, 52, 274
- Fazio et al. (2004) Fazio, G. G., et al. 2004, ApJS, 154, 10
- Gallagher et al. (2008) Gallagher, S. C., Johnson, K. E., Hornschemeier, A. E., Charlton, J. C., & Hibbard, J. E. 2008, ApJ, 673, 730
- Hickson (1982) Hickson, P. 1982, ApJ, 255, 382
- Hickson et al (1988) Hickson, P., Kindl, E., & Huchra, J. P. 1988, ApJ, 329, L65
- Hickson et al. (1992) Hickson, P., Mendes de Oliveira, C., Huchra, J. P., & Palumbo, G. G. 1992, ApJ, 399, 353
- Hickson (1997) Hickson, P. 1997, ARA&A, 35, 357
- Ilbert et al. (2009) Ilbert, O., et al. 2009, ApJ, 690, 1236
- Johnson et al. (2007) Johnson, K. E., Hibbard, J. E., Gallagher, S. C., Charlton, J. C., Hornschemeier, A. E., Jarrett, T. H., & Reines, A. E. 2007, AJ, 134, 1522
- Kennicutt et al. (2003) Kennicutt, R. C., Jr., et al. 2003, PASP, 115, 928
- Lacy et al. (2004) Lacy, M., et al. 2004, ApJS, 154, 166
- Leon et al. (1998) Leon, S., Combes, F., & Menon, T. K. 1998, A&A, 330, 37
- Lupton (2004) Lupton, R. et al, 2004, PASP116, 816, 133.
- Mamon (1986) Mamon, G. A. 1986, ApJ, 307, 426
- Mamon (2008) Mamon, G. A. 2008, A&A, 486, 113
- Mamon & Diaz-Gimenez (2009) Mamon, G. A., & Diaz-Gimenez, E. 2009
- Mendes de Oliveira & Hickson (1994) Mendes de Oliveira, C. & Hickson, P. 1994, ApJ, 427, 684
- Mink (2004) Mink, D. J. 2002, in Astronomical Data Analysis Software and Systems VIII, ed. D. Mehringer, R. Plante, & D. Roberts, ASP Conf. Ser., 172, 498.
- Polletta et al. (2007) Polletta, M., et al. 2007, ApJ, 663, 81
- Rieke et al. (2004) Rieke, G. H., et al. 2004, ApJS, 154, 25
- Rubin et al. (1991) Rubin, V.C., Hunter, D.A., & Ford, W.K.J. 1991, ApJS, 76, 153
- Schiminovich et al. (1994) Schiminovich, D., van Gorkom, J. H., van der Hulst, J. M., & Kasow, S. 1994, ApJ, 423, L101
- Shimada et al. (2000) Shimada, M., Ohyama, Y., Nishiura, S., Murayama, T., & Taniguchi, Y. 2000, AJ, 119, 2664
- Slater et al. (2004) Slater, S. K., Charmandaris, V., & Haynes, M. P. 2004, Bulletin of the American Astronomical Society, 36, 728
- Smith et al. (2007a) Smith, B. J., Struck, C., Hancock, M., Appleton, P. N., Charmandaris, V., & Reach, W. T. 2007a, AJ, 133, 791
- Smith et al. (2007b) Smith, J. D. T., et al. 2007b, ApJ, 656, 770
- Starck (1999) Starck, J. L., et al. 1999, A&AS, 134, 135
- Stern et al. (2005) Stern, D., et al. 2005, ApJ, 631, 163
- Stickel et al. (2004) Stickel, M., van der Hulst, J. M., van Gorkom, J. H., Schiminovich, D., & Carilli, C. L. 2004, A&A, 415, 95
- Verdes-Montenegro et al. (2001) Verdes-Montenegro, L., Yun, M. S., Williams, B. A., Huchtmeier, W. K., Del Olmo, A., & Perea, J. 2001, A&A, 377, 812
- Weedman et al. (2005) Weedman, D. W., et al. 2005, ApJ, 633, 706
- Williams & Rood (1987) Williams, B.A., & Rood, H.J. 1987, ApJS, 63, 265
- Xilouris et al. (2006) Xilouris et al., 2006, ApJ, 651, L107
- Xu et al (1999) Xu, C., Sulentic, J.W., & Tuffs, R. 1999, ApJ, 512, 178
- Zepf (1993) Zepf, S.E. 1993, ApJ, 407, 448
- Zepf & Whitmore (1993) Zepf, S.E., & Whitmore, B.C. 1993, ApJ, 418, 72
| HCG | Type | z | J | H | Ks | m | m | m | m | m | m |
|---|---|---|---|---|---|---|---|---|---|---|---|
| (ID) | (mJy) | (mJy) | (mJy) | (mJy) | (mJy) | (mJy) | (mJy) | (mJy) | (mJy) | ||
| 19a | E2 | 0.014 | 43.7 | 43.4 | 33.0 | 21.3 | 13.5 | 7.5 | 4.3 | 3.8 | 1.8 |
| 19b | Scd | 0.014 | 10.9 | 11.1 | 8.6 | 5.9 | 4.2 | 8.6 | 20.0 | 11.7 | 24.2 |
| 19c | Sdm | 0.014 | 4.4 | 4.1 | 2.5 | 3.2 | 1.4 | 2.3 | 5.1 | … | 6.7 |
| 26a | Scd | 0.032 | 12.8 | 13.9 | 23.0 | 12.1 | 8.5 | 16.8 | 43.5 | 12.5 | 29.2 |
| 26b | E0 | 0.031 | 10.1 | 11.0 | 11.0 | 5.6 | 3.6 | 2.7 | 3.3 | … | 9.0 |
| 26c | S0 | 0.032 | 4.8 | 5.3 | 4.6 | 2.3 | 1.5 | 0.9 | 1.0 | … | 0.9 |
| 26d | cI | 0.030 | 1.9 | 2.2 | 2.5 | 1.2 | 0.9 | 0.6 | 0.8 | … | … |
| 26e | Im | 0.032 | 0.5 | 0.6 | 1.1 | 0.7 | 0.5 | 0.9 | 2.6 | … | 4.0 |
| 26f | cI | 0.032 | 0.3 | 0.2 | 0.4 | 0.2 | 0.1 | … | … | … | 0.3 |
| 26g | S0 | 0.031 | 0.9 | 1.1 | 1.3 | 0.7 | 0.6 | 0.3 | 0.2 | … | … |
| 33a | E1 | 0.025 | 41.7 | 45.5 | 36.5 | 27.6 | 17.9 | 10.3 | 6.6 | … | 2.6 |
| 33b | E4 | 0.026 | 40.9 | 44.0 | 34.9 | 24.8 | 15.5 | 9.4 | 7.1 | … | 2.3 |
| 33c | Sdm | 0.026 | 29.6 | 25.0 | 16.8 | 21.2 | 15.2 | 21.4 | 58.6 | 16.3 | 41.2 |
| 33d | E0 | 0.026 | 12.1 | 13.0 | 9.7 | 5.5 | 4.0 | 1.7 | 0.9 | … | 0.1 |
| 37a | E7 | 0.022 | 64.7 | 79.6 | 72.1 | 61.7 | 37.2 | 19.3 | 13.1 | … | 4.8 |
| 37b | Sbc | 0.022 | 33.2 | 43.3 | 43.6 | 22.9 | 14.4 | 14.5 | 29.2 | 14.1 | 36.7 |
| 37c | S0a | 0.024 | 11.1 | 11.9 | 10.4 | 3.5 | 2.3 | 1.8 | 2.1 | … | 3.5 |
| 37d | SBdm | 0.020 | 2.7 | 3.5 | 3.2 | 1.8 | 1.1 | 2.0 | 5.2 | 3.3 | 4.9 |
| 37e | E0 | 0.021 | 4.4 | 5.6 | 5.2 | 2.4 | 1.5 | 1.0 | 1.1 | .. | 1.8 |
| 38a | Sbc | 0.029 | 17.1 | 21.5 | 18.1 | 11.1 | 8.0 | 16.4 | 46.9 | … | 44.5 |
| 38b | SBd | 0.029 | 15.4 | 18.8 | 14.7 | 12.3 | 8.5 | 16.3 | 27.6 | 8.3 | 45.2 |
| 38c | Im | 0.029 | 9.2 | 11.1 | 8.4 | 6.5 | 4.4 | 8.4 | 24.2 | 5.6 | 67.8 |
| 38d | SBa | 0.029 | 6.7 | 7.8 | 6.6 | 3.4 | 2.5 | 1.2 | 1.4 | … | 0.4 |
| 40a | E3 | 0.022 | 79.4 | 78.7 | 74.2 | 45.4 | 28.0 | 20.2 | 15.3 | … | 4.0 |
| 40b | S0 | 0.023 | 35.1 | 33.3 | 31.1 | 18.7 | 12.2 | 8.9 | 8.8 | … | 3.0 |
| 40c | Sbc | 0.021 | 37.3 | 43.1 | 45.7 | 29.4 | 19.7 | 34.7 | 83.5 | … | 73.4 |
| 40d | SBa | 0.022 | 31.7 | 32.0 | 30.7 | 21.3 | 14.3 | 22.7 | 66.9 | … | 88.1 |
| 40e | Sc | 0.022 | 8.8 | 8.7 | 8.5 | 6.4 | 4.1 | 4.0 | 5.9 | … | 5.6 |
| 40f | E1 | 0.021 | 5.9 | 4.4 | 3.0 | 1.4 | 1.0 | 0.9 | 0.8 | … | … |
| 47a | Sbc | 0.032 | 26.8 | 35.0 | 28.0 | 20.7 | 13.3 | 20.3 | 52.3 | 22.1 | 87.0 |
| 47b | E3 | 0.032 | 16.0 | 21.4 | 16.9 | 11.8 | 7.2 | 4.1 | 2.4 | … | 0.6 |
| 47c | Sc | 0.032 | 4.5 | 5.9 | 4.5 | 3.0 | 1.9 | 2.3 | 2.4 | … | 9.9 |
| 47d | Sd | 0.032 | 5.7 | 7.1 | 5.9 | 3.6 | 2.4 | 2.3 | 6.4 | … | 4.5 |
| 54a | Sdm | 0.005 | 10.2 | 8.6 | 6.0 | 6.7 | 5.3 | 6.8 | 10.3 | … | 4.4 |
| 54b | Im | 0.005 | 5.6 | 5.6 | 4.4 | 3.7 | 2.9 | 5.5 | 11.1 | … | 22.7 |
| 54c | Im | 0.005 | 1.3 | 1.1 | 1.4 | 2.3 | 1.5 | 2.1 | 4.1 | … | 2.8 |
| 54d | Im | 0.006 | 0.5 | 0.7 | 0.6 | 0.5 | 0.4 | 0.3 | 0.7 | … | 0.7 |
| 55a | E0 | 0.054 | 14.4 | 17.2 | 16.6 | 6.5 | 3.9 | 2.7 | 1.2 | … | 0.6 |
| 55b | S0 | 0.052 | 7.3 | 7.4 | 7.3 | 3.4 | 2.2 | 1.3 | 0.7 | … | 0.3 |
| 55c | E3 | 0.052 | 7.7 | 10.8 | 11.6 | 5.5 | 3.8 | 3.9 | 10.9 | … | 7.7 |
| 55d | E2 | 0.054 | 4.3 | 4.9 | 4.8 | 2.1 | 1.4 | 0.9 | 0.7 | … | 0.6 |
| 55e | Sc | 0.054 | 1.2 | 2.2 | 2.2 | 1.8 | 1.3 | 0.9 | 4.0 | … | 6.3 |
| 56a | Sc | 0.027 | 15.7 | 25.0 | 13.5 | 6.8 | 4.4 | 6.1 | 13.0 | 3.9 | 13.4 |
| 56b | SB0 | 0.026 | 35.0 | 52.9 | 29.5 | 25.9 | 30.4 | 39.0 | 53.7 | 49.8 | 185 |
| 56c | S0 | 0.027 | 18.8 | 24.8 | 15.0 | 7.7 | 3.3 | 3.8 | 3.2 | … | 0.9 |
| 56d | S0 | 0.028 | 9.3 | 13.8 | 7.8 | 4.7 | 3.1 | 5.9 | 14.8 | 5.4 | 20.2 |
| 56e | S0 | 0.027 | 5.7 | 7.2 | 4.4 | 2.0 | 1.4 | 2.1 | 4.2 | 1.8 | 6.6 |
| 57a | Sbc | 0.029 | 56.7 | 62.2 | 67.9 | 33.8 | 18.5 | 15.0 | 18.1 | 12.5 | 13.8 |
| 57b | SBb | 0.030 | 26.7 | 26.8 | 27.2 | 14.1 | 8.9 | 6.8 | 10.0 | … | 8.1 |
| 57c | E3 | 0.030 | 22.1 | 23.0 | 23.7 | 12.8 | 8.7 | 4.2 | 2.7 | 1.4 | 0.4 |
| 57d | SBc | 0.030 | 13.1 | 13.4 | 14.1 | 7.6 | 4.9 | 7.4 | 18.1 | 6.6 | 24.0 |
| 57e | S0a | 0.030 | 20.1 | 20.8 | 21.4 | 9.5 | 6.1 | 3.8 | 4.1 | … | 2.1 |
| 57f | E4 | 0.031 | 13.7 | 13.6 | 14.3 | 6.7 | 4.3 | 1.5 | 1.0 | … | 0.9 |
| 57g | SB0 | 0.032 | 11.7 | 11.8 | 12.0 | 5.4 | 3.3 | 1.5 | 0.7 | … | … |
| 57h | SBb | 0.031 | 3.8 | 3.9 | 3.9 | 1.8 | 1.2 | 0.8 | 1.9 | … | 2.5 |
| HCG | Type | z | J | H | Ks | m | m | m | m | m | m |
|---|---|---|---|---|---|---|---|---|---|---|---|
| (ID) | (mJy) | (mJy) | (mJy) | (mJy) | (mJy) | (mJy) | (mJy) | (mJy) | (mJy) | ||
| 71a | Sbc | 0.031 | 29.9 | 36.5 | 22.6 | 17.4 | 11.3 | 16.5 | 32.6 | 24.0 | 29.2 |
| 71b | SB0 | 0.032 | 17.3 | 21.2 | 14.1 | 8.5 | 5.8 | 10.6 | 9.1 | 9.3 | 52.7 |
| 71c | Sbc | 0.029 | 3.5 | 4.4 | 2.8 | 2.0 | 1.2 | 2.1 | 5.2 | … | 4.3 |
| 71d | SB0 | 0.031 | 6.3 | 7.7 | 5.1 | 3.2 | 2.1 | 1.2 | 1.1 | … | 2.5 |
| 79a | Sa | 0.015 | 33.5 | 36.0 | 27.4 | 23.7 | 15.2 | 18.8 | 30.9 | 11.9 | 23.3 |
| 79b | S0 | 0.015 | 37.3 | 40.3 | 30.9 | 17.6 | 14.6 | 15.8 | 12.2 | 6.6 | 33.7 |
| 79c | S0 | 0.014 | 12.6 | 12.7 | 9.1 | 10.2 | 5.7 | 4.0 | 2.0 | … | 1.2 |
| 79d | Sdm | 0.015 | 4.3 | 3.2 | 3.2 | 2.2 | 1.2 | 1.5 | 3.5 | … | 5.2 |
| 79e | Scd | 0.015 | 5.7 | 6.1 | 5.3 | 4.3 | 3.3 | 4.0 | 17.5 | 5.8 | 0.5 |
| 95a | Sbc | 0.040 | 30.5 | 33.5 | 28.6 | 18.0 | 11.0 | 6.7 | 7.8 | … | 1.3 |
| 95b | SB0 | 0.039 | 11.9 | 13.0 | 13.3 | 9.2 | 6.4 | 14.1 | 30.4 | 23.1 | 41.2 |
| 95c | Sbc | 0.039 | 10.4 | 11.1 | 9.7 | 7.1 | 4.3 | 4.9 | 10.6 | 13.6 | 19.8 |
| 95d | SB0 | 0.041 | 7.7 | 8.5 | 9.4 | 4.8 | 3.1 | 2.6 | 6.7 | 4.7 | 5.6 |
| HCG | log(M) | log(LIR) | SFR | sSFR |
|---|---|---|---|---|
| (ID) | M⊙ | L⊙ | M⊙ yr-1 | yr-1 |
| 19a | 10.57 | … | … | … |
| 19b | 9.99 | 9.38 | 0.24 | 2.54 |
| 19c | 9.46 | 8.84 | 0.08 | 2.75 |
| 26a | 10.91 | 10.34 | 1.28 | 0.92 |
| 26b | 10.81 | 9.65 | 0.44 | 0.68 |
| 26c | 10.45 | … | … | … |
| 26d | 10.12 | 8.73 | 0.08 | 0.40 |
| 26e | 9.83 | 9.46 | 0.23 | 3.34 |
| 26f | 9.12 | 8.49 | 0.02 | 0.85 |
| 26g | 9.87 | … | … | … |
| 33a | 11.13 | … | … | … |
| 33b | 11.15 | … | … | … |
| 33c | 10.93 | 10.18 | 1.21 | 1.79 |
| 33d | 10.59 | … | … | … |
| 37a | 11.32 | … | … | … |
| 37b | 11.10 | 9.91 | 0.81 | 0.65 |
| 37c | 10.55 | 9.23 | 0.12 | 0.33 |
| 37d | 9.88 | 9.09 | 0.12 | 1.52 |
| 37e | 10.13 | 8.60 | 0.05 | 0.38 |
| 38a | 10.96 | 10.42 | 1.55 | 1.73 |
| 38b | 10.87 | 10.21 | 1.57 | 2.17 |
| 38c | 10.63 | 10.37 | 2.25 | 5.40 |
| 38d | 10.55 | … | … | … |
| 40a | 11.33 | … | … | … |
| 40b | 10.99 | … | … | … |
| 40c | 11.08 | 10.34 | 1.35 | 1.15 |
| 40d | 10.95 | 10.41 | 1.78 | 2.00 |
| 40e | 10.39 | 9.25 | 0.16 | 0.63 |
| 40f | 9.89 | … | … | … |
| 47a | 11.21 | 10.59 | 3.19 | 2.00 |
| 47b | 11.02 | … | … | … |
| 47c | 10.45 | 9.72 | 0.51 | 1.81 |
| 47d | 10.57 | 9.49 | 0.26 | 0.68 |
| 54a | 9.09 | 7.97 | 0.01 | 1.02 |
| 54b | 8.79 | 8.46 | 0.04 | 5.99 |
| 54c | 8.33 | 7.81 | 0.01 | 3.49 |
| 54d | 8.09 | 7.37 | 0.002 | 1.91 |
| 55a | 11.37 | 8.92 | 0.12 | 0.04 |
| 55b | 11.10 | 8.59 | 0.06 | 0.04 |
| 55c | 11.30 | 10.18 | 1.05 | 0.50 |
| 55d | 10.95 | 8.99 | 0.12 | 0.12 |
| 55e | 10.64 | 10.02 | 0.91 | 2.18 |
| 56a | 10.77 | 9.68 | 0.48 | 0.82 |
| 56b | 11.08 | 10.71 | 4.44 | 3.85 |
| 56c | 10.82 | … | … | … |
| 56d | 10.56 | 9.86 | 0.73 | 2.02 |
| 56e | 10.28 | 9.18 | 0.26 | 1.35 |
| 57a | 11.54 | 9.99 | 0.58 | 0.16 |
| 57b | 11.14 | 9.69 | 0.39 | 0.26 |
| 57c | 11.11 | … | … | … |
| 57d | 10.88 | 9.96 | 0.97 | 1.28 |
| 57e | 11.07 | 9.17 | 0.11 | 0.10 |
| 57f | 10.92 | … | … | … |
| 57g | 10.87 | … | … | … |
| 57h | 10.36 | 9.22 | 0.15 | 0.62 |
| HCG | log(Mass) | log(LIR) | SFR | sSFR |
|---|---|---|---|---|
| (ID) | M⊙ | L⊙ | M⊙ yr-1 | yr-1 |
| 71a | 11.11 | 10.10 | 1.25 | 0.94 |
| 71b | 10.93 | 10.34 | 2.11 | 2.53 |
| 71c | 10.16 | 9.39 | 0.21 | 1.42 |
| 71d | 10.49 | … | … | … |
| 79a | 10.56 | 9.44 | 0.27 | 0.75 |
| 79b | 10.61 | 9.36 | 0.38 | 0.93 |
| 79c | 10.07 | … | … | … |
| 79d | 9.62 | 8.79 | 0.07 | 1.71 |
| 79e | 9.87 | 9.37 | 0.21 | 2.65 |
| 95a | 11.44 | … | … | … |
| 95b | 11.09 | 10.49 | 2.60 | 2.06 |
| 95c | 10.95 | 10.12 | 1.32 | 1.48 |
| 95d | 10.99 | 9.70 | 0.48 | 0.50 |
| HCG | IRAS m | IRAS m | ||
|---|---|---|---|---|
| group | Observed | Predicted | Observed | Predicted |
| mJy | mJy | mJy | mJy | |
| 19 | 300 | 246.8 | 1110 | 673 |
| 26 | 540 | 450.6 | 1496 | 976 |
| 33 | 339.6 | 752 | ||
| 37 | 449.5 | 665 | ||
| 38 | 1439 | 2076 | ||
| 40 | 1478 | 3850 | 3686 | |
| 47 | 880.9 | 1336 | ||
| 54 | 300 | 278.2 | 710 | 675 |
| 55 | 200 | 139.4 | 1630 | 322 |
| 56 | 1860 | 2637 | ||
| 57 | 437.5 | 917 | ||
| 71 | 1640 | 736.9 | 1069 | |
| 79 | 584.4 | 1137 | ||
| 95 | 941 | 616.2 | 2390 | 898 |
Appendix A Infrared morphology
In this section we briefly describe the overall appearance of groups in the Spitzer mid-IR images. A detailed analysis of the mid-IR and near-IR color profiles of the galaxies will be the subject of a future paper.
-
•
HCG19: Galaxy a is faint in the mid-IR displaying only a luminous core at m. Member b is very bright in all mid-IR bands, and its spiral arms are clearly visible at 5.8, and 8m, likely due to associated PAH emission. Finally, galaxy c has faint extended emission in all bands.
-
•
HCG26: This is a very dense group. Members a, b, d, and g are merging with a and e the brightest. There is also a feature similar to a tidal tail over galaxy g which is visible in the optical images but not in the mid-IR.
-
•
HCG33: Galaxies a, b, and d are early-type and so are very faint in the mid-IR; however, galaxy c is classified as type Sdm and is very bright in all Spitzer bands.
-
•
HCG37: Member a displays a very bright extended halo in the first IRAC band, but it is not so bright in the other bands. Member b presents strong nuclear emission at 8 and 24 m. Member d is also bright in these wavelengths. Finally, member c has an IR-bright nucleus, and it is spectroscopically classified as a low-luminosity AGN.
-
•
HCG38: Galaxies b and c form an interacting pair both displaying very luminous extended tails with bright spots, possibly because of giant HII regions. Galaxy a is also luminous in the mid-IR.
-
•
HCG40: There is a m extended halo around the group. Galaxies c and d are very bright, especially at 24m. We can also clearly see the spiral arms of member e, as well as nuclear emission in a and b.
-
•
HCG47: Galaxy a has a very bright nucleus and spiral arms while a mid-IR luminous bridge connects it to member b, which only has faint emission away from its nucleus. Galaxy c is also bright. Finally, member d is also rather faint in the mid-IR emission.
-
•
HCG54: Member b is a very bright galaxy, in particular at m. Member a appears to have two cores. One is bright at m and the other is so the 5.6 and 8m bands.
-
•
HCG55: An extended halo at m, is seen around the group. Galaxies c and e are most luminous especially at 24m.
-
•
HCG56: Member b is the brightest galaxy of this group and one of the brightest of our sample. Galaxies a, d, and e are mid-IR luminous, while c has a bright nucleus visible only in the four IRAC bands. Finally, there is a bridge between members b and c seen only in m, suggesting that it contains mostly stars.
-
•
HCG57: Galaxies a and d have very luminous spirals, also presenting some mid-IR bright spots. They also seem to have a common halo at m . Member b also has bright spiral arms with two bright spots on them seen at m. The latter coincide with the location of two identified supernovae (SN-2002AR and SN-2005BA).
-
•
HCG71: Member a has a bright nucleus and very extended luminous spiral arms. The nucleus of galaxy b is bright, and c is also mid-IR bright.
-
•
HCG79: There is an extended halo around the group seen in the m band. Galaxies a, b, d, and e are very luminous in mid-IR. There are also a tidal tail in member b and an extended feature over galaxy c. Finally, it seems that there is a bridge between a and d.
-
•
HCG95: There is a bridge connecting galaxies a and c, observed in all wavelengths with bright spots on it. Members c and d are mid-IR bright. Galaxy a only has a luminous nucleus, while the spiral arms of galaxy d are seen in the IRAC images .
As seen from the above descriptions, the mid-IR morphology of the galaxies in the compact groups displays clear evidence of tidal interactions and shows the effects of the dynamically induced star formation activity in them.