Composite fermion valley polarization energies: Evidence for particle-hole asymmetry
Abstract
In an ideal two-component two-dimensional electron system, particle-hole symmetry dictates that the fractional quantum Hall states around are equivalent to those around . We demonstrate that composite fermions (CFs) around in AlAs possess a valley degree of freedom like their counterparts around . However, focusing on and 4/3, we find that the energy needed to completely valley polarize the CFs around is considerably smaller than the corresponding value for CFs around thus betraying a particle-hole symmetry breaking.
In the case of two-dimensional electron systems (2DESs) with no discrete degrees of freedom such as spin or valley, the principle of particle-hole symmetry dictates that the fractional quantum Hall (FQH) state formed at a Landau level (LL) filling factor of is equivalent to the state formed at (). In the presence of a discrete degree of freedom (e.g. spin in the case of GaAs 2DES), the symmetry relates the states at and (). Although the principle of particle-hole symmetry is theoretically sound, its applicability in real experimental systems is not well studied footnote1 . Spin-polarization studies in GaAs have hinted towards differences between FQH states formed around = 1/2 and engelPRB92 ; duPRL95 ; duPRB97 ; kukushkinPRL99 ; sternPRB04 . However, while comparing experimental results to theoretical calculations, it is commonly assumed that particle-hole symmetry holds duPRL95 ; parkPRL98 .
In this paper, we provide detailed and quantitative experimental evidence proving that particle-hole symmetry is violated in 2DESs. The quantity we study is the valley-polarization energy of composite fermions (CFs) in AlAs 2DESs, where electrons occupy two conduction band minima (valleys). The occupation of these valleys can be controlled via the application of in-plane strain. Here, we demonstrate that, similar to their counterparts around = 3/2, CFs around also have their own valley degree of freedom. We valley polarize these CFs by applying an in-plane uniaxial strain. The energies required to completely valley polarize the CFs around and 3/2, normalized to the Coulomb energy, should be identical if particle-hole symmetry prevailed. Surprisingly, we find that it takes much less energy to completely valley polarize the CFs around compared to the CFs around 3/2. In particular, we investigate the valley polarization of FQH states at and 4/3 in a wide range of 2D electron densities (), and conclude that particle-hole symmetry is violated in our system.
Our sample is a 12 nm-wide AlAs quantum well, grown by molecular beam epitaxy on a semi-insulating (001) GaAs substrate and modulation doped with Si shayeganPhysicaB06 . We defined a Hall bar along the [110] crystal direction with standard photolithography and made GeAuNi contacts. We also deposited metallic front and back gates, which allowed us to control . Here we report data from three separate cooldowns. We made measurements in a 20 mK base temperature dilution refrigerator and a 300 mK 3He system using standard lock-in techniques.
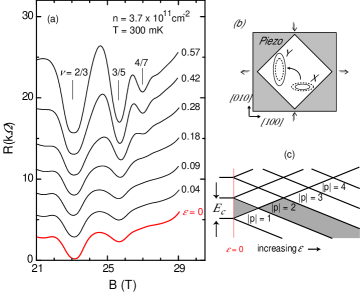
The 2D electrons in our samples occupy two conduction band valleys with elliptical Fermi contours shayeganPhysicaB06 . We can controllably lift the valley degeneracy by applying uniaxial strain in the plane of the sample. Experimentally, we achieve this by gluing the sample to a piezoelectric (piezo) stack which expands in one direction (and contracts in the perpendicular direction) when an external voltage is applied. A schematic is shown in Fig. 1(b). The single-particle energy splitting between the two in-plane valleys is given by ; where and are the strains along the [100] and [010] crystal directions shayeganPhysicaB06 and is the deformation potential, which has a band value of 5.8 eV in AlAs. In our system, for the density range under study, the Zeeman energy () of the electrons is comparable to their cyclotron energy shayeganPhysicaB06 . Since the FQH states around and 3/2 are formed in the lowest LLs of the two occupied valleys, the spin degree of freedom does not play a role in the results reported below.
In Fig. 1(a), we show longitudinal resistance () vs. perpendicular magnetic field () traces around taken at different values of for a fixed density. At high values of , when the CF system is effectively single-valley, FQH states up to are clearly visible. As we approach the condition of , the FQH states become weak. At first glance, this is very different from the behavior reported for states around bishopPRL07 ; padmanabhanPRB09 . In the case, the resistance minima at various fillings get weaker and stronger as a function of , a behavior which finds a ready explanation in terms of the LL energy fan diagram for the CFs (Fig. 1(c)) bishopPRL07 ; padmanabhanPRB09 . Note that within the framework of the CF theory jainPRL89 ; halperinPRB93 , FQHE of electrons is understood as the integer QHE of CFs. Every electronic fractional filling factor has a CF integer counterpart , related by CFbook .
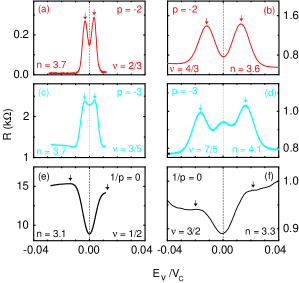
We now present data where fixed the value of and obtained piezoresistance traces. In Fig. 2 we compare the response of the system to at and around and . The x-axis is the valley splitting energy () expressed in terms of the Coulomb energy, where is the dielectric constant of AlAs and is the magnetic length. The data are taken at comparable values of , meaning a variation by a factor of about three in . The normalization of the x-axis ensures that the variation in the values of does not affect the energy scales since all relevant energies are expected to scale with .
Figures 2(a) and 2(b) show the piezoresistance traces taken at and 4/3 respectively. Both these filling factors correspond to of CFs and are therefore expected to behave similarly. According to the fan diagram in Fig. 1(c), the energy gap () at () is finite at . As is increased, the CF LLs undergo an energetic coincidence which results in a vanishing value of . Beyond this coincidence, the system is completely valley polarized. The energy at which the coincidence occurs is thus the valley polarization energy, . Upon further increasing the strain, the gap increases, finally saturating at a value equal to the cyclotron energy () of the CFs. This variation in as a function of affects the value of at . At any given temperature (), a small value of gap corresponds to a high value of and . Hence, as a function of , the resistance at is expected to oscillate, following the fan diagram in Fig. 1(c). The piezoresistance trace taken at (Fig. 2(b)) is consistent with this observation. The trace at (Fig. 2(a)) qualitatively follows the same trend, although there is a major quantitative difference. The two peaks signifying on either side of are much closer to each other compared to . We conclude that the value of for is considerably smaller than for .
Data for other FQH states around and 1/2 lead to a similar conclusion. For example, in Figs. 2(c) and (d), we show traces taken at and 7/5 respectively. Although the () trace appears to follow the fan diagram in Fig. 1(c) quite well, does not. We believe the value of for is so small that, given the finite width of the piezoresistance peaks, the central peak is not resolved.
Piezoresistance traces taken at and 3/2, presented in Figs. 2(e) and 2(f), show qualitatively similar features. The resistance in both cases exhibits a minimum when the two valleys are balanced, increases as the valley degeneracy is broken, and saturates once the CFs are fully valley polarized. The arrows in Figs. 2(e) and 2(f) denote the upper limits of the estimated valley polarization energies padmanabhanPRB09 . Note that the separation between the arrows is smaller for the case of compared to . In general, the values of for CFs around are so small that the response of the system to is contained in a very narrow range of . This is why to the first order, all fractions around appear to become weak near (Fig. 1(a)).
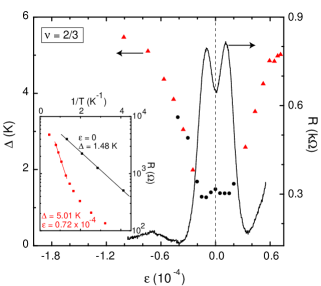
To further contrast the valley polarization energies for the FQH states around and 3/2, we present data taken at in greater detail and compare them to . Figure 3 shows a piezoresistance trace at along with energy gap measurements. Note that the small dip in the piezoresistance at corresponds to the small increase in the gap footnote2 . Also the piezoresistance maxima correspond to the minima in the gap, which lends support to our determination of the polarization strain from the piezoresistance measurement. The gap measurements were done in two different cooldowns because of the difference in the optimum temperature ranges needed. The Arrhenius plots for two extreme values of are shown in the inset to Fig. 3.
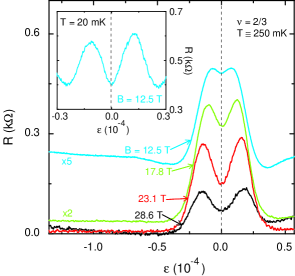
In Fig. 4 we show the evolution of the piezoresistance as a function of . The data shown in the main panel were taken at mK. Note that, as the value of decreases, the peaks get closer to each other and almost merge into one at the lowest density of cm-2 ( at = 12.5 T). However, for the same , the resolution between the peaks is considerably improved when temperature is lowered as shown in the inset. We note that at higher values of , the high temperature is necessary for the observation of the peaks because, at low values of , the resistance minimum at is too strong and flat to show any features as a function of . At intermediate values of , where peaks are observable at both high and low temperatures we observe no dependence of the peak positions on , suggesting that is a -independent quantity.
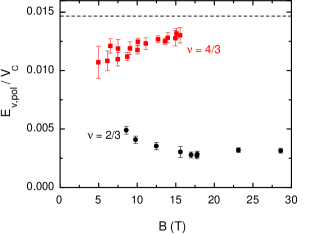
In Fig. 5, we summarize our main results by comparing the valley polarization energies for and 4/3. The data points obtained from Fig. 4 are shown for , and the data are obtained from similar measurements, including those reported in Ref. padmanabhanPRB09 . Consistent with Ref. padmanabhanPRB09 , we find a slight decrease in the value of with decreasing for the case of . however, shows a slight increase with decreasing . The main observation in this figure is the glaring discrepancy between the values of for and 4/3 thus implying a breaking of the particle-hole symmetry. Note that comparison between the two fractions is done at the same values of , thereby eliminating the influence of -dependent parameters such as CF effective mass.
In the past, there have been measurements of polarization energies of CFs in (single-valley) GaAs 2DESs around both and 1/2 using a variety of techniques. Most of these studies, however, focus on fractions around either or . The reported values for (the CF -polarization energy normalized to ) for range from 0.009 engelPRB92 ; kukushkinPRL99 to 0.018 sternPRB04 while the values for lie between 0.019 kukushkinPRL99 and 0.022 duPRB97 . Optical studies in Ref. kukushkinPRL99 indicate the spin-polarization energies for both and 4/3 as 0.009 and 0.019 (measured at 2.5 T and 11 T respectively). A compilation of these results suggest that the spin-polarization energies for are on the average higher than for in spin-systems also. The importance of particle-hole symmetry breaking, however, was not discussed by any of the above studies.
Although higher values of polarization energy for (compared to 2/3) are observed in spin systems also, the difference is much more pronounced in our two-valley system (a factor of 4.3 for T). This is possibly because of LL mixing. It is known that LL mixing, parameterized by the ratio of Coulomb to the cyclotron energy () of electrons, breaks particle hole-symmetry macdonaldPRB84 . In AlAs 2DES, LL mixing is especially significant due to the large band mass ( compared to for GaAs; is the free electron mass). For example, at a field of T, the values of and for AlAs are 252 K and 44 K, respectively. For the same , the corresponding values for GaAs are 194 K and 300 K. It is clear that AlAs is more prone to the effects of LL mixing. Another unique feature of the AlAs 2DES is the anisotropy of the Fermi contours at , the consequences of which are unknown.
In Ref. parkPRL98 a theory was developed for the spin-polarization energy of single-valley, two-spin systems. The theory makes no distinction between the FQH states at and and predicts a polarization energy of 0.0146 (based on the polarization mass model parkPRL98 ; padmanabhanPRB09 ). This value is shown in Fig. 5 as the dashed line. Our experimental results for polarization energies for and 4/3 are both lower than this value, with 4/3 showing a better agreement. The valley polarization energies are also overall smaller than their experimentally measured spin counterparts (in GaAs 2DESs), which show an overall better agreement with the theoretical estimate. The relatively better agreement between measured spin polarization energies and the theory is consistent with the LL mixing being much smaller in GaAs systems. Anisotropic electron-electron interaction, a result of elliptical Fermi contours in AlAs 2DESs, might also bring about a difference between the spin and valley degrees of freedom.
Independent of the theoretical understanding, we emphasize that the data presented here highlight the breaking of the particle-hole symmetry in our AlAs 2DES. Influence of LL mixing and Fermi contour anisotropy needs to be studied further for a quantitative understanding of this phenomenon.
We thank the NSF and DOE for financial support, and J.K. Jain for illuminating discussions. A portion of this work was performed at the National High Magnetic Field Laboratory, which is supported by NSF Cooperative Agreement No. DMR-0654118, by the State of Florida, and by the DOE. We thank G. Jones, S. A. Maier, T. Murphy, E. Palm and J.H. Park for assistance.
References
- (1) There is one very recent experimental study involving bi-layer tunneling spectroscopy, where a difference in the spectra taken at and 3/2 is reported as evidence for particle-hole asymmetry [J.P. Eisenstein, L.N. Pfeiffer and K.W. West, Sol. Stat. Commun. 149, 1867 (2009)].
- (2) L.W. Engel, S.W. Hwang, T. Sajoto, D.C. Tsui, and M. Shayegan, Phys. Rev. B 45, 3418 (1992).
- (3) R.R. Du, A.S. Yeh, H.L. Stormer, D.C. Tsui, L.N. Pfeiffer and K.W. West, Phys. Rev. Lett. 75, 3926 (1995).
- (4) R.R. Du, A.S. Yeh, H.L. Stormer, D.C. Tsui, L.N. Pfeiffer and K.W. West, Phys. Rev. B 55, R7351 (1997).
- (5) I.V. Kukushkin, K.v. Klitzing, and K. Eberl, Phys. Rev. Lett. 82, 3665 (1999).
- (6) O. Stern, N. Freytag, A. Fay, W. Dietsche, J.H. Smet, K. von Klitzing, D. Schuh, and W. Wegscheider, Phys. Rev. B 70, 075318 (2004).
- (7) K. Park and J.K. Jain, Phys. Rev. Lett. 80, 4237 (1998).
- (8) M. Shayegan, E.P. De Poortere, O. Gunawan, Y.P. Shkolnikov, E. Tutuc, and K. Vakili, Phys. Status Solidi B 243, 3629 (2006).
- (9) N.C. Bishop, M. Padmanabhan, K. Vakili, Y.P. Shkolnikov, E.P. De Poortere and M. Shayegan, Phys. Rev. Lett. 98, 266404 (2007).
- (10) M. Padmanabhan, T. Gokmen and M. Shayegan, Phys. Rev. B 80, 035423 (2009).
- (11) J.K. Jain, Phys. Rev. Lett. 63, 199 (1989).
- (12) B.I. Halperin, P. A. Lee and N. Read, Phys. Rev. B 47, 7312 (1993).
- (13) Composite Fermions, Jainendra K. Jain, Cambridge University Press, New York, 2007.
- (14) Ideally we expect the gap at to be equal to the gap at extreme values of . The much smaller value of the gap observed at is likely linked to the proximity of the two finite-width peaks in the piezoresistance trace.
- (15) A. H. MacDonald, Phys. Rev. B 30, 4392 (1984).