A Measurement of the Rate of Type Ia Supernovae in Galaxy Clusters from the SDSS-II Supernova Survey
Abstract
We present measurements of the Type Ia supernova (SN) rate in galaxy clusters based on data from the Sloan Digital Sky Survey-II (SDSS-II) Supernova Survey. The cluster SN Ia rate is determined from 9 SN events in a set of 71 C4 clusters at and 27 SN events in 492 maxBCG clusters at . We find values for the cluster SN Ia rate of and () in C4 and maxBCG clusters, respectively, where the quoted errors are statistical and systematic, respectively. The SN rate for early-type galaxies is found to be and in C4 and maxBCG clusters, respectively. The SN rate for the brightest cluster galaxies (BCG) is found to be and in C4 and maxBCG clusters, respectively. The ratio of the SN Ia rate in cluster early-type galaxies to that of the SN Ia rate in field early-type galaxies is and , for C4 and maxBCG clusters, respectively. The SN rate in galaxy clusters as a function of redshift, which probes the late time SN Ia delay distribution, shows only weak dependence on redshift. Combining our current measurements with previous measurements, we fit the cluster SN Ia rate data to a linear function of redshift, and find . A comparison of the radial distribution of SNe in cluster to field early-type galaxies shows possible evidence for an enhancement of the SN rate in the cores of cluster early-type galaxies. With an observation of at most 3 hostless, intra-cluster SNe Ia, we estimate the fraction of cluster SNe that are hostless to be .
1 Introduction
The rate of Type Ia supernovae (SNe) in galaxy clusters is an important field of study for a number of reasons. As discussed in, e. g., Greggio (2005), supernova (SN) rate measurements are an observational probe of the progenitor systems, with the connection to progenitor models being made through inference of the distribution of delay times (DDTs) with respect to star formation. As galaxy clusters are generally composed of a high fraction of early-type galaxies that have old stellar populations, measurements of the SN Ia rate in clusters can in principle simplify the inference of the SN DDT. SNe in galaxy clusters are also a candidate source for metal enrichment of the intra-cluster medium (ICM). In particular, improved measurement of the rate of intra-cluster SNe would be significant for constraining the relative importance of sources that may contribute to the cluster ICM enrichment (e. g. intra-cluster stars vs. galaxy outflow).
The existing measurements of the cluster SN rate are few and are generally based on low-number statistics. Estimates of the SN cluster rate were first presented by Crane et al. (1977) and Barbon (1978), who considered SNe discovered in the Coma cluster. The cluster SN rate was measured by Gal-Yam et al. (2002) in clusters at and . The Gal-Yam et al. (2002) results are based on a search for SNe in archival images of the Hubble Space Telescope (HST) and utilize one and two SNe, respectively. Subsequent to the HST SN search, a dedicated search for SNe in 161 Abell clusters was undertaken by The Wise Observatory Optical Transient Search (WOOTS) (Gal-Yam et al., 2008). A total of 6 SNe Ia discovered by the WOOTS were used to determine the cluster SN Ia rate at by Sharon et al. (2007b). A sample of 2-3 SNe Ia from the Supernova Legacy Survey (SNLS) have been used to determine the cluster SN Ia rate at by Graham et al. (2008). Finally, the sample of SNe in the local () universe presented by Cappellaro et al. (1999) have been reanalyzed by Mannucci et al. (2008) to determine the cluster SN Ia rate with a sample of 12.5 SN Ia (a fractional SN reflects uncertainty in typing; see Cappellaro et al. (1999)). Additionally, Mannucci et al. (2008) have placed the first constraints on the core-collapse (CC) SN rate in galaxy clusters based on a sample of 7.5 CC SNe. A summary of the SN Ia rate results from the above cluster SN studies is given in Table 1. A SN search in 15 massive, high-redshift (), X-ray selected clusters has been carried out on the HST, as described in Sharon et al. (2007a), and a measurement of the SN Ia rate based on 6-14 SNe discovered by the program is forthcoming (Sharon et al., 2009). A dedicated SN search, targeting X-ray selected clusters in the redshift range , is also being carried out on the Bok 2. 3m telescope on Kitt Peak (Sand et al., 2008)
As can be seen in Table 1, the knowledge of the cluster SN Ia rate comprises 5 measurements, based on a total of SNe. In this paper, we describe new measurements of the cluster SN Ia rate based on data from the Sloan Digital Sky Survey-II (SDSS-II) Supernova Survey (Frieman et al., 2008). The measurements are based on 35 SNe in the redshift range , and therefore represent a significant statistical contribution to cluster SN Ia studies. In §2 we briefly describe the observations and SN search strategy of the SDSS-II Supernova Survey. In §3 we describe the galaxy cluster catalogs employed in this SN rate analysis. In §4 we describe selection of the cluster SN sample from the SDSS-II Supernova Survey data. In §5 we describe necessary corrections to our SN Ia rate measurements. In §7 we present results on the cluster SN Ia rate, as well as limits on the cluster CC SN rate, and studies of the distribution of SNe with respect to their host galaxies. We summarize in §8. Whenever necessary we assume a flat cosmology with , and Hubble constant .
| Reference | Redshift | Mean | Lookback Time | SN Ia Rate aa For this work, the quoted errors are statistical and systematic, respectively. For previous measurements, the total error is quoted; see the corresponding references. | |
|---|---|---|---|---|---|
| Range | Redshift | [Gyr] | [SNuB ] | ||
| This work (C4) | 0.03 - 0.17 | 0.084 | 1.11 | 9 | |
| This work (maxBCG) | 0.10 - 0.30 | 0.225 | 2.69 | 25 | |
| Mannucci et al. (2008) | 0 - 0.04 | 0.020 | 0.28 | 12.5 | |
| Sharon et al. (2007b) | 0.06 - 0.19 | 0.150 | 1.89 | 6 | |
| Gal-Yam et al. (2002) | 0.250 | 2.94 | 1 | ||
| Graham et al. (2008) | 0.450 | 4.67 | 3 | ||
| Gal-Yam et al. (2002) | 0.900 | 7.30 | 2 |
2 SDSS-II Supernova Survey Observations
Here we briefly describe aspects of the SDSS-II Supernova Survey most relevant to the present SN rate analysis. Much of the material presented in this section is also relevant to the SN rate studies described in Dilday et al. (2010), and is discussed therein; we repeat the discussion here for the convenience of the reader. The survey is described in more detail in Frieman et al. (2008) and the SN detection algorithms are described in Sako et al. (2008). Additional details of the survey observations and the use of in situ artificial SNe for determining SN detection efficiencies are discussed in Dilday et al. (2008). A technical summary of the SDSS is given by York et al. (2000). Details of the survey calibration can be found in Hogg et al. (2001); Smith et al. (2002); Tucker et al. (2006), the data processing and quality assessment is described by Ivezić et al. (2004), and the photometric pipeline is described by Lupton et al. (1999)
The SDSS-II Supernova Survey was carried out during the Fall (September-November) of 2005-2007, using the 2.5m telescope (Gunn et al., 2006) at Apache Point Observatory (APO). Observations were obtained in the SDSS filters (Fukugita et al., 1996) with a wide-field CCD camera (Gunn et al., 1998), operating in time-delay-and-integrate (TDI, or drift scan) mode. The region of the sky covered by the SDSS-II Supernova Survey (designated stripe 82; see Stoughton et al. (2002)) was bounded by , and . On average any given part of this square degree area was imaged once every 4 days during the survey operations.
Difference images were produced in the SDSS filter bands by subtracting template images, constructed from previous observation of the survey region, from the survey images, using an implementation of the methods described by Alard & Lupton (1998). The difference images were searched for positive fluctuations using the DoPHOT photometry and object detection package (Schechter et al., 1993); typical limiting magnitudes ( above background) for the SDSS-II Supernova Survey were , , and . A combination of software cuts and human visual inspection was then used to identify promising SN candidates from the full set of transient detections. As a key component of prioritizing SN candidates for spectroscopic observation, the light curves for SN candidates were fit to models of Type Ia, Type Ib/c and Type II SNe. This procedure is referred to as photometric-typing, and is described in detail by Sako et al. (2008).
Spectroscopic observations, for both SN type and redshift determination, were provided by a number of different telescopes. The spectra for the SNe utilized in the present SN rate analysis were provided by the Hobby-Eberly 9.2m at McDonald Observatory, the Astrophysical Research Consortium 3.5m at Apache Point Observatory, the William-Herschel 4.2m, the Hiltner 2.4m at the MDM Observatory, the Subaru 8.2m on Mauna Kea, the 2.6m Nordic Optical Telescope and the 3.6m Italian Telescopio Nazionale Galileo at La Palma, the Mayall 4m telescope at Kitt Peak National Observatory, and the 3.5m ESO New Technology Telescope (NTT) at La Silla. Details of the SDSS-II Supernova Survey spectroscopic data reductions are given by Zheng et al. (2008). Comparison to high-quality SDSS galaxy spectra show that SN spectroscopic redshifts are accurate to when galaxy emission features are used and when SN features are used. In either case the error on the spectroscopic SN redshifts are negligible for the SN rate studies considered here.
While the difference imaging pipeline used during the SN search provides initial photometric measurements, subsequent to the search more precise SN photometry is provided using a scene modeling photometry (SMP) technique developed by Holtzman et al. (2008). The final analysis of SN light curves and the selection cuts used to define the SN rate sample discussed in this paper are based on SMP.
3 Galaxy Cluster Catalogs and Cluster Luminosity
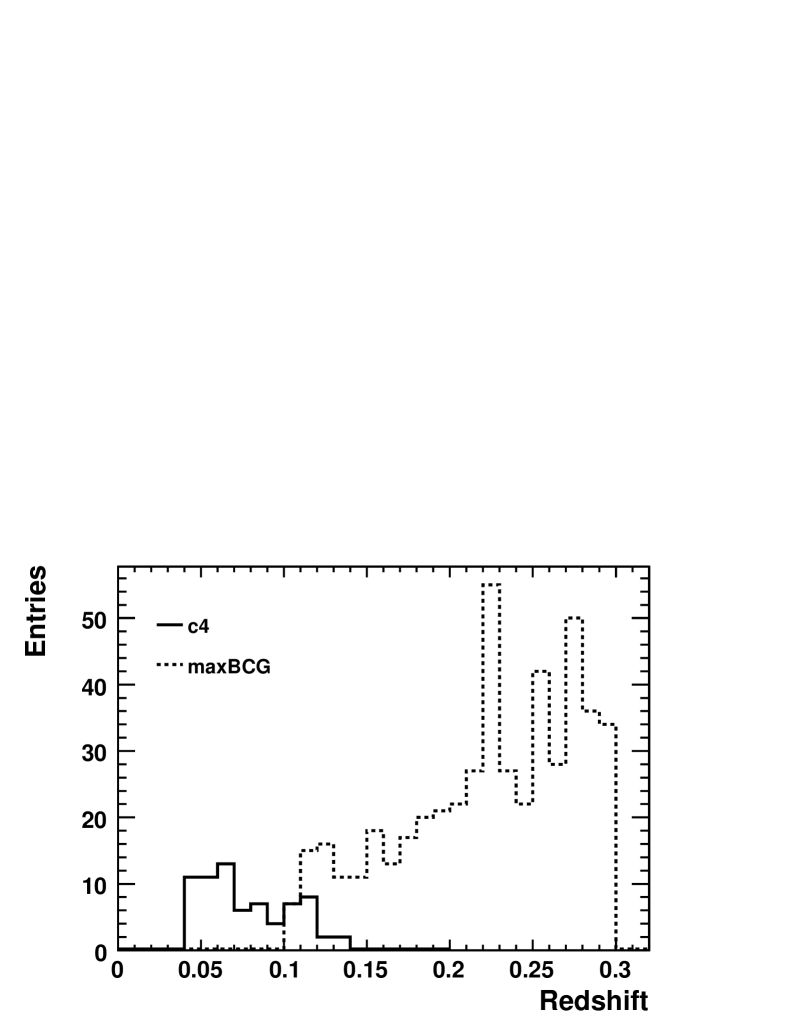
In studying the Type Ia SN rate in galaxy clusters we will work with two primary cluster catalogs; the C4 cluster catalog and the maxBCG cluster catalog. The C4 cluster finding algorithm and catalog are discussed in detail by Miller et al. (2005). The maxBCG catalog is presented by Koester et al. (2007a), and the cluster finding algorithm is described by Koester et al. (2007b). We briefly describe and summarize the content of these two cluster catalogs below. The redshift distributions for the clusters in these two catalogs that are in the SDSS-II Supernova Survey region are shown in Figure 1.
3.1 The C4 Cluster Catalog Description
The C4 cluster catalog is based on the main spectroscopic sample of the SDSS and contains clusters in the redshift range . The C4 cluster catalog provides, among other quantities, cluster coordinates, the luminosity of each cluster in the SDSS -band, and the number of galaxies identified as members of each cluster, . The main spectroscopic sample of galaxies from SDSS is designed to be complete to a limiting magnitude of (Strauss et al., 2002). For typical cluster galaxy luminosities, this implies that the identification of member galaxies, with , is complete for clusters at . For clusters above this redshift limit a correction has to be made to the total cluster luminosity. The C4 cluster identification algorithm works by searching for groups of objects that are tightly clustered in a 7-dimensional feature space, that includes spatial position, redshift, and observed colors. Note that there is no requirement that the colors for the galaxies be consistent with the colors of early-type galaxies, only that they be consistent with one another. The SDSS main galaxy sample cannot be complete, as the SDSS fiber-spectrograph imposes a minimum angular separation of 55” ( kpc at ) for objects targeted for the SDSS main spectroscopic galaxy sample (Stoughton et al., 2002). A correction is applied to the C4 cluster luminosities to account for this by including galaxies as members of the cluster when they satisfy the magnitude requirement () and have similar colors to the spectroscopically determined cluster members. The published C4 catalog is based on the 2nd data release of the SDSS (Abazajian et al., 2004) and contains 748 clusters. The catalog used in this work is an extended version of the C4 catalog that contains 1713 clusters and is based on the 5th data release of the SDSS (Adelman-McCarthy et al., 2007) (B. Nichol, private communication). The subset of clusters that we will use in measuring the cluster SN rate are those that lie within stripe 82, and that have . There are 71 C4 clusters in this subset.
3.2 The maxBCG Cluster Catalog Description
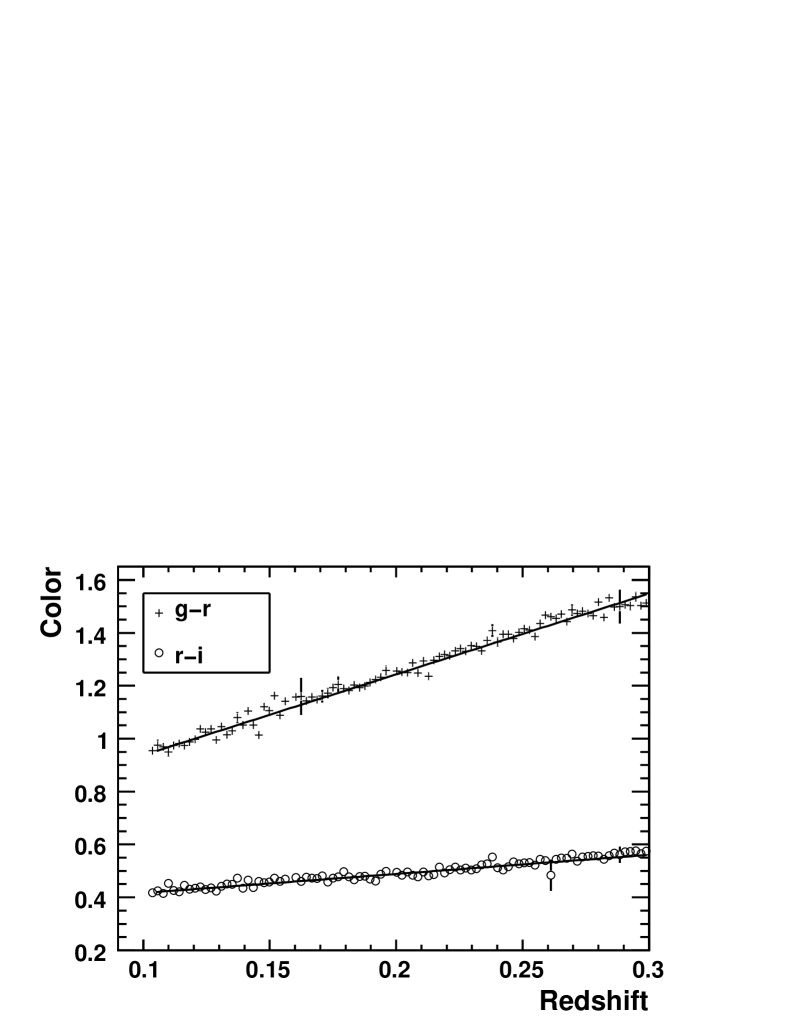
The maxBCG catalog is based on SDSS photometric measurements, and the cluster identification algorithm relies on the tight relationship between color and redshift for luminous red galaxies, which make up the majority of galaxy cluster composition. The maxBCG algorithm assigns a photometric redshift to each identified cluster that is derived by comparing the cluster member galaxy colors to the expected colors for early-type galaxies, as a function of redshift. Comparison of the photometric redshifts for the maxBCG clusters to the spectroscopically measured redshift of the brightest cluster galaxy (BCG), when available, shows that the residuals for redshift (photometric - spectroscopic) are well described by a Gaussian distribution with a mean of 0 and a standard deviation of . The observed () and () colors for maxBCG member galaxies, as a function of redshift, are shown in Figure 2. Linear functions were fit to to the and colors as a function of redshift, , and these will be used below for applying k-corrections to the observations. For reference, the functions derived, valid for , are,
| (1) | |||||
| (2) |
The maxBCG catalog is restricted to the redshift interval , and is thus highly complementary to the C4 catalog. The lower-limit for the maxBCG cluster catalog is imposed because the fractional photometric redshift errors for redshifts less than are significant and have a large systematic effect on derived cluster properties. Furthermore, cluster catalogs based on spectroscopic redshifts for are already available. The upper limit is imposed because, at , the “ break” that is responsible for the uniformity in early-type galaxy colors moves into the region between the SDSS observer frame and band filters. Thus, the accuracy and precision for galaxy photometric redshifts is severely diminished (Koester et al., 2007a). A lower-limit for the luminosity of cluster members is imposed so that the definition of the composition of the clusters is consistent across the redshift range. The limit corresponds to an absolute magnitude of , (the notation is explained in §3.3) and is such that the catalog is volume limited over the entire redshift range . Measures of the physical extent, , and of the richness, and , are provided for each cluster. is defined as the radius such that the mean density of early-type galaxies contained within is 200 times greater than the mean density of such galaxies (Koester et al., 2007a); is defined as the the number (total luminosity) of early-type galaxies contained within . The public maxBCG cluster catalog contains 13,823 clusters with . The subset of maxBCG clusters that we will use in measuring the cluster SN rate are those that lie within stripe 82, and that have . There are 492 maxBCG clusters in this subset. Additionally, this work makes use of a catalog of the maxBCG member galaxies (B. Koester, private communication).
In addition to the cluster richness and luminosity estimates that are provided with the maxBCG catalog, the maxBCG clusters have been extensively studied by e.g. Sheldon et al. (2009a); Johnston et al. (2007); Sheldon et al. (2009b). Of particular relevance to the study of the SN rate in galaxy clusters are the luminosity functions (LFs) of maxBCG clusters presented by Hansen et al. (2009), and we will make extensive use of these below.
3.3 Luminosity Content of C4 and maxBCG Cluster Catalogs
In §7 we will present the SN rate in galaxy clusters per unit luminosity. In this section we present a comprehensive discussion of the luminosity content for the C4 and maxBCG cluster catalogs. In what follows we use the notation to denote the observer frame magnitude, , for an object that has been k-corrected to a redshift . All luminosities presented here are for galaxies with ( is a characteristic luminosity for cluster members; see Equation 3). Correcting for the faint end of the luminosity distribution is discussed below.
The C4 catalog provides total cluster luminosities in SDSS -band. The total uncorrected -band luminosity for the galaxies identified as cluster members, for clusters considered in this study, is , where is the luminosity of the sun, and is the value of the Hubble constant in units of . As discussed in §3.1, these luminosities have to be corrected to account for incompleteness of the spectroscopic sample due to fiber-collisions. The total -band luminosity after making this correction is also provided by the C4 catalog and has the value . A mentioned above, the luminosities for clusters at also have to be corrected to account for the fact that some cluster galaxies with will have observed magnitudes fainter than the completeness limit of the main SDSS galaxy sample (). Of the 71 C4 clusters we are considering, 12 are at . Applying a correction to the luminosities of these 12 clusters, assuming the cluster luminosity functions of Hansen et al. (2009), results in a total -band luminosity for C4 clusters in this study of .
The maxBCG catalog includes the summed luminosities for member galaxies in and . However, the maxBCG cluster LFs presented by Hansen et al. (2009) represent a more complete study of the luminosity content of maxBCG clusters, and we will use these as the definitive measure of the total maxBCG cluster luminosities. In particular, a background subtraction has been performed that reduces inaccuracies in the cluster luminosities due to interloping foreground and background galaxies that may be counted as maxBCG cluster members. In Hansen et al. (2009), luminosity functions (LFs) are presented for maxBCG satellites, as a function of the richness measure, . The LFs account for both red and blue cluster galaxies, but do not include the contribution to the luminosity from the BCG. The LFs are assumed to take the form of a Schechter function,
| (3) |
where is a characteristic luminosity for cluster members, and is a normalization constant with units of inverse volume. The 3 parameters of the LFs, , are each expressed as functions of , with the general functional form of . The values of A (normalization) and (exponent) for these 3 LF parameters are given in Table 2. To use the LFs to compute the total luminosity we exploit the identity
| (4) |
where denotes the summed luminosity for the cluster, and the average luminosity, , is given by,
| (5) |
Equation 4 gives the total luminosity in a cluster, as a function of . The total luminosity in clusters in the SN survey region is then the sum over of , where is the number of clusters in the survey region for which the number of member galaxies is . Using this formalism we find that the total luminosity of maxBCG clusters in the survey region is .
| LF Parameter | Normalization | Exponent |
|---|---|---|
| (A) | () | |
| 0.20 | ||
| 0.15 | ||
| 0.28 | 0.25 |
Note. — Parameters refer to Schechter functions derived by Hansen et al. (2009).
3.3.1 Correcting Cluster Luminosities for Faint Galaxies
The luminosities quoted above for the C4 and maxBCG cluster catalogs include only galaxies with , which is a conventional way of characterizing cluster luminosities. In measuring the cluster SN rate we do not wish to exclude SNe occurring in faint galaxies, and so it is necessary to estimate the contribution to the total cluster luminosities from galaxies with . The total cluster luminosity can be estimated as , where denotes the luminosity for galaxies with and the correction factor, , is given by
| (6) |
For a typical maxBCG cluster with the power-law exponent of the luminosity function is (Table 2). For a cluster with the value for the exponent is . The corresponding correction factors are and . We will assume that the faint end of the luminosity function is a characteristic property of galaxy clusters and that the power-law behavior of the LFs for maxBCG clusters is appropriate for the C4 clusters also.
3.3.2 k-corrections
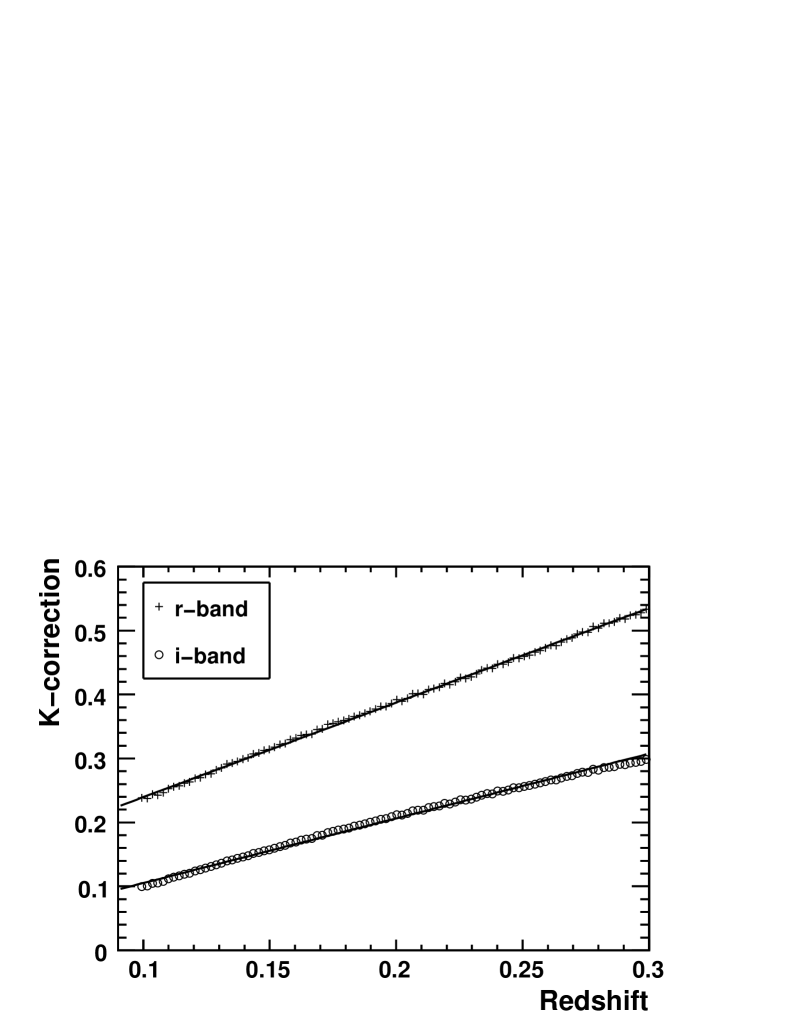
In order to minimize uncertainties due to k-corrections, the maxBCG magnitudes, and the corresponding luminosities, have been k-corrected to the median redshift of the clusters, . For comparison of the SN rate results based on the maxBCG clusters with previous cluster SN rate measurements, it will be necessary to k-correct the luminosities into more standard filters. In order to determine the appropriate k-corrections we selected a set of galaxies from the SDSS galaxy catalog that satisfy the color vs. redshift relations for maxBCG members discussed above. The corresponding set of galaxies contains members. We then matched these galaxies with their corresponding records in the photoz database provided by the SDSS catalog archive server (CAS), which provides k-corrections based on the work of Blanton et al. (2003a). We thereby determine an average k-correction as a function of redshift, appropriate to the early-type galaxies that make up the bulk of the maxBCG catalog. The k-corrections so derived, in SDSS and bands, are shown in Figure 3. For reference, the functions employed for k-corrections as a function of redshift, , valid for , are
| (7) | |||||
| (8) |
The functions above were derived by binning the k-corrections in redshift and taking the error on the mean (root mean square divided by square root of the number of entries) as the uncertainty. With this formalism the error on the fitted parameters is and is thus negligible in comparison to the statistical error on our SN Ia rate measurements.
To transform the maxBCG cluster luminosities from to , we note the following identity:
| (9) | |||||
| (10) |
We k-correct the maxBCG cluster luminosities from to because at a redshift rest-frame maps closely to observer-frame , and because the analysis of Hansen et al. (2009) that we take as the definitive measurement of the maxBCG cluster luminosities is performed for and not . Using the expressions given above for and , evaluated at , we derive the transformation . For comparison to other cluster SN rate measurements, it is necessary to express the cluster luminosities in units of . The conversion to solar luminosities is given by
| (11) |
where is the absolute magnitude of the sun. To compute the absolute magnitude of the sun in an arbitrary filter, we use a solar spectrum obtained from the CALSPEC111http://www.stsci.edu/hst/observatory/cdbs/calspec.html database, hosted by the Space Telescope Science Institute, and compute synthetic magnitudes using a custom piece of software written for this task. We thereby derive values for the absolute magnitude of the sun of (in agreement with the value published by Blanton & Roweis (2007)), and . With these values, Equation 11 becomes , giving the -band luminosity in maxBCG clusters, for galaxies with , as .
3.4 Uncertainty on the Cluster Luminosities
Any uncertainty on the luminosity of the clusters described above will propagate to an uncertainty on the derived cluster SN Ia rates. Sources of uncertainty on the cluster luminosities might include, e.g., uncertainties in the background subtraction used in defining the maxBCG cluster luminosities, or uncertainty in the correction for fiber collisions in defining the C4 clusters. The cluster catalogs described above do not include uncertainties on the cluster luminosities, and it is beyond the scope of this analysis to determine these uncertainties. However, as an estimate the order of magnitude of the cluster luminosity uncertainties, we note that Menanteau et al. (2010) give uncertainties on the luminosities of individual clusters, for a cluster catalog that was constructed in a similar way to the maxBCG cluster catalog. These uncertainties are , and include both statistical and systematic effects. As discussed above, the SN Ia rate analysis includes 71 and 492 clusters from the C4 and maxBCG catalogs, respectively. If the uncertainties on the individual clusters are and are independent, then the uncertainty on the total cluster luminosities will be . We conclude that uncertainty on the cluster luminosities is likely to be negligible in comparison to the statistical uncertainty on the cluster SN Ia rate measurement, but we acknowledge that any additional uncertainties on the cluster luminosities, or correlations between the uncertainties on the luminosity of the individual clusters, would impact the precision of our cluster SN Ia rate measurements.
4 The Cluster SN Sample
4.1 Type Ia Supernovae
To define the SN sample that is associated with galaxy clusters it is necessary to define selection criteria on both the SN light-curve properties, and the SN spatial correlation with clusters. As was done in our study of the low redshift SN rate from the first season of the SDSS-II Supernova Survey (Dilday et al., 2008), the SNe in the rate sample are required to meet certain selection criteria on their light-curve fits to the MLCS2k2 light curve model (Jha et al., 2007). For the present analysis the selection criteria are,
-
•
At least 1 observation at days relative to peak in the supernova rest-frame.
-
•
At least 1 observation at days relative to peak in the supernova rest-frame.
For maxBCG cluster SN candidates days, and for C4 cluster SN candidates days. The peak of the SN light curve is defined as the epoch of maximum luminosity in the rest-frame -band.
-
•
Fit probability .
The fit probability is computed assuming that the value of the minimum from the MLCS2k2 light curve fit follows a distribution with degrees of freedom, with the number of photometric observations. All SNe light curves are fit for epoch of maximum light, luminosity parameter () and extinction parameter (). When the SN redshift is known from spectroscopic measurement, the SN light curve is additionally fit for distance modulus. In the case of photometric SNe, the additional fit parameter is the redshift of the SN.
The requirement of a late time photometric measurement is used primarily to reduce misidentification of photometric SN Ia candidates. For the low redshifts of the C4 galaxy clusters the majority of SNe have spectroscopic confirmation of type, and so a requirement of days increases the size of the SN sample, without introducing uncertainty from misidentification of photometric SNe. For the maxBCG clusters, the number of photometric cluster SN candidates is significant and a stricter requirement, must be used. Additionally, the SNe that will be used for determining the SN rate are required to satisfy a set of selection criteria, based on fits of their search photometry to models of Type Ia, Type II and Type Ib/c light curve models. These additional selection criteria are identical to those discussed in more detail in Dilday et al. (2010). Briefly, the SN candidates must be discovered in at least 3 epochs of the SN search, must fit the Type Ia model well in relation to the Type II and Type Ib/c models, and must not have an overly broad light curve shape, as typified by the peculiar SN Ia 2005gj (Aldering et al., 2006; Prieto et al., 2007). The combination of cuts on light-curve sampling and shape effectively reject AGN from the cluster SN Ia sample.
A SN candidate is defined to be associated with a galaxy cluster if it satisfies
-
•
SN is within 1 Mpc projected distance of the center of a cluster.
-
•
SN redshift is consistent with the cluster redshift.
Projected distance here refers to the orthogonal distance from the SN to the center of the galaxy cluster, assuming the redshift of the cluster. The choice of 1 Mpc projected distance to define association with a cluster is chosen largely for consistency with previous cluster SN Ia rate measurements. The definition of redshift consistency depends on whether the SN and/or cluster redshifts are determined photometrically or spectroscopically. For the C4 clusters, the cluster redshifts are always precisely determined with a spectroscopic measurement, whereas the maxBCG cluster redshifts are determined photometrically. Consistency between the SN redshift, , and cluster redshift, , is defined in the following way:
-
•
Spectroscopic SN redshift and spectroscopic cluster redshift
-
•
Spectroscopic SN redshift and photometric cluster redshift
-
•
Photometric SN redshift and spectroscopic cluster redshift
-
•
Photometric SN redshift and photometric cluster redshift
where is the error on the SN photometric redshift. In the case that both the SN and the cluster have spectroscopically determined redshifts, the allowable spread in galaxy redshifts is taken as 0.015. This number was determined from the catalog of maxBCG cluster member galaxies. For each cluster that has at least 4 member galaxies with spectroscopically determined redshifts, we computed the root mean square (RMS) of the difference between the member spectroscopic redshifts and the redshift assigned to the cluster. The mean of the resulting distribution of RMS values is . A similar value is obtained if the difference between the cluster redshift and the member galaxy spectroscopic redshifts are instead fit with Gaussian distributions, and the mean of the distribution of RMS values for each Gaussian is computed. We note that for the 9 C4 cluster SNe that have spectroscopic redshifts for both the SN and the cluster, the deviation in redshift is and this cut could be made more strict without affecting the SN rate result. In the case that the SN has a spectroscopically measured redshift and the cluster has a photometrically determined redshift (maxBCG clusters only) the tolerance on redshift consistency (0.025) is determined by adding in quadrature the RMS spread of maxBCG member galaxy redshifts mentioned above (0.015) and the typical accuracy of the maxBCG cluster photometric redshifts ().
In the case that the SN redshift is determined photometrically, the cuts we apply correspond to a tolerance of , where represents the error on the SN redshift, added in quadrature to a tolerance on the cluster redshift. This is a rather loose tolerance on redshift consistency, and we discuss this issue further in §5. There are 9 SNe Ia in C4 clusters and 27 SNe Ia from maxBCG clusters that satisfy the selection criteria, and these are listed in Table 3 (C4 clusters) and Table 4 (maxBCG clusters), respectively. We note that SNe 12979 and 18375 occur in a cluster that is a member of both the C4 and maxBCG catalogs, and thus there are 34 distinct SNe Ia that pass the selection criteria. We note that SNe 16280, 18047 and 18362 are each associated with two distinct clusters, and that SNe 14279 and 16215 are associated with the same cluster. In the cases where a SN is associated with two clusters, we will count it only once in the SN rate calculation, assigning it to the nearest of the two clusters.
5 Corrections to the SN Ia Rate Measurements
5.1 Search Efficiency
The method for determining the SN discovery efficiency is based on the same Monte Carlo (MC) studies discussed in Dilday et al. (2010). However there is an important modification to be considered for SNe in galaxy clusters. It is a well established result that Type Ia SNe in early-type galaxies are more likely to be intrinsically faint, fast-declining SNe (e. g. Sullivan et al. (2006); Jha et al. (2007); Smith et al. (2009)). Therefore, the assumed distribution for the luminosity parameter of the MLCS2k2 light curve model, , for the entire SN sample, as employed in Dilday et al. (2010), is not appropriate for considering SNe in galaxy clusters. To determine the SN discovery efficiency for SNe in galaxy clusters, we generated a set of MC SNe with a distribution similar to the observed distribution for cluster SNe. The distribution assumed for cluster SNe Ia is shown in Figure 4. The fiducial distribution has mean , with an RMS of , and the cluster SNe distribution has mean , with an RMS of . Assuming a larger mean value for does not significantly affect the SN selection efficiency at the low redshifts of the C4 clusters, and has a effect at the redshifts of the maxBCG clusters. The SN selection efficiency at the redshifts of the C4 clusters is approximately constant for each observing season, with the values 0.77, 0.73 and 0.72 for the 2005, 2006 and 2007 observing seasons, respectively. The redshift dependent efficiencies used for the maxBCG cluster SNe are discussed in Dilday et al. (2010). Briefly, the efficiencies are well described by a function, , with , and . As in Dilday et al. (2008) and Dilday et al. (2010) the efficiency at low-redshift is significantly less than 1 due mainly to the requirements of early and late time observing epochs.

5.2 Contamination From Redshift Uncertainties
In §4, we have defined a set of criteria on the consistency of the SN and cluster redshifts, which, in the case of photometric redshifts, correspond roughly to a requirement that the redshifts match to within . We chose to apply a loose cut on the photometric redshift consistency because cluster SNe are rare by their nature and we wish to maximize the size of the sample, and because we assert that the requirement of a spatial correspondence with a cluster is already a strong filter on contamination from chance projections. Here we quantify further the expected contamination rate from chance projections, in the presence of finite error on the SN redshift measurement. We note that for the C4 cluster SN sample, all the SNe have spectroscopically measured redshifts (see Table 3), such that the contamination rate due to using SN photometric redshifts is manifestly 0, and we focus exclusively on contamination in the maxBCG SN sample.
To estimate the expected contamination rate we employ the following procedure. For each cluster in the maxBCG catalog we compute the expected contamination,
| (12) |
where is the SN number density, per unit redshift, is the cluster redshift, is the assumed error on the SN photometric redshift, and defines our cut on redshift consistency. The error on the photometric redshift, as a function of redshift, is shown in Dilday et al. (2010) to be . To compute , we use the power-law rate model from Dilday et al. (2008) ( ), along with the SDSS-II Supernova Survey SN efficiency function. The solid angle used in computing is the solid angle corresponding to a 1 Mpc separation from a cluster at redshift . However, we assume that no SNe will be spatially associated with a cluster and have a redshift within of the cluster unless it is, in fact, associated with the cluster. Therefore is assumed to be 0 for . The choice of as the spread of maxBCG cluster redshifts is discussed in §4.1. For each cluster in the maxBCG catalog, we also compute the number of expected cluster SNe Ia, , assuming a cluster SN Ia rate per unit -band luminosity that is broadly consistent with those given by Sharon et al. (2007b); Mannucci et al. (2008). The observed number of SNe that would be included in the sample, , is then related to the true number, , by
| (13) |
where erf(.) is the error function, and is the total expected contamination, . To clarify our approach, we note that the right-hand side of Eqn. (13) can be computed, with reasonable assumptions about the value of the cluster SN Ia rate. We can then compare this to the observed value of the left-hand side of Eqn. (13), and thereby infer the contamination rate of the SN Ia sample due to finite redshift uncertainties. For cuts on redshift consistency of and , has the values and , where is the assumed value of the cluster SN rate, and .
We first note that using values for , we consistently arrive at . By way of example, if we choose and , then we find (r.h.s. of Eqn. (13)). There are 7 SNe Ia with photometrically determined redshifts that are within of the cluster redshift (Table 3), and so this implies a value of (l.h.s. of Eqn. (13)). Therefore, we apply a bias correction to our maxBCG SN sample by assuming that the number of photometric SNe in the sample is 5, rather than the 7 listed in Table 4. To estimate the systematic error on the size of the maxBCG SN sample, we vary the assumed power-law SN rate model according to the errors given in Dilday et al. (2008), and vary the assumed cluster rate as , which results in an estimated systematic error of on the maxBCG cluster SN rate measurements, due to employing photometric redshifts for a subset of the cluster SNe.
5.3 Cluster Incompleteness and Contamination
Here we discuss the effect of incompleteness and contamination in the galaxy cluster catalogs on our cluster SN rate measurements, and on our comparisons of the cluster SN rate to the rate in early type galaxies in the field. In what follows we assume that the SN rate in both galaxy clusters and the field is proportional to the host luminosity, with proportionality constants and for clusters and the field, respectively. We note that the C4 cluster catalog has incompleteness and an contamination rate (Miller et al., 2005), and that the maxBCG catalog has incompleteness and an contamination rate (Koester et al., 2007b).
Cluster Incompleteness
With the ansatz that the cluster SN Ia rate is proportional to the stellar luminosity, independent of cluster richness, cluster incompleteness does not affect the derived value of the SN rate. That is, although real clusters may fail to be included in the cluster catalog, the cluster SN sample will be reduced in direct proportion to the luminosity of the missing clusters. Cluster incompleteness, however, will affect the value of the ratio of the rates for cluster vs. field early-type galaxies, as SNe occurring in clusters may be erroneously associated with the field SN sample.
In the presence of cluster incompleteness, the inferred ratio of the SN Ia rate in clusters, , to the SN rate in field early-type galaxies, , will be,
| (14) | |||||
| (15) |
where represents the true number of SNe (luminosity) in a given subset, and the , , and subscripts denote clusters, the field, and the portion of the clusters missed due to incompleteness, respectively. The quantity is the cluster incompleteness. To estimate the quantity , we compute a cluster luminosity density by dividing the summed -band luminosity from the maxBCG cluster catalog (k-corrected from as described in §3.3), for clusters in the SN survey region, by the corresponding volume. For redshifts this derived cluster luminosity density has the value . In Dilday et al. (2008) we showed that, using the luminosity functions of Blanton et al. (2003b), and an objective classification scheme for early-type galaxies, the -band luminosity density, for early type galaxies is . Applying a k-correction as described in §3.3, this corresponds to a -band luminosity density, for early-type galaxies, of . Therefore, we conclude that the ratio of the total -band light in cluster galaxies vs. field early-type galaxies, , is . The fraction of cluster luminosity contained in early-type galaxies is (Hansen et al., 2009), and thus the ratio of the -band light in cluster early-type galaxies vs. field early-type galaxies, , is . In turn, this results in an estimated correction factor, for values of the ratio of the SN rates, , of .
Cluster Contamination
Contamination of the cluster catalogs will affect both the value of the SN rate in clusters, and the ratio of the rate in clusters to the rate in the field.
The inferred cluster SN rate will be,
| (16) | |||||
| (17) |
where and are defined as in equation 14, and denotes field quantities that were erroneously identified with clusters. The quantity represents the cluster contamination rate. The estimated correction factor on the SN Ia cluster rate measurement due to cluster contamination is then for C4 clusters, and for maxBCG clusters.
The inferred ratio of the SN rate will be,
| (18) | |||||
| (19) |
with estimated correction factors on the cluster vs. field SN rates of for C4 clusters, and for maxBCG clusters.
5.4 Summary of SN Ia Rate Corrections
To summarize our consideration of necessary corrections to our cluster SN Ia rate measurements, we have considered the effects of the lesser average intrinsic luminosity for SNe Ia in early-type galaxies as compared to a representative galaxy sample, contamination of the cluster SN Ia sample due to the use of SN photometric redshifts, and incompleteness (clusters are not identified by the cluster finding algorithms) and contamination (objects that are not clusters are identified as clusters) of the galaxy cluster catalogs. The lesser average intrinsic luminosity of SNe Ia in early-type galaxies does not affect the selection efficiency for the relatively low-redshift C4 SN sample, and has an effect on the maxBCG SN sample. This factor is accounted for through the efficiency function, , that is mentioned in §7. We estimate that of the 7 SNe with photometric redshifts in the maxBCG SN Ia sample are not in fact associated with the cluster, and thus we will apply a correction of to the maxBCG cluster rate. Cluster contamination results in correction factors of for the C4 cluster SN Ia rate, and for the maxBCG cluster SN Ia rate. Cluster contamination also results in correction factors on the ratio of the SN Ia rate in early-type cluster galaxies to early-type field galaxies of for the C4 clusters, and for the maxBCG clusters. Additionally, cluster incompleteness results in an correction factor on the ratio of the SN Ia rate in early-type cluster galaxies to early-type field galaxies for both the C4 and the maxBCG clusters. We note that in Dilday et al. (2010) it is shown that the contamination of the SDSS-II SN Survey photometric SN Ia sample by non-Ia SNe is not more than . Photometric SNe Ia make up of the maxBCG cluster SN Ia sample, and so the overall contamination of the cluster SN Ia sample is . Contamination of the SN Ia sample due to lack of a spectroscopic identification is likely to be correlated with the contamination due to the use of photometric redshifts discussed above, and so the size of the effect is expected to be less than this.
6 Systematic Errors
Here we discuss possible sources of systematic error on our cluster SN Ia rate measurements. In the previous section we derived correction factors to account for incompleteness and contamination of the galaxy cluster catalogs. These correction factors will each have an uncertainty due to sample variance in the galaxy clusters in the SN survey region. We evaluate the uncertainty by assuming that each galaxy cluster in the sample will suffer from incompleteness or contamination with a probability given be the mean incompleteness and contamination rates given above. The uncertainty on the correction factor is then derived from the variance of the corresponding binomial distribution, with the number of events equal to the number of galaxy clusters considered. For the C4 clusters (71 clusters), this results in a uncertainty on the correction for cluster incompleteness and a uncertainty on the correction for cluster contamination. For the maxBCG clusters (492 clusters), this results in a - uncertainty on the correction for both cluster incompleteness and cluster contamination. Dilday et al. (2010) discuss the systematic uncertainty on the SN Ia rate for the full SDSS-II SN Survey sample, and show that assuming a value for the mean extinction in -band, , as opposed to the fiducial value of , has a large systematic effect on the derived SN Ia rates for SNe Ia at . For the present sample of SNe Ia in galaxy clusters, assuming a larger than fiducial value for the mean dust extinction is not appropriate, and so we do not include this systematic effect on the cluster SN Ia rate measurements. As noted in §3.4, any uncertainty on the cluster luminosities will also contribute to the total uncertainty on the cluster SN Ia rate.
7 SDSS SN Results
7.1 The C4 cluster rate
As discussed above, there are 9 type-Ia SNe in C4 clusters that satisfy the SN selection criteria. The total -band luminosity in the SN survey region, after correcting for the faint end of the LF, is , and the mean redshift of the C4 clusters is . The observing time for the SDSS-II Supernova Survey was 89, 90, and 90 days, for the 2005, 2006, and 2007 observing seasons, respectively. The SN selection efficiency is approximately constant over the range of the C4 clusters, with the values 0.77, 0.73, and 0.72 for the 2005, 2006, and 2007 observing seasons, respectively. Using these values, the SN rate in C4 clusters is
| (20) |
where denotes each observing season, is the survey observation time, is the SN selection efficiency, is the number of SNe Ia, is the total cluster luminosity in the band, and . The factor , where is the correction due to contamination of the cluster catalog, discussed in §5. The errors quoted are the 1-sigma statistical and systematic errors, respectively. We have used the mean survey efficiency, determined from Monte Carlo simulations, as both the positions of the clusters and the Monte Carlo SNe are effectively uniform random samplings of the survey area. Jorgensen (1997) (clusters) and Padmanabhan et al. (2004) (field) give the average stellar mass to luminosity ratio (-band) for early-type galaxies as , which is in good agreement with the M/L conversion employed by Sharon et al. (2007b). Using this assumption, the Type Ia SN rate per unit luminosity quoted above is equal to , with . Using the same average conversion factor from to as Sharon et al. (2007b), this corresponds to .
7.2 The maxBCG cluster rate
As discussed in §4, there are 27 SNe in maxBCG clusters from SDSS-II Supernova Survey that satisfy the selection criteria. As the SDSS-II Supernova Survey SN discovery efficiency is not well approximated as constant over the redshift range of the maxBCG catalog, in determining the SN rate in maxBCG clusters we use the more formal definition of the SN rate per unit luminosity, ,
| (21) |
with
| (22) |
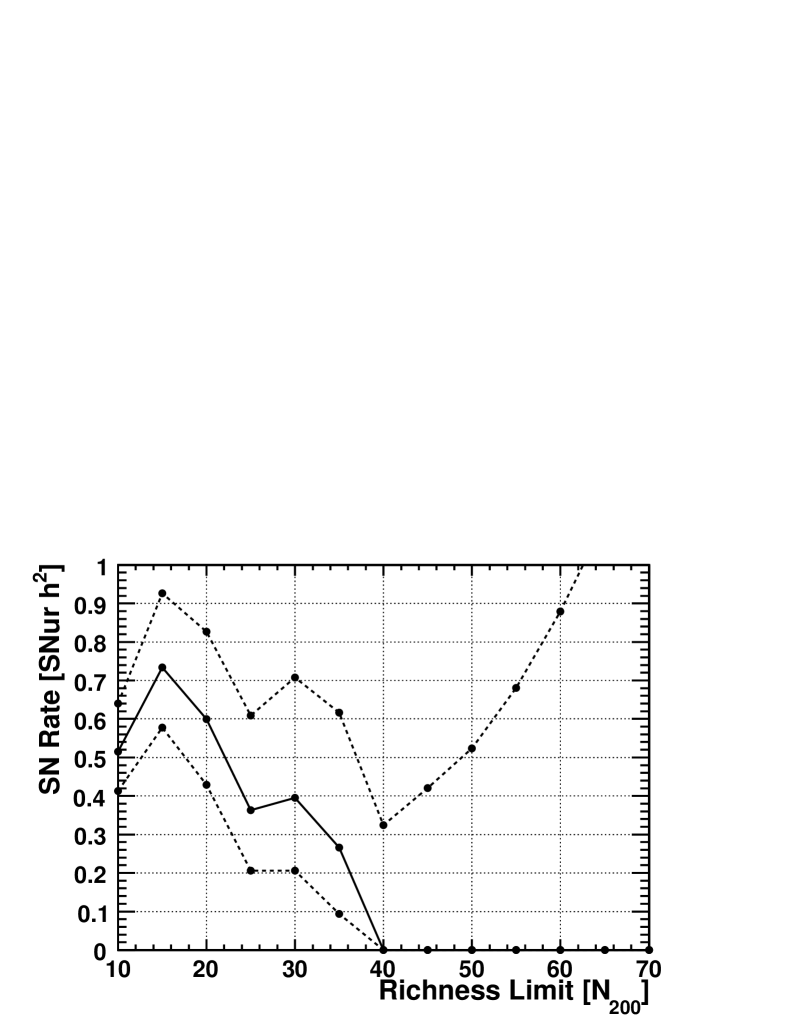
where is the earth frame observation time, is the total cluster luminosity as a function of redshift, and is the SN discovery efficiency. The factors and represent the corrections due to use of SN photometric redshifts and contamination of the cluster catalog, respectively (§5). These factors have the values and . For the maxBCG catalog is fixed to 0.1. In Figure 5 we show the value of the maxBCG cluster SN rate as a function of . This figure shows that the derived SN rate is not strongly sensitive to the upper limit on the cluster sample. If the upper limit is chosen as the upper limit of the maxBCG catalog, , then we have and , including the correction for the faint end of the LF. The derived value of the SN rate is thus . Figure 6 shows the cluster SN rate as a function of the limit on the projected distance from the center of the cluster, in units of . The fraction of red, early-type galaxies in clusters is larger at small separations from the cluster center, and in this sense the SN rate at smaller separations is a more reliable probe of the component of the SN rate that originates from an old stellar population. Furthermore, the extent of a cluster is not an unambiguously defined quantity, and SNe at smaller separations are more robustly associated with the cluster. Figure 6 shows that the derived SN rate is not strongly dependent on the limiting projected radius that we use to define cluster membership. Figure 7 shows the SN rate as a function of the lower limit on the cluster richness measure, .
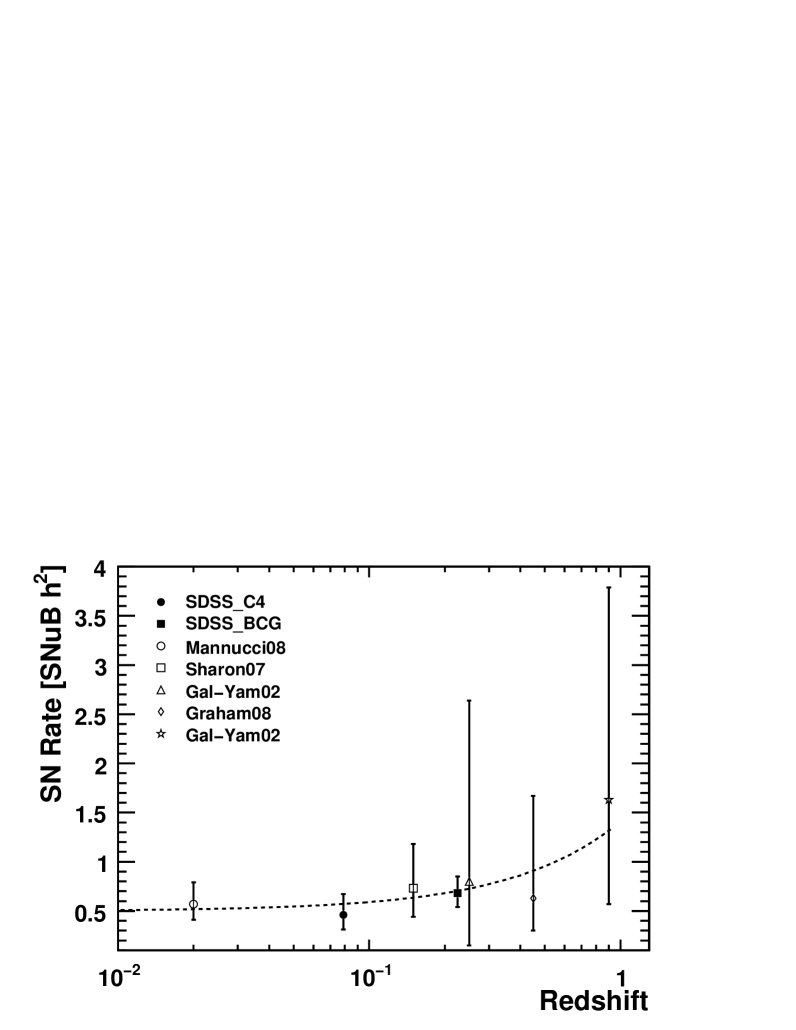
The SDSS-II Supernova Survey cluster rate results, along with the previous measurements listed in Table 1, in units of , are shown in Figure 8. A fit of the data to a linear model of the cluster SN Ia rate as a function of redshift, , gives best fit values of and (). A fit of the data to a constant model of the cluster SN Ia rate as a function of redshift, , gives a best fit value of ().
7.3 Cluster SN Rate vs. Field SN Rate
In Dilday et al. (2008), the SN rate in low-redshift early-type galaxies was estimated from the first year data of the SDSS-II Supernova Survey as . One SN in the sample described in Dilday et al. (2008) is a cluster SN, and hence the early-type field rate is . Using the same color cut () to differentiate early and late type galaxies as Dilday et al. (2008), we find that 6/9 of the C4 cluster SNe reside in early-type galaxies, while 20/27 maxBCG cluster SNe reside in early-type galaxies (18/25 after bias correction to account for SN photometric redshifts). According to Hansen et al. (2009), the fraction of light in early-type galaxies for the maxBCG clusters is . Therefore the cluster SN rate for early-type galaxies is and for C4 and maxBCG clusters, respectively. As discussed in §5, the ratio of the cluster early-type to field early-type rates must be multiplied by a factor to account for incompleteness of the galaxy cluster catalogs. The C4 and maxBCG cluster SN Ia rates are seen to be larger by factors of and compared to the field SN rate for early-type galaxies, respectively. This is broad agreement with the enhancement of the Type Ia SN rate in early-type galaxies in galaxy clusters reported by Mannucci et al. (2008).


7.4 The SN Ia Rate in Cluster BCGs
Of the 32 SNe in our cluster sample (after accounting for duplicates and for contamination due to use of SN photometric redshifts), 2 are in the brightest cluster galaxy (BCG) of the cluster. These are SNe 12979 and 13905. Another, SN 18890 appears to be in the BCG, although it has a somewhat ambiguous host. All 3 of these SNe are in C4 clusters, while 1 is in a maxBCG cluster. The cluster BCGs contain of the total -band cluster luminosity, and so the SN Ia rate, in the cluster BCGs, is for the C4 clusters and for the maxBCG clusters.
7.5 Hostless SNe
For the SNe Ia in our cluster sample, all but 2 are visually associated with a host galaxy. The 2 SNe Ia with no host evident in the images are SN 13073 and SN 19001. Additionally, one SN, SN 1782, lies at a distance from its presumed host galaxy, and might reasonably be considered to be hostless. Assuming SN 1782 is in fact a hostless SN, we can constrain the fraction of hostless SNe in galaxy clusters to be , with 1-sigma confidence interval . For comparison, Gal-Yam et al. (2003) reported 2 hostless SNe from a sample of 7 for an estimated fraction of hostless SNe of . We note, however, that the classification of these 2 SNe as hostless by Gal-Yam et al. (2003) relied, in part, on the observation of velocity offsets between the SNe and its potential host of . In principle a more thorough analysis of SN and galaxy spectra for SNe from the SDSS-II Supernova Survey may reveal additional hostless SNe. The clusters considered by Gal-Yam et al. (2003) were generally more massive than the clusters considered here, and an additionally possibility is that the rate of hostless SNe Ia in galaxy clusters is larger for more massive clusters.
7.6 Radial Distribution of Cluster SNe
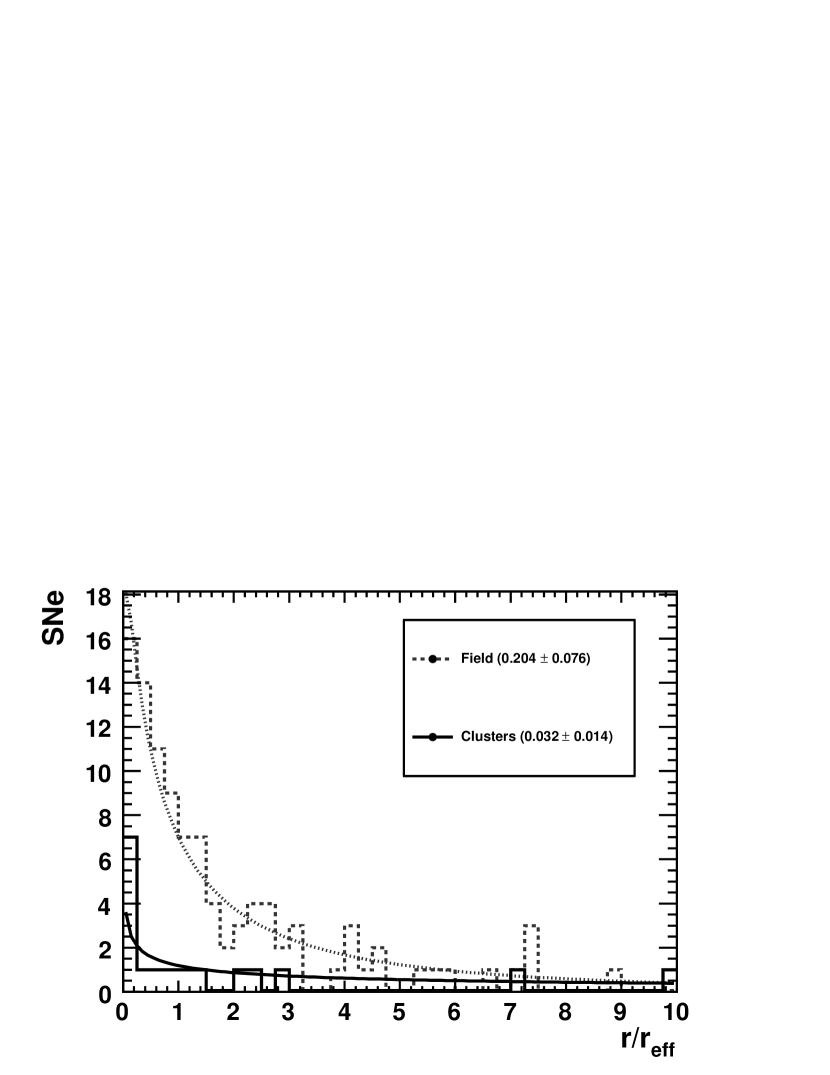
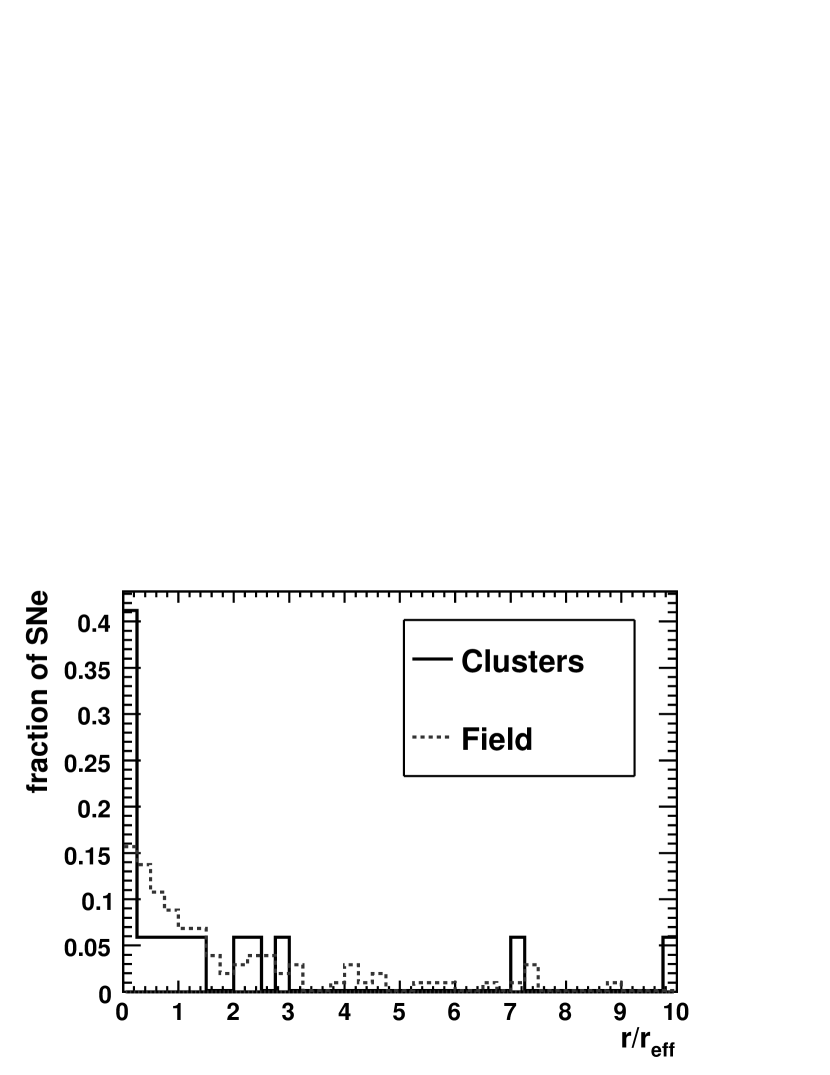
Forster & Schawinski (2008) have studied the radial distribution of SNe in early-type galaxies. The sample of SNe includes an unspecified number of SNe from the SDSS-II Supernova Survey. Here we consider the radial distribution for SNe for field and cluster ellipticals.
To construct the sample of early-type galaxies, we employ the following procedure. We first assign a host galaxy to each SNe by locating the nearest host from the SDSS database, in units of the isophotal radius of the host galaxy in -band. The algorithm is described in detail in Dilday et al. (2008). Early-type galaxies are defined as those host galaxies that satisfy the following criteria:
-
•
-
•
-
•
where and are the SDSS model magnitudes and is the error on the -band magnitude. It is a well established result that the color for SDSS galaxies is bimodal (Strateva et al., 2001), with early-type galaxies generally having . As discussed in Dilday et al. (2008), studies of the observed distribution for galaxies from the photometric redshift catalog of Oyaizu et al. (2008) suggest that may provide a more robust separation. The requirement that is imposed as the separation of stars and galaxies is fairly robust to this limit. The requirement that is imposed to remove outlying, poorly measured galaxies. The distributions of the distance of each SN from its host galaxy, for field and cluster early-type hosts, is shown in Figure 9. For field early-type galaxies, a fit of the data to a Sersic model of the luminosity distribution, , where denotes the distance of the SN in units of the deVaucouleurs radius of the host galaxy, gives a value for of , which is consistent with a deVaucouleurs profile (). Since the distribution of light in early-type galaxies is known to follow a deVaucouleurs profile, the result of the fit confirms the results of Forster & Schawinski (2008) that the SN rate in field ellipticals is well represented by a constant rate per unit luminosity. The radial distribution for SNe in cluster early-type galaxies shows an an enhancement at small radial separations in comparison to a deVaucouleurs profile. An enhancement of the SN Ia rate in regions that have undergone recent star formation has been reported by several authors (see, e.g., the review by Mannucci (2009)), and our observed enhancement at small radial separations is possible evidence for a component of the cluster SN Ia rate that tracks residual star formation activity in cluster early-type galaxies. Such an enhancement is in qualitative agreement with the larger SN Ia rate in cluster ellipticals, compared with field ellipticals, mentioned above and by Mannucci et al. (2008), as well as with recent independent evidence for some recent star-formation activity in early-type galaxies (e.g, Kaviraj et al. (2007)). Additionally, Della Valle et al. (2005) and Graham et al. (2010) report an enhancement of the SN Ia rate in radio-loud early-type galaxies, and attribute this to mergers that not only power the radio emission, but also provide a young stellar population that can account for the enhanced SN Ia rate. While we do not consider the radio properties of the early-type galaxies in our sample, it is possible that our results are related to the results of Della Valle et al. (2005) and Graham et al. (2010). While the best fit radial profile for cluster early type galaxies does not match a deVaucouleurs profile, a KS test on the radial distributions of SNe Ia in cluster and field ellipticals results in an probability that the data are drawn from the same underlying distribution. As discussed in Dilday et al. (2008), all SN selection efficiency calculations are based ultimately on artificial SNe Ia inserted directly into the survey search imaging data. Analysis of these artificial SNe Ia from the three observing seasons of the SDSS-II Supernova Survey does not show evidence for significant loss of efficiency near the cores of galaxies. While the artificial SNe were inserted into random galaxies that on the average may be less luminous in the cores than typical cluster galaxies, any additional inefficiency would only increase the observed enhancement of the SN Ia rate in the cores of cluster early-type galaxies.
8 Conclusions
We have presented measurements of the Type Ia SN rate in galaxy clusters over the redshift range . These measurements are based on 34 SNe Ia (32 after applying a bias correction) from the SDSS-II Supernova Survey and represent a significant statistical contribution to the study of the Type Ia SN rate in galaxy clusters. Our results on the Type Ia SN rate are consistent with previously published measurements, both in the local universe, and at redshift . In turn, the local and low-redshift SN cluster rates are consistent with the SN Ia rate at and at . The current cluster SN Ia rate measurements do not show evidence for a rapid increase in the SN rate, as a function of lookback time, as has been well-established for the volumetric SN Ia rate. It should be emphasized, however, that the existing cluster SN rate measurements are based on small samples and the measurements do not rule out a redshift dependence to the cluster SN rate. A fit of the cluster SN Ia rate measurements to a linear dependence on redshift results in a best fit slope of per unit redshift. We find a ratio of the SN Ia rate in cluster early-type galaxies to that of the SN Ia rate in field early-type galaxies of and , for C4 and maxBCG clusters, respectively.
We find that at most 3 of the SNe Ia in our sample are hostless, intra-cluster SNe, which is significantly less than the hostless fraction estimated from previous cluster SN studies.
We have presented the first study of the radial distribution of SNe Ia in cluster early-type galaxies. The radial distribution for SNe in cluster early-type galaxies shows an enhancement at small radial separations in comparison to the radial distribution in field early-type galaxies, which are well described by a deVaucouleurs profile. This enhancement could be attributable to residual star formation in cluster early-type galaxies, which could explain the higher SN Ia rate observed in cluster early-type galaxies in comparison to early-type galaxies in the field.
| SDSS Id | IAU | SNaa“Ia” refers to spectroscopically identified SN; see Zheng et al. (2008). “Ia-photo+z” refers to photometrically identified SN with a spectroscopically measured host galaxy redshift; see Dilday et al. (2010). | Cluster | Cluster | Cluster | SN | Projected | ddObserver frame magnitudes for the SN host galaxy. | ddObserver frame magnitudes for the SN host galaxy. | ddObserver frame magnitudes for the SN host galaxy. | ccObserver frame magnitudes for the SN host galaxy. | |
|---|---|---|---|---|---|---|---|---|---|---|---|---|
| Name | Type | Ra (J2000) | Dec (J2000) | Redshift | Redshift | Dist. (Mpc ) | ||||||
| 6295 | 2005js | Ia | 23.72890 | -0.65160 | 0.0814 | 0.0786 | 0.2804 | 38 | ||||
| 12979 | 2006gf | Ia | 11.56640 | +0.00200 | 0.1140 | 0.1153 | 0.1831 | 34 | ||||
| 13905 | Ia-photo+z | 11.54900 | +0.34870 | 0.1153 | 0.1151 | 0.7008 | 5 | |||||
| 14279 | 2006hx | Ia | 18.78670 | +0.29720 | 0.0450 | 0.0444 | 0.6849 | 128 | ||||
| 16215 | 2006ne | Ia | 18.78670 | +0.29720 | 0.0450 | 0.0455 | 0.8912 | 128 | ||||
| 16280bbSN does not satisfy the color-typing criteria. See Dilday et al. (2010). | 2006nz | Ia | 14.27050 | -0.91880 | 0.0443 | 0.0370 | 0.7514 | 13 | ||||
| 16280bbSN does not satisfy the color-typing criteria. See Dilday et al. (2010). | 2006nz | Ia | 14.06720 | -1.25510 | 0.0442 | 0.0370 | 0.1348 | 65 | ||||
| 18375 | 2007lg | Ia | 11.56640 | +0.00200 | 0.1140 | 0.1169 | 0.2683 | 34 | ||||
| 18890 | 2007mm | Ia | 16.43170 | -0.84980 | 0.0669 | 0.0654 | 0.2968 | 5 | ||||
| 19155 | 2007mn | Ia | 31.01580 | +0.25880 | 0.0770 | 0.0760 | 0.9720 | 8 | ||||
| 19968 | 2007ol | Ia | 24.34470 | -0.44720 | 0.0558 | 0.0551 | 0.3693 | 19 |
Note. — SDSS Id denotes internal candidate designation. The horizontal lines delineate SNe discovered during the 3 distinct observing seasons of the SDSS-II Supernova Survey.
| SDSS Id | IAU | SNaa“Ia” and “Ia?” refer to spectroscopically identified SNe; see Zheng et al. (2008). “Ia-photo+z” and “Ia-photo” refer to photometrically identified SNe with and without a spectroscopically measured host galaxy redshift, respectively; see Dilday et al. (2010). | Cluster | Cluster | Cluster | SN | SN ccErrors are shown for photometric SNe Ia. For spectroscoipcally measured redshifts, the error is negligible and is not listed (§2) | Projected | ddObserver frame magnitudes for the SN host galaxy. | ddObserver frame magnitudes for the SN host galaxy. | ddObserver frame magnitudes for the SN host galaxy. | bbValue has been k-corrected to the rest frame of the galaxy; see §3.3.2 | |
|---|---|---|---|---|---|---|---|---|---|---|---|---|---|
| Name | Type | Ra (J2000) | Dec (J2000) | Redshift | Redshift | Redshift Err. | Dist. (Mpc ) | ||||||
| 1008 | 2005il | Ia-photo+z | 28.17341 | +1.13440 | 0.2025 | 0.2251 | 0.8972 | 19 | |||||
| 1740 | Ia-photo+z | 5.34753 | -0.82581 | 0.1837 | 0.1661 | 0.6152 | 25 | ||||||
| 1782 | Ia-photo | 337.85896 | +0.29531 | 0.2781 | 0.2382 | 0.0189 | 0.5092 | 12 | |||||
| 5549 | 2005hx | Ia | 3.21852 | +0.22231 | 0.1405 | 0.1198 | 0.2569 | 16 | |||||
| 5717 | 2005ia | Ia | 17.95342 | -0.01817 | 0.2646 | 0.2506 | 0.6039 | 16 | |||||
| 8280 | Ia-photo+z | 8.59684 | +0.85725 | 0.1972 | 0.1838 | 0.5378 | 32 | ||||||
| 12979 | 2006gf | Ia | 11.60084 | +0.00238 | 0.1189 | 0.1153 | 0.0069 | 23 | |||||
| 13073 | Ia-photo | 335.99616 | +0.10358 | 0.2889 | 0.3246 | 0.0336 | 0.5282 | 15 | |||||
| 13655 | 2006hs | Ia | 39.03651 | -1.00655 | 0.2727 | 0.2512 | 0.2146 | 13 | |||||
| 14340 | Ia-photo+z | 345.81978 | -0.85395 | 0.2754 | 0.2762 | 0.0741 | 37 | ||||||
| 15201 | 2006ks | Ia | 337.53267 | -0.00373 | 0.2188 | 0.2073 | 0.1352 | 32 | |||||
| 15823 | Ia-photo+z | 314.20449 | +0.25007 | 0.2296 | 0.2142 | 0.6484 | 22 | ||||||
| 16021 | 2006nc | Ia | 13.84586 | -0.33626 | 0.1459 | 0.1231 | 0.3384 | 15 | |||||
| 16467 | Ia-photo+z | 328.59792 | +0.08437 | 0.2106 | 0.2188 | 0.3120 | 21 | ||||||
| 17435 | 2007ka | Ia | 20.36507 | +0.02192 | 0.2160 | 0.2210 | 0.3713 | 18 | |||||
| 17568 | 2007kb | Ia | 313.04022 | +0.33160 | 0.1486 | 0.1390 | 0.5406 | 23 | |||||
| 18047 | Ia-photo | 22.02004 | -0.66489 | 0.2592 | 0.3614 | 0.0446 | 0.5526 | 16 | |||||
| 18047 | Ia-photo | 22.08698 | -0.70110 | 0.2970 | 0.3614 | 0.0446 | 0.5014 | 15 | |||||
| 18362 | Ia-photo | 10.13752 | -0.23279 | 0.2350 | 0.2197 | 0.0278 | 0.4781 | 16 | |||||
| 18362 | Ia-photo | 10.06133 | -0.12293 | 0.2269 | 0.2197 | 0.0278 | 0.8767 | 28 | |||||
| 18375 | 2007lg | Ia | 11.60084 | +0.00238 | 0.1189 | 0.1169 | 0.4614 | 23 | |||||
| 18767 | Ia-photo | 4.55214 | +0.80302 | 0.2377 | 0.2728 | 0.0322 | 0.1752 | 13 | |||||
| 18909 | 2007lq | Ia? | 5.79401 | +0.97633 | 0.2296 | 0.2258 | 0.1231 | 16 | |||||
| 19001 | Ia-photo | 41.65704 | -0.38006 | 0.2457 | 0.2688 | 0.0243 | 0.7061 | 11 | |||||
| 19341 | 2007nf | Ia | 15.84750 | +0.31945 | 0.2539 | 0.2339 | 0.1744 | 22 | |||||
| 19969 | 2007pt | Ia | 31.88020 | -0.24733 | 0.1593 | 0.1744 | 0.5710 | 15 | |||||
| 20111 | 2007pw | Ia | 354.47760 | +0.22478 | 0.2619 | 0.2468 | 0.8811 | 37 | |||||
| 20232 | Ia-photo+z | 7.08765 | -0.01711 | 0.2323 | 0.2154 | 0.3849 | 21 | ||||||
| 20882 | Ia-photo | 16.97586 | +0.51513 | 0.2808 | 0.3181 | 0.0186 | 0.5792 | 19 |
Note. — SDSS Id denotes internal candidate designation. The horizontal lines delineate SNe discovered during the 3 distinct observing seasons of the SDSS-II Supernova Survey.
References
- Abazajian et al. (2004) Abazajian, K., Adelman-McCarthy, J. K., Agüeros, M. A., Allam, S. S., Anderson, K., Anderson, S. F., Annis, J., Bahcall, N. A., Baldry, I. K., Bastian, S., Berlind, A., Bernardi, M., Blanton, M. R., Bochanski, Jr., J. J., Boroski, W. N., Briggs, J. W., Brinkmann, J., Brunner, R. J., Budavári, T., Carey, L. N., Carliles, S., Castander, F. J., Connolly, A. J., Csabai, I., Doi, M., Dong, F., Eisenstein, D. J., Evans, M. L., Fan, X., Finkbeiner, D. P., Friedman, S. D., Frieman, J. A., Fukugita, M., Gal, R. R., Gillespie, B., Glazebrook, K., Gray, J., Grebel, E. K., Gunn, J. E., Gurbani, V. K., Hall, P. B., Hamabe, M., Harris, F. H., Harris, H. C., Harvanek, M., Heckman, T. M., Hendry, J. S., Hennessy, G. S., Hindsley, R. B., Hogan, C. J., Hogg, D. W., Holmgren, D. J., Ichikawa, S.-i., Ichikawa, T., Ivezić, Ž., Jester, S., Johnston, D. E., Jorgensen, A. M., Kent, S. M., Kleinman, S. J., Knapp, G. R., Kniazev, A. Y., Kron, R. G., Krzesinski, J., Kunszt, P. Z., Kuropatkin, N., Lamb, D. Q., Lampeitl, H., Lee, B. C., Leger, R. F., Li, N., Lin, H., Loh, Y.-S., Long, D. C., Loveday, J., Lupton, R. H., Malik, T., Margon, B., Matsubara, T., McGehee, P. M., McKay, T. A., Meiksin, A., Munn, J. A., Nakajima, R., Nash, T., Neilsen, Jr., E. H., Newberg, H. J., Newman, P. R., Nichol, R. C., Nicinski, T., Nieto-Santisteban, M., Nitta, A., Okamura, S., O’Mullane, W., Ostriker, J. P., Owen, R., Padmanabhan, N., Peoples, J., Pier, J. R., Pope, A. C., Quinn, T. R., Richards, G. T., Richmond, M. W., Rix, H.-W., Rockosi, C. M., Schlegel, D. J., Schneider, D. P., Scranton, R., Sekiguchi, M., Seljak, U., Sergey, G., Sesar, B., Sheldon, E., Shimasaku, K., Siegmund, W. A., Silvestri, N. M., Smith, J. A., Smolčić, V., Snedden, S. A., Stebbins, A., Stoughton, C., Strauss, M. A., SubbaRao, M., Szalay, A. S., Szapudi, I., Szkody, P., Szokoly, G. P., Tegmark, M., Teodoro, L., Thakar, A. R., Tremonti, C., Tucker, D. L., Uomoto, A., Vanden Berk, D. E., Vandenberg, J., Vogeley, M. S., Voges, W., Vogt, N. P., Walkowicz, L. M., Wang, S.-i., Weinberg, D. H., West, A. A., White, S. D. M., Wilhite, B. C., Xu, Y., Yanny, B., Yasuda, N., Yip, C.-W., Yocum, D. R., York, D. G., Zehavi, I., Zibetti, S., & Zucker, D. B. 2004, AJ, 128, 502
- Adelman-McCarthy et al. (2007) Adelman-McCarthy, J. K., Agüeros, M. A., Allam, S. S., Anderson, K. S. J., Anderson, S. F., Annis, J., Bahcall, N. A., Bailer-Jones, C. A. L., Baldry, I. K., Barentine, J. C., Beers, T. C., Belokurov, V., Berlind, A., Bernardi, M., Blanton, M. R., Bochanski, J. J., Boroski, W. N., Bramich, D. M., Brewington, H. J., Brinchmann, J., Brinkmann, J., Brunner, R. J., Budavári, T., Carey, L. N., Carliles, S., Carr, M. A., Castander, F. J., Connolly, A. J., Cool, R. J., Cunha, C. E., Csabai, I., Dalcanton, J. J., Doi, M., Eisenstein, D. J., Evans, M. L., Evans, N. W., Fan, X., Finkbeiner, D. P., Friedman, S. D., Frieman, J. A., Fukugita, M., Gillespie, B., Gilmore, G., Glazebrook, K., Gray, J., Grebel, E. K., Gunn, J. E., de Haas, E., Hall, P. B., Harvanek, M., Hawley, S. L., Hayes, J., Heckman, T. M., Hendry, J. S., Hennessy, G. S., Hindsley, R. B., Hirata, C. M., Hogan, C. J., Hogg, D. W., Holtzman, J. A., Ichikawa, S.-i., Ichikawa, T., Ivezić, Ž., Jester, S., Johnston, D. E., Jorgensen, A. M., Jurić, M., Kauffmann, G., Kent, S. M., Kleinman, S. J., Knapp, G. R., Kniazev, A. Y., Kron, R. G., Krzesinski, J., Kuropatkin, N., Lamb, D. Q., Lampeitl, H., Lee, B. C., Leger, R. F., Lima, M., Lin, H., Long, D. C., Loveday, J., Lupton, R. H., Mandelbaum, R., Margon, B., Martínez-Delgado, D., Matsubara, T., McGehee, P. M., McKay, T. A., Meiksin, A., Munn, J. A., Nakajima, R., Nash, T., Neilsen, Jr., E. H., Newberg, H. J., Nichol, R. C., Nieto-Santisteban, M., Nitta, A., Oyaizu, H., Okamura, S., Ostriker, J. P., Padmanabhan, N., Park, C., Peoples, J. J., Pier, J. R., Pope, A. C., Pourbaix, D., Quinn, T. R., Raddick, M. J., Re Fiorentin, P., Richards, G. T., Richmond, M. W., Rix, H.-W., Rockosi, C. M., Schlegel, D. J., Schneider, D. P., Scranton, R., Seljak, U., Sheldon, E., Shimasaku, K., Silvestri, N. M., Smith, J. A., Smolčić, V., Snedden, S. A., Stebbins, A., Stoughton, C., Strauss, M. A., SubbaRao, M., Suto, Y., Szalay, A. S., Szapudi, I., Szkody, P., Tegmark, M., Thakar, A. R., Tremonti, C. A., Tucker, D. L., Uomoto, A., Vanden Berk, D. E., Vandenberg, J., Vidrih, S., Vogeley, M. S., Voges, W., Vogt, N. P., Weinberg, D. H., West, A. A., White, S. D. M., Wilhite, B., Yanny, B., Yocum, D. R., York, D. G., Zehavi, I., Zibetti, S., & Zucker, D. B. 2007, ApJS, 172, 634
- Alard & Lupton (1998) Alard, C. & Lupton, R. H. 1998, ApJ, 503, 325
- Aldering et al. (2006) Aldering, G., Antilogus, P., Bailey, S., Baltay, C., Bauer, A., Blanc, N., Bongard, S., Copin, Y., Gangler, E., Gilles, S., Kessler, R., Kocevski, D., Lee, B. C., Loken, S., Nugent, P., Pain, R., Pecontal, E., Pereira, R., Perlmutter, S., Rabinowitz, D., Rigaudier, G., Scalzo, R., Smadja, G., Thomas, R. C., Wang, L., & Weaver, B. A. 2006, ApJ, 650, 510
- Barbon (1978) Barbon, R. 1978, AJ, 83, 13
- Blanton et al. (2003a) Blanton, M. R., Brinkmann, J., Csabai, I., Doi, M., Eisenstein, D., Fukugita, M., Gunn, J. E., Hogg, D. W., & Schlegel, D. J. 2003a, AJ, 125, 2348
- Blanton et al. (2003b) Blanton, M. R., Hogg, D. W., Bahcall, N. A., Brinkmann, J., Britton, M., Connolly, A. J., Csabai, I., Fukugita, M., Loveday, J., Meiksin, A., Munn, J. A., Nichol, R. C., Okamura, S., Quinn, T., Schneider, D. P., Shimasaku, K., Strauss, M. A., Tegmark, M., Vogeley, M. S., & Weinberg, D. H. 2003b, ApJ, 592, 819
- Blanton & Roweis (2007) Blanton, M. R. & Roweis, S. 2007, AJ, 133, 734
- Cappellaro et al. (1999) Cappellaro, E., Evans, R., & Turatto, M. 1999, A&A, 351, 459
- Crane et al. (1977) Crane, P., Tammann, G. A., & Woltjer, L. 1977, Nature, 265, 124
- Della Valle et al. (2005) Della Valle, M., Panagia, N., Padovani, P., Cappellaro, E., Mannucci, F., & Turatto, M. 2005, ApJ, 629, 750
- Dilday et al. (2008) Dilday, B., Kessler, R., Frieman, J. A., Holtzman, J., Marriner, J., Miknaitis, G., Nichol, R. C., Romani, R., Sako, M., Bassett, B., Becker, A., Cinabro, D., DeJongh, F., Depoy, D. L., Doi, M., Garnavich, P. M., Hogan, C. J., Jha, S., Konishi, K., Lampeitl, H., Marshall, J. L., McGinnis, D., Prieto, J. L., Riess, A. G., Richmond, M. W., Schneider, D. P., Smith, M., Takanashi, N., Tokita, K., van der Heyden, K., Yasuda, N., Zheng, C., Barentine, J., Brewington, H., Choi, C., Crotts, A., Dembicky, J., Harvanek, M., Im, M., Ketzeback, W., Kleinman, S. J., Krzesiński, J., Long, D. C., Malanushenko, E., Malanushenko, V., McMillan, R. J., Nitta, A., Pan, K., Saurage, G., Snedden, S. A., Watters, S., Wheeler, J. C., & York, D. 2008, ApJ, 682, 262
- Dilday et al. (2010) Dilday, B., Smith, M., Bassett, B., Becker, A., Bender, R., Castander, F., Cinabro, D., Filippenko, A. V., Frieman, J. A., Galbany, L., Garnavich, P. M., Goobar, A., Hopp, U., Ihara, Y., Jha, S. W., Kessler, R., Lampeitl, H., Marriner, J., Miquel, R., Molla, M., Nichol, R. C., Nordin, J., Riess, A. G., Sako, M., Schneider, D. P., Sollerman, J., Wheeler, J. C., Ostman, L., Bizyaev, D., Brewington, H., Malanushenko, E., Malanushenko, V., Oravetz, D., Pan, K., Simmons, A., & Snedden, S. 2010, ArXiv e-prints
- Forster & Schawinski (2008) Forster, F. & Schawinski, K. 2008, MNRAS, 388, L74
- Frieman et al. (2008) Frieman, J. A., Bassett, B., Becker, A., Choi, C., Cinabro, D., DeJongh, F., Depoy, D. L., Dilday, B., Doi, M., Garnavich, P. M., Hogan, C. J., Holtzman, J., Im, M., Jha, S., Kessler, R., Konishi, K., Lampeitl, H., Marriner, J., Marshall, J. L., McGinnis, D., Miknaitis, G., Nichol, R. C., Prieto, J. L., Riess, A. G., Richmond, M. W., Romani, R., Sako, M., Schneider, D. P., Smith, M., Takanashi, N., Tokita, K., van der Heyden, K., Yasuda, N., Zheng, C., Adelman-McCarthy, J., Annis, J., Assef, R. J., Barentine, J., Bender, R., Blandford, R. D., Boroski, W. N., Bremer, M., Brewington, H., Collins, C. A., Crotts, A., Dembicky, J., Eastman, J., Edge, A., Edmondson, E., Elson, E., Eyler, M. E., Filippenko, A. V., Foley, R. J., Frank, S., Goobar, A., Gueth, T., Gunn, J. E., Harvanek, M., Hopp, U., Ihara, Y., Ivezić, Ž., Kahn, S., Kaplan, J., Kent, S., Ketzeback, W., Kleinman, S. J., Kollatschny, W., Kron, R. G., Krzesiński, J., Lamenti, D., Leloudas, G., Lin, H., Long, D. C., Lucey, J., Lupton, R. H., Malanushenko, E., Malanushenko, V., McMillan, R. J., Mendez, J., Morgan, C. W., Morokuma, T., Nitta, A., Ostman, L., Pan, K., Rockosi, C. M., Romer, A. K., Ruiz-Lapuente, P., Saurage, G., Schlesinger, K., Snedden, S. A., Sollerman, J., Stoughton, C., Stritzinger, M., Subba Rao, M., Tucker, D., Vaisanen, P., Watson, L. C., Watters, S., Wheeler, J. C., Yanny, B., & York, D. 2008, AJ, 135, 338
- Fukugita et al. (1996) Fukugita, M., Ichikawa, T., Gunn, J. E., Doi, M., Shimasaku, K., & Schneider, D. P. 1996, AJ, 111, 1748
- Gal-Yam et al. (2002) Gal-Yam, A., Maoz, D., & Sharon, K. 2002, MNRAS, 332, 37
- Gal-Yam et al. (2003) Gal-Yam, A., Maoz, D., Guhathakurta, P., & Filippenko, A. V. 2003, AJ, 125, 1087
- Gal-Yam et al. (2008) —. 2008, ApJ, 680, 550
- Graham et al. (2008) Graham, M. L., Pritchet, C. J., Sullivan, M., Gwyn, S. D. J., Neill, J. D., Hsiao, E. Y., Astier, P., Balam, D., Balland, C., Basa, S., Carlberg, R. G., Conley, A., Fouchez, D., Guy, J., Hardin, D., Hook, I. M., Howell, D. A., Pain, R., Perrett, K., Regnault, N., Baumont, S., LeDu, J., Lidman, C., Perlmutter, S., Ripoche, P., Suzuki, N., Walker, E. S., & Zhang, T. 2008, AJ, 135, 1343
- Graham et al. (2010) Graham, M. L., Pritchet, C. J., Sullivan, M., Howell, D. A., Gwyn, S. D. J., Astier, P., Balland, C., Basa, S., Carlberg, R. G., Conley, A., Fouchez, D., Guy, J., Hardin, D., Hook, I. M., Pain, R., Perrett, K., Regnault, N., Rich, J., Balam, D., Fabbro, S., Hsiao, E. Y., Mourao, A., Palanque-Delabrouille, N., Perlmutter, S., Ruhlman-Kleider, V., Suzuki, N., Fakhouri, H. K., & Walker, E. S. 2010, AJ, 139, 594
- Greggio (2005) Greggio, L. 2005, A&A, 441, 1055
- Gunn et al. (1998) Gunn, J. E., Carr, M., Rockosi, C., Sekiguchi, M., Berry, K., Elms, B., de Haas, E., Ivezić, Ž., Knapp, G., Lupton, R., Pauls, G., Simcoe, R., Hirsch, R., Sanford, D., Wang, S., York, D., Harris, F., Annis, J., Bartozek, L., Boroski, W., Bakken, J., Haldeman, M., Kent, S., Holm, S., Holmgren, D., Petravick, D., Prosapio, A., Rechenmacher, R., Doi, M., Fukugita, M., Shimasaku, K., Okada, N., Hull, C., Siegmund, W., Mannery, E., Blouke, M., Heidtman, D., Schneider, D., Lucinio, R., & Brinkman, J. 1998, AJ, 116, 3040
- Gunn et al. (2006) Gunn, J. E., Siegmund, W. A., Mannery, E. J., Owen, R. E., Hull, C. L., Leger, R. F., Carey, L. N., Knapp, G. R., York, D. G., Boroski, W. N., Kent, S. M., Lupton, R. H., Rockosi, C. M., Evans, M. L., Waddell, P., Anderson, J. E., Annis, J., Barentine, J. C., Bartoszek, L. M., Bastian, S., Bracker, S. B., Brewington, H. J., Briegel, C. I., Brinkmann, J., Brown, Y. J., Carr, M. A., Czarapata, P. C., Drennan, C. C., Dombeck, T., Federwitz, G. R., Gillespie, B. A., Gonzales, C., Hansen, S. U., Harvanek, M., Hayes, J., Jordan, W., Kinney, E., Klaene, M., Kleinman, S. J., Kron, R. G., Kresinski, J., Lee, G., Limmongkol, S., Lindenmeyer, C. W., Long, D. C., Loomis, C. L., McGehee, P. M., Mantsch, P. M., Neilsen, Jr., E. H., Neswold, R. M., Newman, P. R., Nitta, A., Peoples, J. J., Pier, J. R., Prieto, P. S., Prosapio, A., Rivetta, C., Schneider, D. P., Snedden, S., & Wang, S.-i. 2006, AJ, 131, 2332
- Hansen et al. (2009) Hansen, S. M., Sheldon, E. S., Wechsler, R. H., & Koester, B. P. 2009, ApJ, 699, 1333
- Hogg et al. (2001) Hogg, D. W., Finkbeiner, D. P., Schlegel, D. J., & Gunn, J. E. 2001, AJ, 122, 2129
- Holtzman et al. (2008) Holtzman, J. A., Marriner, J., Kessler, R., Sako, M., Dilday, B., Frieman, J. A., Schneider, D. P., Bassett, B., Becker, A., Cinabro, D., DeJongh, F., Depoy, D. L., Doi, M., Garnavich, P. M., Hogan, C. J., Jha, S., Konishi, K., Lampeitl, H., Marshall, J. L., McGinnis, D., Miknaitis, G., Nichol, R. C., Prieto, J. L., Riess, A. G., Richmond, M. W., Romani, R., Smith, M., Takanashi, N., Tokita, K., van der Heyden, K., Yasuda, N., & Zheng, C. 2008, AJ, 136, 2306
- Ivezić et al. (2004) Ivezić, Ž., Lupton, R. H., Schlegel, D., Boroski, B., Adelman-McCarthy, J., Yanny, B., Kent, S., Stoughton, C., Finkbeiner, D., Padmanabhan, N., Rockosi, C. M., Gunn, J. E., Knapp, G. R., Strauss, M. A., Richards, G. T., Eisenstein, D., Nicinski, T., Kleinman, S. J., Krzesinski, J., Newman, P. R., Snedden, S., Thakar, A. R., Szalay, A., Munn, J. A., Smith, J. A., Tucker, D., & Lee, B. C. 2004, Astronomische Nachrichten, 325, 583
- Jha et al. (2007) Jha, S., Riess, A. G., & Kirshner, R. P. 2007, ApJ, 659, 122
- Johnston et al. (2007) Johnston, D. E., Sheldon, E. S., Wechsler, R. H., Rozo, E., Koester, B. P., Frieman, J. A., McKay, T. A., Evrard, A. E., Becker, M. R., & Annis, J. 2007, ArXiv e-prints, 709
- Jorgensen (1997) Jorgensen, I. 1997, MNRAS, 288, 161
- Kaviraj et al. (2007) Kaviraj, S., Schawinski, K., Devriendt, J. E. G., Ferreras, I., Khochfar, S., Yoon, S., Yi, S. K., Deharveng, J., Boselli, A., Barlow, T., Conrow, T., Forster, K., Friedman, P. G., Martin, D. C., Morrissey, P., Neff, S., Schiminovich, D., Seibert, M., Small, T., Wyder, T., Bianchi, L., Donas, J., Heckman, T., Lee, Y., Madore, B., Milliard, B., Rich, R. M., & Szalay, A. 2007, ApJS, 173, 619
- Koester et al. (2007a) Koester, B. P., McKay, T. A., Annis, J., Wechsler, R. H., Evrard, A., Bleem, L., Becker, M., Johnston, D., Sheldon, E., Nichol, R., Miller, C., Scranton, R., Bahcall, N., Barentine, J., Brewington, H., Brinkmann, J., Harvanek, M., Kleinman, S., Krzesinski, J., Long, D., Nitta, A., Schneider, D. P., Sneddin, S., Voges, W., & York, D. 2007a, ApJ, 660, 239
- Koester et al. (2007b) Koester, B. P., McKay, T. A., Annis, J., Wechsler, R. H., Evrard, A. E., Rozo, E., Bleem, L., Sheldon, E. S., & Johnston, D. 2007b, ApJ, 660, 221
- Lupton et al. (1999) Lupton, R. H., Gunn, J. E., & Szalay, A. S. 1999, AJ, 118, 1406
- Mannucci et al. (2008) Mannucci, F., Maoz, D., Sharon, K., Botticella, M. T., Della Valle, M., Gal-Yam, A., & Panagia, N. 2008, MNRAS, 383, 1121
- Mannucci (2009) Mannucci, F. 2009, in American Institute of Physics Conference Series, Vol. 1111, American Institute of Physics Conference Series, ed. G. Giobbi, A. Tornambe, G. Raimondo, M. Limongi, L. A. Antonelli, N. Menci, & E. Brocato, 467–476
- Menanteau et al. (2010) Menanteau, F., Hughes, J. P., Barrientos, L. F., Deshpande, A. J., Hilton, M., Infante, L., Jimenez, R., Kosowsky, A., Moodley, K., Spergel, D., & Verde, L. 2010, ArXiv e-prints
- Miller et al. (2005) Miller, C. J., Nichol, R. C., Reichart, D., Wechsler, R. H., Evrard, A. E., Annis, J., McKay, T. A., Bahcall, N. A., Bernardi, M., Boehringer, H., Connolly, A. J., Goto, T., Kniazev, A., Lamb, D., Postman, M., Schneider, D. P., Sheth, R. K., & Voges, W. 2005, AJ, 130, 968
- Oyaizu et al. (2008) Oyaizu, H., Lima, M., Cunha, C. E., Lin, H., & Frieman, J. 2008, ApJ, 689, 709
- Padmanabhan et al. (2004) Padmanabhan, N., Seljak, U., Strauss, M. A., Blanton, M. R., Kauffmann, G., Schlegel, D. J., Tremonti, C., Bahcall, N. A., Bernardi, M., Brinkmann, J., Fukugita, M., & Ivezić, Ž. 2004, New Astronomy, 9, 329
- Prieto et al. (2007) Prieto, J. L., Garnavich, P. M., Phillips, M. M., DePoy, D. L., Parrent, J., Pooley, D., Dwarkadas, V. V., Baron, E., Bassett, B., Becker, A., Cinabro, D., DeJongh, F., Dilday, B., Doi, M., Frieman, J. A., Hogan, C. J., Holtzman, J., Jha, S., Kessler, R., Konishi, K., Lampeitl, H., Marriner, J., Marshall, J. L., Miknaitis, G., Nichol, R. C., Riess, A. G., Richmond, M. W., Romani, R., Sako, M., Schneider, D. P., Smith, M., Takanashi, N., Tokita, K., van der Heyden, K., Yasuda, N., Zheng, C., Wheeler, J. C., Barentine, J., Dembicky, J., Eastman, J., Frank, S., Ketzeback, W., McMillan, R. J., Morrell, N., Folatelli, G., Contreras, C., Burns, C. R., Freedman, W. L., Gonzalez, S., Hamuy, M., Krzeminski, W., Madore, B. F., Murphy, D., Persson, S. E., Roth, M., & Suntzeff, N. B. 2007, astro-ph/0706.4088
- Sako et al. (2008) Sako, M., Bassett, B., Becker, A., Cinabro, D., DeJongh, F., Depoy, D. L., Dilday, B., Doi, M., Frieman, J. A., Garnavich, P. M., Hogan, C. J., Holtzman, J., Jha, S., Kessler, R., Konishi, K., Lampeitl, H., Marriner, J., Miknaitis, G., Nichol, R. C., Prieto, J. L., Riess, A. G., Richmond, M. W., Romani, R., Schneider, D. P., Smith, M., Subba Rao, M., Takanashi, N., Tokita, K., van der Heyden, K., Yasuda, N., Zheng, C., Barentine, J., Brewington, H., Choi, C., Dembicky, J., Harnavek, M., Ihara, Y., Im, M., Ketzeback, W., Kleinman, S. J., Krzesiński, J., Long, D. C., Malanushenko, E., Malanushenko, V., McMillan, R. J., Morokuma, T., Nitta, A., Pan, K., Saurage, G., & Snedden, S. A. 2008, AJ, 135, 348
- Sand et al. (2008) Sand, D. J., Zaritsky, D., Herbert-Fort, S., Sivanandam, S., & Clowe, D. 2008, AJ, 135, 1917
- Schechter et al. (1993) Schechter, P. L., Mateo, M., & Saha, A. 1993, PASP, 105, 1342
- Sharon et al. (2007a) Sharon, K., Gal-Yam, A., Maoz, D., Donahue, M., Ebeling, H., Ellis, R. S., Filippenko, A. V., Foley, R., Freedman, W. L., Kirshner, R. P., Kneib, J.-P., Matheson, T., Mulchaey, J. S., Sarajedini, V. L., & Voit, M. 2007a, in American Institute of Physics Conference Series, Vol. 924, The Multicolored Landscape of Compact Objects and Their Explosive Origins, 460–463
- Sharon et al. (2007b) Sharon, K., Gal-Yam, A., Maoz, D., Filippenko, A. V., & Guhathakurta, P. 2007b, ApJ, 660, 1165
- Sharon et al. (2009) Sharon et al., K. 2009, in preparation
- Sheldon et al. (2009a) Sheldon, E. S., Johnston, D. E., Masjedi, M., McKay, T. A., Blanton, M. R., Scranton, R., Wechsler, R. H., Koester, B. P., Hansen, S. M., Frieman, J. A., & Annis, J. 2009a, ApJ, 703, 2232
- Sheldon et al. (2009b) Sheldon, E. S., Johnston, D. E., Scranton, R., Koester, B. P., McKay, T. A., Oyaizu, H., Cunha, C., Lima, M., Lin, H., Frieman, J. A., Wechsler, R. H., Annis, J., Mandelbaum, R., Bahcall, N. A., & Fukugita, M. 2009b, ApJ, 703, 2217
- Smith et al. (2002) Smith, J. A., Tucker, D. L., Kent, S., Richmond, M. W., Fukugita, M., Ichikawa, T., Ichikawa, S.-i., Jorgensen, A. M., Uomoto, A., Gunn, J. E., Hamabe, M., Watanabe, M., Tolea, A., Henden, A., Annis, J., Pier, J. R., McKay, T. A., Brinkmann, J., Chen, B., Holtzman, J., Shimasaku, K., & York, D. G. 2002, AJ, 123, 2121
- Smith et al. (2009) Smith et al., M. 2009, in preparation
- Stoughton et al. (2002) Stoughton, C., Lupton, R. H., Bernardi, M., Blanton, M. R., Burles, S., Castander, F. J., Connolly, A. J., Eisenstein, D. J., Frieman, J. A., Hennessy, G. S., Hindsley, R. B., Ivezić, Ž., Kent, S., Kunszt, P. Z., Lee, B. C., Meiksin, A., Munn, J. A., Newberg, H. J., Nichol, R. C., Nicinski, T., Pier, J. R., Richards, G. T., Richmond, M. W., Schlegel, D. J., Smith, J. A., Strauss, M. A., SubbaRao, M., Szalay, A. S., Thakar, A. R., Tucker, D. L., Vanden Berk, D. E., Yanny, B., Adelman, J. K., Anderson, Jr., J. E., Anderson, S. F., Annis, J., Bahcall, N. A., Bakken, J. A., Bartelmann, M., Bastian, S., Bauer, A., Berman, E., Böhringer, H., Boroski, W. N., Bracker, S., Briegel, C., Briggs, J. W., Brinkmann, J., Brunner, R., Carey, L., Carr, M. A., Chen, B., Christian, D., Colestock, P. L., Crocker, J. H., Csabai, I., Czarapata, P. C., Dalcanton, J., Davidsen, A. F., Davis, J. E., Dehnen, W., Dodelson, S., Doi, M., Dombeck, T., Donahue, M., Ellman, N., Elms, B. R., Evans, M. L., Eyer, L., Fan, X., Federwitz, G. R., Friedman, S., Fukugita, M., Gal, R., Gillespie, B., Glazebrook, K., Gray, J., Grebel, E. K., Greenawalt, B., Greene, G., Gunn, J. E., de Haas, E., Haiman, Z., Haldeman, M., Hall, P. B., Hamabe, M., Hansen, B., Harris, F. H., Harris, H., Harvanek, M., Hawley, S. L., Hayes, J. J. E., Heckman, T. M., Helmi, A., Henden, A., Hogan, C. J., Hogg, D. W., Holmgren, D. J., Holtzman, J., Huang, C.-H., Hull, C., Ichikawa, S.-I., Ichikawa, T., Johnston, D. E., Kauffmann, G., Kim, R. S. J., Kimball, T., Kinney, E., Klaene, M., Kleinman, S. J., Klypin, A., Knapp, G. R., Korienek, J., Krolik, J., Kron, R. G., Krzesiński, J., Lamb, D. Q., Leger, R. F., Limmongkol, S., Lindenmeyer, C., Long, D. C., Loomis, C., Loveday, J., MacKinnon, B., Mannery, E. J., Mantsch, P. M., Margon, B., McGehee, P., McKay, T. A., McLean, B., Menou, K., Merelli, A., Mo, H. J., Monet, D. G., Nakamura, O., Narayanan, V. K., Nash, T., Neilsen, Jr., E. H., Newman, P. R., Nitta, A., Odenkirchen, M., Okada, N., Okamura, S., Ostriker, J. P., Owen, R., Pauls, A. G., Peoples, J., Peterson, R. S., Petravick, D., Pope, A., Pordes, R., Postman, M., Prosapio, A., Quinn, T. R., Rechenmacher, R., Rivetta, C. H., Rix, H.-W., Rockosi, C. M., Rosner, R., Ruthmansdorfer, K., Sandford, D., Schneider, D. P., Scranton, R., Sekiguchi, M., Sergey, G., Sheth, R., Shimasaku, K., Smee, S., Snedden, S. A., Stebbins, A., Stubbs, C., Szapudi, I., Szkody, P., Szokoly, G. P., Tabachnik, S., Tsvetanov, Z., Uomoto, A., Vogeley, M. S., Voges, W., Waddell, P., Walterbos, R., Wang, S.-i., Watanabe, M., Weinberg, D. H., White, R. L., White, S. D. M., Wilhite, B., Wolfe, D., Yasuda, N., York, D. G., Zehavi, I., & Zheng, W. 2002, AJ, 123, 485
- Strateva et al. (2001) Strateva, I., Ivezić, Ž., Knapp, G. R., Narayanan, V. K., Strauss, M. A., Gunn, J. E., Lupton, R. H., Schlegel, D., Bahcall, N. A., Brinkmann, J., Brunner, R. J., Budavári, T., Csabai, I., Castander, F. J., Doi, M., Fukugita, M., Győry, Z., Hamabe, M., Hennessy, G., Ichikawa, T., Kunszt, P. Z., Lamb, D. Q., McKay, T. A., Okamura, S., Racusin, J., Sekiguchi, M., Schneider, D. P., Shimasaku, K., & York, D. 2001, AJ, 122, 1861
- Strauss et al. (2002) Strauss, M. A., Weinberg, D. H., Lupton, R. H., Narayanan, V. K., Annis, J., Bernardi, M., Blanton, M., Burles, S., Connolly, A. J., Dalcanton, J., Doi, M., Eisenstein, D., Frieman, J. A., Fukugita, M., Gunn, J. E., Ivezić, Ž., Kent, S., Kim, R. S. J., Knapp, G. R., Kron, R. G., Munn, J. A., Newberg, H. J., Nichol, R. C., Okamura, S., Quinn, T. R., Richmond, M. W., Schlegel, D. J., Shimasaku, K., SubbaRao, M., Szalay, A. S., Vanden Berk, D., Vogeley, M. S., Yanny, B., Yasuda, N., York, D. G., & Zehavi, I. 2002, AJ, 124, 1810
- Sullivan et al. (2006) Sullivan, M., Le Borgne, D., Pritchet, C. J., Hodsman, A., Neill, J. D., Howell, D. A., Carlberg, R. G., Astier, P., Aubourg, E., Balam, D., Basa, S., Conley, A., Fabbro, S., Fouchez, D., Guy, J., Hook, I., Pain, R., Palanque-Delabrouille, N., Perrett, K., Regnault, N., Rich, J., Taillet, R., Baumont, S., Bronder, J., Ellis, R. S., Filiol, M., Lusset, V., Perlmutter, S., Ripoche, P., & Tao, C. 2006, ApJ, 648, 868
- Tucker et al. (2006) Tucker, D. L., Kent, S., Richmond, M. W., Annis, J., Smith, J. A., Allam, S. S., Rodgers, C. T., Stute, J. L., Adelman-McCarthy, J. K., Brinkmann, J., Doi, M., Finkbeiner, D., Fukugita, M., Goldston, J., Greenway, B., Gunn, J. E., Hendry, J. S., Hogg, D. W., Ichikawa, S.-I., Ivezić, Ž., Knapp, G. R., Lampeitl, H., Lee, B. C., Lin, H., McKay, T. A., Merrelli, A., Munn, J. A., Neilsen, Jr., E. H., Newberg, H. J., Richards, G. T., Schlegel, D. J., Stoughton, C., Uomoto, A., & Yanny, B. 2006, Astronomische Nachrichten, 327, 821
- York et al. (2000) York, D. G., Adelman, J., Anderson, Jr., J. E., Anderson, S. F., Annis, J., Bahcall, N. A., Bakken, J. A., Barkhouser, R., Bastian, S., Berman, E., Boroski, W. N., Bracker, S., Briegel, C., Briggs, J. W., Brinkmann, J., Brunner, R., Burles, S., Carey, L., Carr, M. A., Castander, F. J., Chen, B., Colestock, P. L., Connolly, A. J., Crocker, J. H., Csabai, I., Czarapata, P. C., Davis, J. E., Doi, M., Dombeck, T., Eisenstein, D., Ellman, N., Elms, B. R., Evans, M. L., Fan, X., Federwitz, G. R., Fiscelli, L., Friedman, S., Frieman, J. A., Fukugita, M., Gillespie, B., Gunn, J. E., Gurbani, V. K., de Haas, E., Haldeman, M., Harris, F. H., Hayes, J., Heckman, T. M., Hennessy, G. S., Hindsley, R. B., Holm, S., Holmgren, D. J., Huang, C.-h., Hull, C., Husby, D., Ichikawa, S.-I., Ichikawa, T., Ivezić, Ž., Kent, S., Kim, R. S. J., Kinney, E., Klaene, M., Kleinman, A. N., Kleinman, S., Knapp, G. R., Korienek, J., Kron, R. G., Kunszt, P. Z., Lamb, D. Q., Lee, B., Leger, R. F., Limmongkol, S., Lindenmeyer, C., Long, D. C., Loomis, C., Loveday, J., Lucinio, R., Lupton, R. H., MacKinnon, B., Mannery, E. J., Mantsch, P. M., Margon, B., McGehee, P., McKay, T. A., Meiksin, A., Merelli, A., Monet, D. G., Munn, J. A., Narayanan, V. K., Nash, T., Neilsen, E., Neswold, R., Newberg, H. J., Nichol, R. C., Nicinski, T., Nonino, M., Okada, N., Okamura, S., Ostriker, J. P., Owen, R., Pauls, A. G., Peoples, J., Peterson, R. L., Petravick, D., Pier, J. R., Pope, A., Pordes, R., Prosapio, A., Rechenmacher, R., Quinn, T. R., Richards, G. T., Richmond, M. W., Rivetta, C. H., Rockosi, C. M., Ruthmansdorfer, K., Sandford, D., Schlegel, D. J., Schneider, D. P., Sekiguchi, M., Sergey, G., Shimasaku, K., Siegmund, W. A., Smee, S., Smith, J. A., Snedden, S., Stone, R., Stoughton, C., Strauss, M. A., Stubbs, C., SubbaRao, M., Szalay, A. S., Szapudi, I., Szokoly, G. P., Thakar, A. R., Tremonti, C., Tucker, D. L., Uomoto, A., Vanden Berk, D., Vogeley, M. S., Waddell, P., Wang, S.-i., Watanabe, M., Weinberg, D. H., Yanny, B., & Yasuda, N. 2000, AJ, 120, 1579
- Zheng et al. (2008) Zheng, C., Romani, R. W., Sako, M., Marriner, J., Bassett, B., Becker, A., Choi, C., Cinabro, D., DeJongh, F., Depoy, D. L., Dilday, B., Doi, M., Frieman, J. A., Garnavich, P. M., Hogan, C. J., Holtzman, J., Im, M., Jha, S., Kessler, R., Konishi, K., Lampeitl, H., Marshall, J. L., McGinnis, D., Miknaitis, G., Nichol, R. C., Prieto, J. L., Riess, A. G., Richmond, M. W., Schneider, D. P., Smith, M., Takanashi, N., Tokita, K., van der Heyden, K., Yasuda, N., Assef, R. J., Barentine, J., Bender, R., Blandford, R. D., Bremer, M., Brewington, H., Collins, C. A., Crotts, A., Dembicky, J., Eastman, J., Edge, A., Elson, E., Eyler, M. E., Filippenko, A. V., Foley, R. J., Frank, S., Goobar, A., Harvanek, M., Hopp, U., Ihara, Y., Kahn, S., Ketzeback, W., Kleinman, S. J., Kollatschny, W., Krzesiński, J., Leloudas, G., Long, D. C., Lucey, J., Malanushenko, E., Malanushenko, V., McMillan, R. J., Morgan, C. W., Morokuma, T., Nitta, A., Ostman, L., Pan, K., Romer, A. K., Saurage, G., Schlesinger, K., Snedden, S. A., Sollerman, J., Stritzinger, M., Watson, L. C., Watters, S., Wheeler, J. C., & York, D. 2008, AJ, 135, 1766