The Mid-Infrared Luminosities of Normal Galaxies over Cosmic Time
Abstract
Modern population synthesis models estimate that 50% of the restframe -band light is produced by TP-AGB stars during the first Gyr of a stellar population, with a substantial fraction continuing to be produced by the TP-AGB over a Hubble time. Between 0.2 and 1.5 Gyr, intermediate mass stars evolve into TP-AGB C stars which, due to significant amounts of circumstellar dust, emit half their energy in the mid-IR. We combine these results using published mid-IR colors of Galactic TP-AGB M and C stars to construct simple models for exploring the contribution of the TP-AGB to 24m data as a function of stellar population age. We compare these empirical models with an ensemble of galaxies in the CDFS from to , and with high quality imaging in M81. Within the uncertainties, the TP-AGB appears responsible for a substantial fraction of the mid-IR luminosities of galaxies from to , the maximum redshift to which we can test our hypothesis, while, at the same time, our models reproduce much of the detailed structure observed in mid-IR imaging of M81. The mid-IR is a good diagnostic of star formation over timescales of Gyr, but this implies that on-going star formation rates at may be overestimated by factors of , depending on the nature of star formation events. Our results, if confirmed through subsequent work, have strong implications for the star formation rate density of the universe and the growth of stellar mass over time.
Subject headings:
galaxies: evolution — galaxies: high-redshift — galaxies: stellar content — infrared: galaxies1. Introduction
The infrared provides a critical window into obscured star formation in our Galaxy and in nearby galaxies (e.g. Helou et al., 1988, and many since), allowing us to peer into a range of star forming environments at the present epoch (e.g. Roussel et al., 2001; Calzetti et al., 2007). Space-based IR observations have improved and extended our views to greater distances and large lookback times (e.g. Salim et al., 2009), making these wavelengths crucial for studies of galaxy structure (see, e.g., Regan et al., 2004) and evolution (e.g. Papovich et al., 2007). The m data, in particular, provided the first of what were to be unbiased histories of the star formation rate density of the universe over time (Le Floc’h et al., 2005).
Such analyses utilize template SEDs in order to estimate IR bolometric corrections (e.g. Chary & Elbaz, 2001; Dale & Helou, 2002; Rieke et al., 2009). These, in turn, are used with empirical calibrations of on-going SFRs derived from nearby galaxies under the assumption that the mid-IR flux arises from the reprocessed light from young, luminous stars. However, these circumstances are not well understood, partly because of the different physical mechanisms and timescales probed by the IR compared to recombination lines or UV emission (e.g. Kennicutt, 1998; Salim et al., 2009).
Here we recognize that when intermediate mass stars join the Thermally-Pulsating Asymptotic Giant Branch (TP-AGB), they do not uniformly have the colors of lower-mass TP-AGB M stars but, as C stars, are particularly luminous in the mid-IR, with most of their energy emitted between 20 and 45m (e.g. Guandalini et al., 2006). Knowing the importance of the TP-AGB at red and near-IR wavelengths (Maraston, 2005; Bruzual, 2009; Conroy et al., 2009), and, using near- to mid-IR colors of Galactic TP-AGB populations, we empirically calibrate the contributions of such stars to the integrated mid-IR luminosities of stellar populations. Using simple models, we show that the mid-IR luminosities of galaxies are specifically in the sensitivity of the mid-IR to the amount of stellar mass formed in the previous 1.5 Gyr, naturally complimenting the optical and near-UV.
2. Observed Properties of the TP-AGB
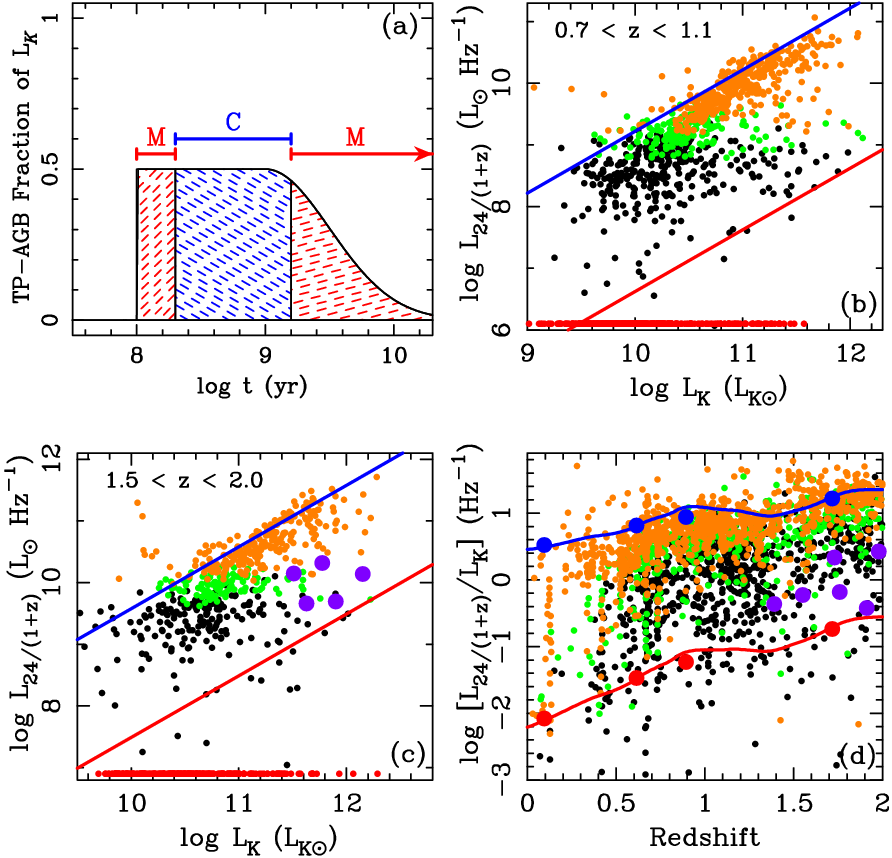
Our calculations explicitly rely on the fraction of -band light produced by the TP-AGB as a function of the age of a simple stellar population (SSP). Figure 13 of Maraston (2005) and Figure 1 of Bruzual (2009) show the TP-AGB’s contribution to the -band as a function of time, here approximated in our Figure 1(a). Between 0.1 and 1.5 Gyrs, the TP-AGB is responsible for roughly half the luminosity at . At solar metallicity, and between 0.2 and 1.5 Gyrs, stars have sufficient mass to become C stars (Marigo & Girardi, 2007; Marigo et al., 2008). At earlier times hot bottom burning prevents stars from inverting C/O ratios (e.g. Marigo & Girardi, 2007). Lower mass stars that contribute to the -band over a Hubble time also remain O-rich. Consequently, most assume the TP-AGB to have the color of M stars (e.g. Willner et al., 2004).
Knowing how the luminosity of the TP-AGB evolves at allows one to compute the integrated mid-IR luminosity if the near- to mid-IR color for the ensemble of stars on the TP-AGB is known as a function of time. There now exist sufficient data in the literature for Galactic TP-AGB stars to constrain such colors, and we adopt the mid-IR bands [8.8], [12.5], [14.6], and [21.3] from the work of Guandalini et al. (2006) and Guandalini & Busso (2008).
Using Galactic TP-AGB C stars from Guandalini et al. (2006) and Busso et al. (2007), and conservatively excluding stars redder than mag to reduce any bias towards IR-luminous post-AGB objects, we compute mean colors for the population of dust-enshrouded Galactic TP-AGB C stars of mag for the four bandpasses, respectively (Vega magnitudes; zeropoints from Guandalini et al., 2006). We do not claim that all stars with sufficient mass have these colors upon joining the TP-AGB, but that they are dusty and IR luminous, such that when averaged over timescales longer than the TP-AGB lifetimes ( yrs; e.g. Marigo & Girardi, 2007) this color is a good approximation for the ensemble. Using Guandalini & Busso (2008), we compute ensemble colors of mag for TP-AGB M stars.
Formal errors in these colors are smaller than the systematic uncertainties, which have been listed above. These were computed by varying the color bounds of the TP-AGB and by using several different estimators. These uncertainties dominate the errors in subsequent modeling. TP-AGB ensemble colors are critical, and use of the Galactic samples assumes that these stars adequately sample the phases of TP-AGB evolution.
We now combine Figure 1(a) with the knowledge that the C star ensemble color should be used for SSP ages within Gyr, and the M ensemble color for all other ages. Whether stars have sufficient mass to become C stars depends on mass-loss and the efficiency of dredge-up, both of which are sensitive to metallicity (Marigo & Girardi, 2007). For the purposes of making initial estimates of the contribution of the TP-AGB in the mid-IR, we ignore these important effects.
3. Implications for Galaxies
The colors given in the previous section imply that for ages less than 1.5 Gyr, the TP-AGB emits more than twice as much energy in the [12.5] band as it does in . In other words, a young galaxy at with a should have a luminosity of , equivalent to a LIRG with (Chary & Elbaz, 2001).
Figures 1(b) and (c) illustrate this key point at redshifts where the MIPS m band corresponds to [12.5] and [8.8]. When stellar populations are producing TP-AGB C stars and their fraction of -band light is 50%, one expects the maximum output in the mid-IR relative to , shown by the blue line. Very young stars ( Myr) and those older than 1.5 Gyr will produce only TP-AGB M stars, delineating the minimum output in the mid-IR relative to , shown by the red line. These predictions are compared to galaxies in CDFS (Wuyts et al., 2008) and the HUDF (Maraston et al., 2006, 2007), where restframe magnitudes were derived by interpolating the published photometry. In Figure 1(d) we expand these simple comparisons to the redshift range to .
It is striking that the circumstellar material of evolved stars alone, up to 1.5 Gyr old, can explain the observed mid-IR luminosities of galaxies back to . For galaxies near the lower bound, a substantial fraction of their m fluxes may originate purely from old stars, even at early times, where the actual fractions will depend on more precise modeling. This conclusion is fully consistent with earlier work by Maraston et al. (2006), whose modeling of passively evolving galaxies in the HUDF (see Fig. 1) at highlighted contributions of the TP-AGB at restframe near-IR wavelengths. Using the [8.8]-[21.3] colors of the TP-AGB ensembles derived above, these galaxies should have modest detections of Jy in future observations at 60m.
In the next section we construct simple star-formation histories to study the observed correlations of the mid-IR with restframe optical bands. By doing so we can check our hypothesis against the well-observed evolution of the global properties of galaxies. More sophisticated efforts to incorporate the TP-AGB into population synthesis have a number of unsolved issues (Conroy et al., 2009) and physically motivated models Marigo et al. (2008) do not yet adequately match the broad range of observed mid-IR colors of TP-AGB C stars (Guandalini et al., 2006). Therefore we explore the mid-IR luminosities of stellar populations as a function of redshift using our empirical calibration of the mid-IR luminosity of the TP-AGB.
4. Simple Formation Histories and the Mid-IR
The ensemble colors of TP-AGB stars have been shown to describe the range of mid-IR luminosities of normal galaxies back to . We now use model star formation histories (SFHs) to compare the evolution of stellar populations in the mid-IR with the evolution of galaxy colors. We use the Maraston (2005) models, the Kroupa (2001) IMF, solar metallicity, a TP-AGB -band luminosity fraction that evolves as in Figure 1, and the mid-IR C and M ensemble colors given above. No dust components outside of those implicit in the colors of the Galactic TP-AGB stars have been added.
Several SFHs have been constructed, with parameters given in Table 1. We use exponentially declining SFHs, or -models, modified by having each model begin at , with an exponential rise of 1 Gyr until a peak at redshift . The models explicitly terminate timescales after . The models have been normalized to stellar masses ranging from and at . Parameters were chosen to produce colors consistent with a diversity of blue and red galaxies at the present epoch.
| Type | |||||
|---|---|---|---|---|---|
| Red | 5 | 4.0 | 3 | ||
| Red | 5 | 2.0 | 2 | ||
| Red | 5 | 2.0 | |||
| Red | 5 | 1.5 | |||
| Red | 5 | 4.0 | 3 | ||
| Red | 5 | 4.5 | 2 | ||
| Blue | 5 | 1.8 | |||
| Blue | 5 | 1.5 | |||
| Blue | 5 | 2.5 | |||
| Blue | 5 | 2.5 | |||
| Blue | 5 | 1.2 | |||
| Blue | 5 | 0.8 |
4.1. Galaxy Colors at
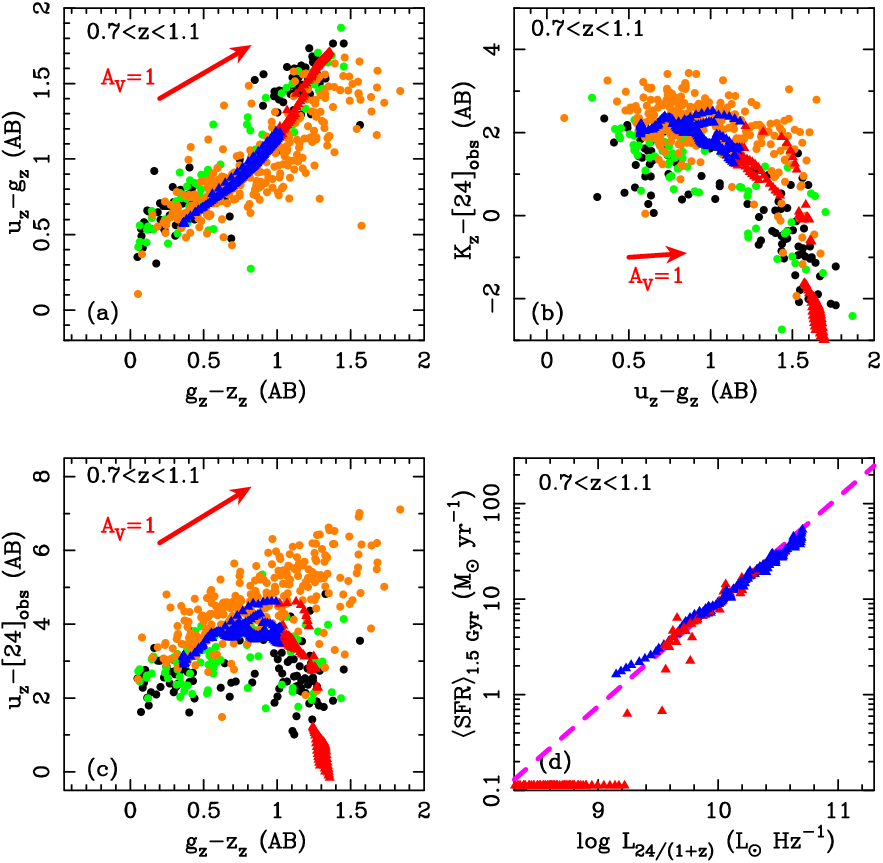
In Figures 2(a-c) we compare the colors of the models to the galaxies in CDFS between (Wuyts et al., 2008) using the bicolor diagrams vs , vs , and vs , ( denote redshifted passbands). Blue triangles indicate times when , and red triangles when , where SFR refers to on-going star formation rates. The extinction of starlight by (Calzetti et al., 2000) is shown by the red arrow. With no additional tuning, these SFHs mimic both the blue star forming sequence and the red quiescent sequence, while simultaneously reproducing the correlations of m emission with optical colors.
Figure 2(d) shows that the simple models reproduce the correlation between m luminosity and SFRs of Chary & Elbaz (2001), but only when we average the SFR over the 1.5 Gyr prior to the epoch(s) of observation. Chary & Elbaz (2001), and others, have calibrated the underlying SFR as a function of mid-IR luminosity and, though our models reproduce this correlation, the timescale probed by this relation is much longer than has been assumed in the past. In other words, the mid-IR is explicitly sensitive to star formation over the timescales that galaxies produce populations of TP-AGB C stars, or 1.5 Gyr (confirming the earlier results of Salim et al., 2009).
Together these results also imply that the relationship between rates of on-going star formation and mid-IR fluxes will be complicated by the detailed SFHs within a 1.5 Gyr windows. Bursts that occur at and decay with Gyr, still produce substantial mid-IR fluxes at , resulting in estimated SFRs higher than actual on-going rates. For Gyr, the factor is . Using the Gyr exponential timescale for the decline of the star formation rate density of the universe at late times implies that the mid-IR is an over-estimate by at least 50%. Taken a step further, post-starburst and “green valley” galaxies may simply be luminous in the mid-IR because TP-AGB C stars continue to appear long after the cessation of major star formation activity.
Calculating the impact on the star formation rate density ultimately requires knowing the frequency, duration, and intensity of major mass building events. Given the unknown duty cycles of major star forming events, mid-IR-based star formation rates of individual galaxies at should be treated with skepticism at a level of at least a factor of two, with additional uncertainties in star formation rate densities.
4.2. Normal galaxies at Late Times: M81
Our models have strong implications for the origins of mid-IR emission in nearby, resolved systems. Here we compare data on the nearby galaxy M81 with our model’s implied correlations of the mid-IR with (1) luminosity at , and (2) the relative amount of star formation in the previous 1.5 Gyr of evolution.
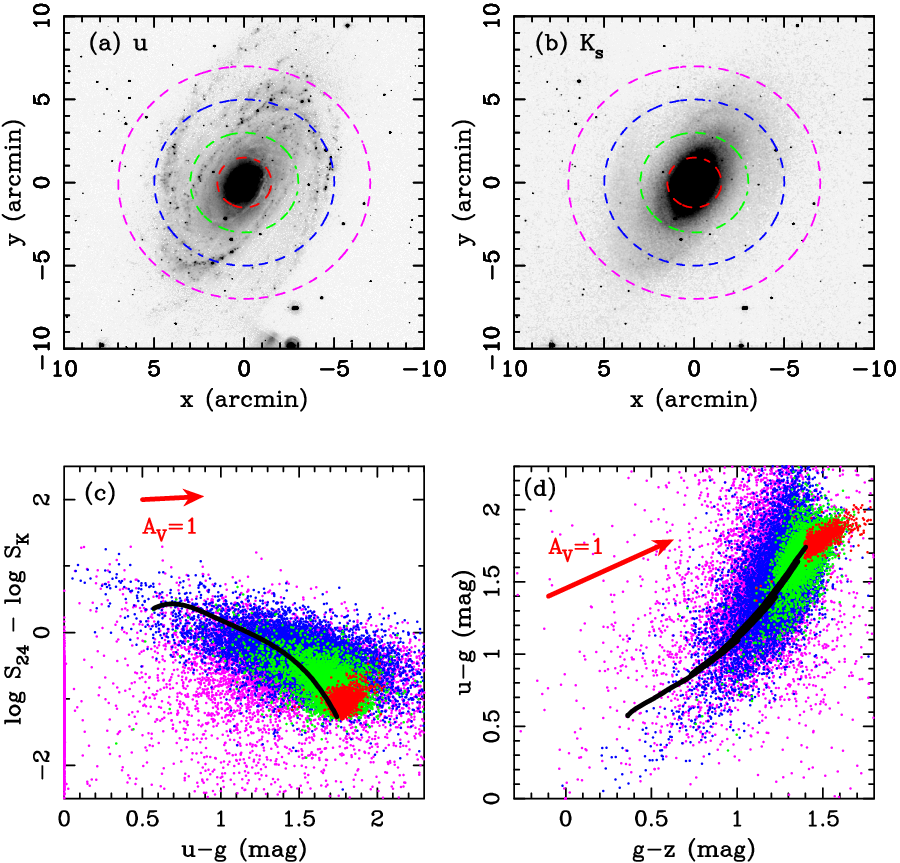
SDSS and 2MASS images are shown in Figures 3(a) and (b). Binning these to increase the ratios per data point, we show color-color diagrams for points in the galaxy down to mag per arcsec2 in (c) and (d). Our smooth SFHs at late times are shown by the thick black lines. Colors indicate galaxy radius: min (red), min (green), min (blue), and min (violet). For simplicity, we assume points only fall redward of these models in vs because of extinction and thus derive a map of across M81. These extinctions allow us to correct and infer the ratio at each position in the galaxy using Fig. 3(c).
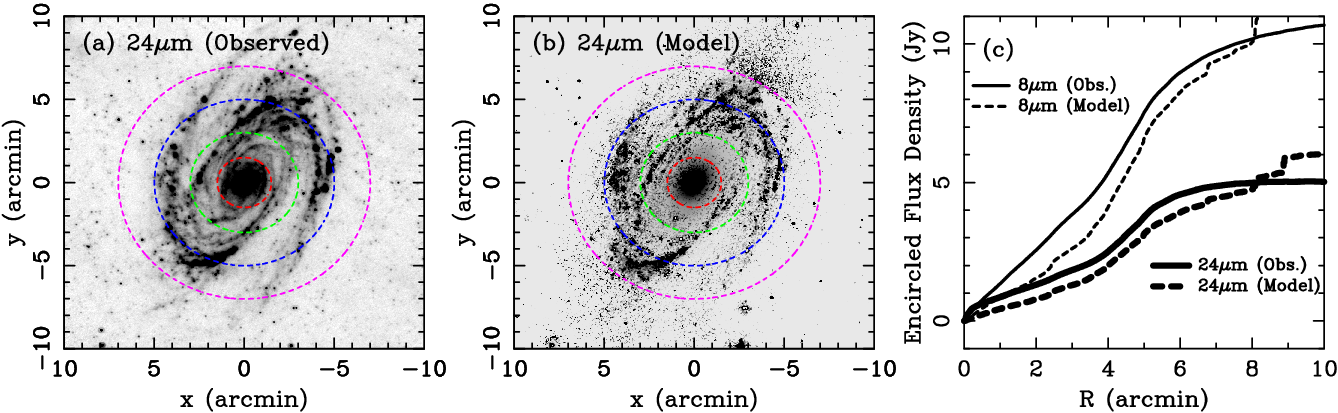
We show the observed m map along with the resulting model in Figures 4(a) and 4(b). Aside from the limiting of the and data, the agreement is good. We also find similar results in m but have not included them owing to space considerations. In Fig. 4(c) we show the encircled flux densities in both m and m, and one can directly see that the luminosity and structure of M81 is consistent with TP-AGB origins. Within arcmin, the simple model is missing of the flux, but given uncertainties in using color as a proxy for age, uncertain extinction corrections, and unaccounted metallicity effects, we cannot rule out additional contributions from interstellar cirrus. In regions of intense star formation, which are known to be dust enshrouded, the model also underproduces the mid-IR fluxes, but such regions do not comprise the bulk of M81’s luminosity.
We conclude that the extended, diffuse mid-IR emission noted by Kennicutt et al. (2009) arises from the stellar populations of the galaxy. This result is consistent with the analysis of M33 by Verley et al. (2009), who employed a more limited set of models and argued that dusty circumstellar envelopes of evolved AGB stars may be the source of the bulk of M33’s diffuse 8m and 24m emission.
5. Summary
The contribution of the TP-AGB to the -band has been combined with with the mean IR colors of Galactic TP-AGB C and M stars in order to estimate the contributions of both young and old stellar populations to mid-IR observations of galaxies. Without tuning, we find that the resulting mid-IR luminosities of the TP-AGB can reproduce the MIPS m fluxes for galaxies back to at least in a manner consistent with restframe optical colors. We have also tested the validity of the model on local scales in the galaxy M81 and find reasonable agreement. The origins of correlations between optical colors and mid-IR luminosities seen by others, such as Salim et al. (2009), can now be understood.
With careful modeling of SEDs from the UV through the mid-IR, more detailed histories of star formation should be possible. Unfortunately, stellar spectral libraries and theoretical modeling are neither sufficient for verifying nor reducing the uncertainties our models (Conroy et al., 2009). This is largely due to the great difficulty in modeling post-main-sequence evolution, including the envelopes of TP-AGB stars, though the UV may provide further constraints (Buzzoni & González-Lópezlira, 2008). We are optimistic that improved characterization of the mid-IR colors of the TP-AGB can be incorporated into SED fitting, though our calculations have uncertainties perhaps on the order of a factor of two due to uncertainties in the ensemble colors of the TP-AGB populations at different ages. With refinement we anticipate that incorporating the mid-IR into multiwavelength analysis of SEDs will provide the strongest constraints on the star formation histories of galaxies.
There is little doubt that star formation and the growth of stellar mass was occurring more rapidly in the distant universe than today, but the nature of that growth has remained largely unknown. Earlier results (e.g. Le Floc’h et al., 2005) had implied that of the stellar mass at the present epoch was formed after — a result that appears to be at odds with the evolution in the stellar mass function to (e.g. Cirasuolo et al., 2007). But the model presented here implies that the mid-IR provides the total mass in stars formed in windows stretching back 1.5 Gyr in cosmic time. As a result, such observations must be used with care when constraining the star formation rate density of the universe at , or when considering whether variations in the initial mass function are warranted by the data (e.g. Davé, 2008; Wilkins et al., 2008).
The detection of galaxies in the mid-infrared over most of a Hubble time has helped change our view of galaxy assembly, and the determination of star formation rates associated with that assembly has remained a difficult task (see Chary & Elbaz, 2001; Calzetti et al., 2007; Salim et al., 2009; Rieke et al., 2009). Perhaps the most important implication of this Letter is that modeling the TP-AGB has allowed us to derive the relationship between mid-IR luminosities and star formation rates from “first principles” for the first time. With such models, it should now be possible to more accurately constrain the detailed history of star formation in the universe back to early times.
References
- Bressan et al. (2006) Bressan, A., et al. 2006, ApJ, 639, L55
- Bruzual (2009) Bruzual, G. 2009, Revista Mexicana de Astronomia y Astrofisica Conference Series, 35, 154
- Busso et al. (2007) Busso, M. et al. 2007, AJ, 133, 2310
- Buzzoni & González-Lópezlira (2008) Buzzoni, A., & González-Lópezlira, R. A. 2008, ApJ, 686, 1007
- Calzetti et al. (2000) Calzetti, D. et al., 2000 ApJ, 533, 682
- Calzetti et al. (2007) Calzetti, D. et al., 2007, ApJ, 666, 870-89
- Cerrigone et al. (2009) Cerrigone, L., Hora, J. L., Umana, G., & Trigilio, C. 2009, ApJ, 703, 585
- Chary & Elbaz (2001) Chary, R., & Elbaz, D., 2001, ApJ, 556, 562
- Cirasuolo et al. (2007) Cirasuolo, M., et al. 2007, MNRAS, 380, 585
- Conroy et al. (2009) Conroy, C., Gunn, J. E., & White, M. 2009, ApJ, 699, 486
- Dale & Helou (2002) Dale, D. A., & Helou, G. 2002, ApJ, 576, 159
- Davé (2008) Davé, R. 2008, MNRAS, 385, 147
- de Zeeuw et al. (2002) de Zeeuw, P. T., et al. 2002, MNRAS, 329, 513
- Dressler & Gunn (1983) Dressler, A., & Gunn, J. E. 1983, ApJ, 270, 7
- Galliano et al. (2008) Galliano, F., Dwek, E., & Chanial, P. 2008, ApJ, 672, 214
- Guandalini & Busso (2008) Guandalini, R., & Busso, M. 2008, A&A, 488, 675
- Guandalini et al. (2006) Guandalini, R., Busso, M., Ciprini, S., Silvestro, G., & Persi, P. 2006, A&A, 445, 1069
- Helou et al. (1988) Helou, G., Khan, I.R., Malek, L., and Boehmer, L., 1988, ApJS, 68, 151
- Kennicutt (1998) Kennicutt, R. C., Jr. 1998, ARA&A, 36, 189
- Kennicutt et al. (2009) Kennicutt, R. C., et al. 2009, ApJ, 703, 1672
- Kroupa (2001) Kroupa, P. 2001, MNRAS, 322, 231
- Le Floc’h et al. (2005) Le Floc’h, E., et al. 2005, ApJ, 632, 169
- Maraston (2005) Maraston, C. 2005, MNRAS, 362, 799
- Maraston et al. (2006) Maraston, C., Daddi, E., Renzini, A., Cimatti, A., Dickinson, M., Papovich, C., Pasquali, A., & Pirzkal, N. 2006, ApJ, 652, 85
- Maraston et al. (2007) Maraston, C., Daddi, E., Renzini, A., Cimatti, A., Dickinson, M., Papovich, C., Pasquali, A., & Pirzkal, N. 2007, ApJ, 656, 1241
- Marcillac et al. (2006) Marcillac, D., Elbaz, D., Chary, R. R., Dickinson, M., Galliano, F., & Morrison, G. 2006, A&A, 451, 57
- Marigo & Girardi (2007) Marigo, P., & Girardi, L. 2007, A&A, 469, 239
- Marigo et al. (2008) Marigo, P., Girardi, L., Bressan, A., Groenewegen, M. A. T., Silva, L., & Granato2, G. L. 2008, A&A, 482, 833
- Papovich et al. (2007) Papovich, C., et al. 2007, ApJ, 668, 45
- Regan et al. (2004) Regan, M. W., et al. 2004, ApJS, 154, 204
- Rieke et al. (2009) Rieke, G.H., et al., 2009, ApJ, 692, 556
- Roussel et al. (2001) Roussel, H., Sauvage, M., Vigroux, L., & Bosma, A., 2001, A&A, 372, 427
- Salim et al. (2009) Salim, S., et al., 2009, ApJ, 700, 161
- Smith et al. (2007) Smith, J. D. T., et al. 2007, ApJ, 656, 770
- Temi et al. (2005) Temi, P., Brighenti, F., & Mathews, W. G. 2005, ApJ, 635, L25
- Temi et al. (2009) Temi, P., Brighenti, F., & Mathews, W. G. 2009, ApJ, 695, 1
- van der Wel et al. (2006) van der Wel, A., Franx, M., Wuyts, S., van Dokkum, P. G., Huang, J., Rix, H.-W., & Illingworth, G. D. 2006, ApJ, 652, 97
- Verley et al. (2009) Verley, S., Corbelli, E., Giovanardi, C., & Hunt, L. K. 2009, A&A, 493, 453
- Wuyts et al. (2008) Wuyts, S., Labbé, I., Schreiber, N. M. F., Franx, M., Rudnick, G., Brammer, G. B., & van Dokkum, P. G. 2008, ApJ, 682, 985
- Wilkins et al. (2008) Wilkins, S. M., Hopkins, A. M., Trentham, N., & Tojeiro, R. 2008, MNRAS, 391, 363
- Willner et al. (2004) Willner, S. P., et al. 2004, ApJS, 154, 222