The binary fraction and mass-ratio of Be and B stars: a comparative VLT/NACO study††thanks: Based on observations collected at the European Southern Observatory (ESO), Paranal, Chile under programme ID 075.C-0475(A).
Abstract
In order to understand the formation mechanism of the disks around Be stars it is imperative to have a good overview of both the differences and similarities between normal B stars and the Be stars. In this paper we address binarity of the stars. In particular, we investigate a previous report that there may be a large population of sub-arcsecond companions to Be stars. These had hitherto not been detected due to a combination of a limited dynamic range and spatial resolution in previous studies. We present the first systematic, comparative imaging study of the binary properties of matched samples of B and Be stars observed using the same equipment. We obtained high angular resolution (0.07-0.1 arcsec) K band Adaptive Optics data of 40 B stars and 39 Be stars. The separations that can be probed range from 0.1 to 8 arcsec (corresponding to 20-1000 AU), and magnitude differences up to 10 magnitudes can in principle be covered. After excluding a few visual binaries that are located in regions of high stellar density, we detect 11 binaries out of 37 Be targets (corresponding to a binary fraction of 30 8 %) and 10 binaries out of 36 B targets (29 8%). Further tests demonstrate that the B and Be binary systems are not only similar in frequency but also remarkably similar in terms of binary separations, flux differences and mass ratios. The minimum physical separations probed in this study are of order 20 AU, which, combined with the similar binary fractions, indicates that any hypotheses invoking binary companions as responsible for the formation of a disk need the companions to be closer than 20 AU. Close companions are known to affect the circumstellar disks of Be stars, but as not all Be stars have been found to be close binaries, the data suggest that binarity can not be responsible for the Be phenomenon in all Be stars. Finally, the similarities of the binary parameters themselves also shed light on the Be formation mechanism. They strongly suggest that the initial conditions that gave rise to B and Be star formation must, to all intents and purposes, be similar. This in turn indicates that the Be phenomenon is not the result of a different star formation mechanism.
keywords:
techniques: high angular resolution - stars: binaries - stars: emission line, Be - stars: statistics| the B stars | the Be stars | ||||||||||
|---|---|---|---|---|---|---|---|---|---|---|---|
| HR | RA | Dec | V | BV | SpType | HR | RA | Dec | V | BV | SpType |
| 1619 | 05 02 00.0 | +01 36 32 | 6.24 | -0.04 | B8V | 1508 | 04 44 05.3 | -08 30 13 | 5.90 | -0.11 | B2Ve |
| 1753 | 05 19 17.5 | -18 31 12 | 6.36 | -0.16 | B3V | 1956 | 05 39 38.9 | -34 04 27 | 2.64 | -0.12 | B7IVe |
| 1855 | 05 31 55.8 | -07 18 05 | 4.62 | -0.26 | B0V | 2142 | 06 04 13.5 | -06 42 33 | 5.21 | -0.06 | B2Ven |
| 1892 | 05 35 23.2 | -04 50 18 | 4.59 | -0.19 | B1V | 2170 | 06 07 03.7 | -34 18 43 | 5.83 | -0.13 | B4IVe |
| 2056 | 05 53 06.9 | -33 48 05 | 4.87 | -0.15 | B5V | 2231 | 06 15 40.1 | +06 03 58 | 6.07 | -0.13 | B6Ve |
| 2266 | 06 18 13.7 | -19 58 01 | 5.52 | -0.18 | B2V | 2288 | 06 20 36.3 | -34 08 38 | 5.53 | -0.19 | B1.5Ve |
| 2344 | 06 27 57.6 | -04 45 44 | 5.06 | -0.17 | B2V | 2309 | 06 24 20.5 | -12 57 45 | 6.12 | -0.08 | B5Ve |
| 2544 | 06 50 36.9 | -25 46 41 | 6.33 | -0.18 | B2V | 2356 | 06 28 49.0 | -07 01 58 | 4.60 | -0.10 | B3Ve |
| 2704 | 07 09 42.9 | -25 13 52 | 5.69 | -0.16 | B2.5IV | 2357 | 06 28 49.5 | -07 02 04 | 5.40 | -0.07 | B3ne |
| 3192 | 08 09 01.6 | -19 14 42 | 4.40 | -0.15 | B5IV | 2358 | 06 28 49.5 | -07 02 04 | 5.60 | B3e | |
| 3240 | 08 13 58.4 | -36 19 21 | 5.08 | -0.19 | B1.5IV | 2397 | 06 32 39.0 | -32 01 50 | 5.69 | -0.17 | B2IVe |
| 3440 | 08 39 23.8 | -53 26 23 | 5.48 | -0.16 | B5V | 2412 | 06 31 58.4 | -58 45 15 | 5.70 | -0.06 | B9Ve |
| 3665 | 09 14 21.9 | +02 18 51 | 3.88 | -0.06 | B9.5V | 2577 | 06 54 42.1 | -01 45 23 | 6.21 | 0.56 | B3IVe+K2II |
| 3734 | 09 22 06.8 | -55 00 39 | 2.50 | -0.18 | B2IV-V | 2690 | 07 07 22.6 | -23 50 25 | 5.71 | -0.10 | B2IVe |
| 3990 | 10 08 56.3 | -51 48 40 | 4.86 | -0.12 | B3IV | 2749 | 07 14 48.7 | -26 46 22 | 3.85 | -0.17 | B2IV-Ve |
| 4292 | 10 59 59.4 | -43 48 26 | 5.81 | -0.08 | B8-9V | 2825 | 07 24 40.1 | -16 12 04 | 5.33 | -0.05 | B2.5IVe |
| 4403 | 11 24 22.1 | -42 40 09 | 6.12 | -0.18 | B2IV-V | 2968 | 07 39 58.0 | -37 34 46 | 6.00 | -0.04 | B6IVe |
| 4590 | 12 00 51.2 | -19 39 32 | 5.26 | -0.20 | B1.5V | 3213 | 08 09 43.2 | -47 56 15 | 5.23 | -0.21 | B1IVe |
| 4648 | 12 13 25.3 | -38 55 45 | 5.76 | -0.13 | B4IV | 3330 | 08 25 31.0 | -51 43 41 | 5.17 | -0.16 | B2Ve |
| 4940 | 13 06 16.7 | -48 27 49 | 4.71 | -0.14 | B5V | 3488 | 08 46 23.8 | -41 07 32 | 6.21 | -0.05 | B9Ve |
| 5231 | 13 55 32.4 | -47 17 18 | 2.55 | -0.22 | B2.5IV | 3670 | 09 13 34.5 | -47 20 19 | 5.92 | -0.05 | B9Ve |
| 5395 | 14 26 08.2 | -45 13 17 | 4.56 | -0.15 | B2IV | 3745 | 09 26 44.8 | -28 47 15 | 6.10 | -0.10 | B6Ve |
| 5559 | 14 56 32.0 | -47 52 45 | 5.64 | -0.04 | B9V | 3858 | 09 41 17.0 | -23 35 30 | 4.77 | -0.12 | B6Ve |
| 5614 | 15 05 47.7 | -25 47 23 | 6.67 | -0.01 | B8V | 3946 | 09 59 06.1 | -23 57 01 | 6.21 | -0.10 | B4Ve |
| 5708 | 15 22 40.9 | -44 41 22 | 3.37 | -0.18 | B2IV-V | 4018 | 10 13 01.3 | -59 55 05 | 6.10 | -0.08 | B4Ve |
| 5805 | 15 38 32.7 | -39 09 39 | 6.57 | -0.07 | B9V | 4460 | 11 34 45.7 | -54 15 51 | 4.62 | -0.08 | B9Ve |
| 5934 | 15 57 40.4 | -20 58 59 | 5.85 | 0.02 | B3V | 4823 | 12 41 56.6 | -59 41 09 | 4.93 | -0.04 | B6IVe |
| 5993 | 16 06 48.4 | -20 40 09 | 3.96 | -0.04 | B1V | 5193 | 13 49 37.0 | -42 28 26 | 3.04 | -0.17 | B2IV-Ve |
| 6080 | 16 20 32.6 | -39 25 51 | 6.12 | -0.07 | B9V | 5311 | 14 13 39.9 | -54 37 33 | 6.11 | 0.05 | B5Ve |
| 6174 | 16 38 26.2 | -43 23 55 | 5.83 | -0.02 | B2.5IV | 5661 | 15 16 36.4 | -60 54 14 | 5.73 | -0.08 | B0.5Ve |
| 6316 | 17 01 52.7 | -32 08 37 | 5.03 | -0.10 | B8V | 5683 | 15 18 32.0 | -47 52 30 | 4.27 | -0.08 | B8Ve |
| 6494 | 17 27 37.5 | -29 43 28 | 6.00 | 0.00 | B9IV | 6519 | 17 31 25.0 | -23 57 46 | 4.81 | 0.00 | B9.5Ve |
| 6628 | 17 49 10.5 | -31 42 12 | 4.83 | -0.04 | B8V | 6621 | 17 48 27.8 | -26 58 30 | 6.35 | 0.12 | B4IVe |
| 6692 | 17 58 39.1 | -28 45 33 | 6.01 | -0.08 | B3IV | 6712 | 18 00 15.8 | +04 22 07 | 4.64 | -0.03 | B2Ve |
| 6893 | 18 25 54.6 | -33 56 43 | 6.30 | -0.08 | B5IV | 6873 | 18 21 28.5 | +05 26 09 | 6.13 | -0.04 | B3Ve |
| 6960 | 18 33 57.8 | -33 01 00 | 5.28 | -0.11 | B2IV-V | 6881 | 18 23 12.2 | -12 00 53 | 5.73 | 0.01 | B8IV-Ve |
| 7169 | 19 01 03.2 | -37 03 39 | 6.69 | B9V | 7249 | 19 08 16.7 | -19 17 24 | 5.54 | -0.11 | B2Ve | |
| 7170 | 19 01 04.3 | -37 03 43 | 6.40 | -0.03 | B8V-IV | 7554 | 19 50 17.5 | +07 54 09 | 6.51 | -0.10 | B2.5IVe |
| 7348 | 19 23 53.2 | -40 36 58 | 3.97 | -0.10 | B8V | 8402 | 22 03 18.9 | -02 09 19 | 4.69 | -0.06 | B7IVe |
| 7709 | 20 11 10.1 | -08 50 32 | 6.49 | -0.15 | B1V | 8539 | 22 25 16.6 | +01 22 39 | 4.66 | -0.03 | B1Ve |
| 8141 | 21 18 11.1 | -04 31 10 | 5.82 | -0.13 | B5V | ||||||
1 Introduction
Be stars are rapidly rotating stars surrounded by an ionized circumstellar disk, whose emission is best known for the distinct doubly peaked H lines. About 15% of all B stars belong to the Be category (Jaschek & Jaschek, 1990, chap. 9), making them a significant component of the hot, massive star population. However, the origin of the circumstellar disks around Be stars is still an unsolved mystery (see e.g. the review by Porter & Rivinius 2003).
Binarity has sometimes been proposed to be responsible for the Be phenomenon. For example, Harmanec et al. (2002) investigate the effects of a detached, secondary component’s gravitational field on the mass ejection into the equatorial plane from the primary. Gies et al. (1998) discuss the rotational history of Per, and find the (compact) companion has had a significant tidal effect on the central Be star. In addition, it should be noted that companions are also known to affect the disk’s properties such as its density law or even size (e.g. Jones et al. 2008 on Dra).
Most models based on binarity have in common that close binaries with separations of order AU, are responsible for the formation of a disk (for an overview, see Negueruela 2007). When one considers the more general case of binaries, it is plausible that disks are affected during the star formation stages by the presence of a companion star, even in the case of a wide binary. However, to be able to address binarity as a crucial ingredient for the existence of Be stars, we need to know whether Be stars are found in binary systems more often than normal B stars. If so, this would indicate that binarity must have something to do with the production of the conditions required for disk formation – either directly, where the tidal forces acting within a (close) binary system result in a disk around a mass losing object, or indirectly, where the influence of the binary companion allows the existing disk to survive.
The most straightforward manner to determine whether the Be binary fraction is significantly different from that of “normal” B-type stars and thereby to assess whether existing binary models are viable in the first place is to establish whether Be stars are more frequently found in binaries than normal B stars. The most recent comparative study on Be binarity was performed 25 years ago by Abt & Cardona (1984). In this study, incorporating the spectroscopic survey of Be and B stars by Abt & Levy 1978, and including both spectroscopic and visual binaries, they found the Be binary fraction to be 30%, similar to that of B stars. However, this paper was essentially a compilation of the then, inevitably incomplete, literature on visual binaries and was never repeated by a homogeneous dedicated investigation. Later studies, such as the Speckle interferometric study by Mason et al. (1997) concentrated on Be stars alone. Despite their high angular resolution, Mason et al. did not discover many new binary systems. This is most likely due to their limited dynamic range – only companions which were fainter by up to 3 magnitudes than the primary could be detected.
The original motivation for the current study was the unexpected result that in an investigation into the spectro-astrometric signatures of the H emission lines of a random sample of 8 Be stars, 5 were found to be a binary with separations at the sub-arcsecond to arcsecond scale (Baines 2004, see also Oudmaijer et al. 2008). The parameter space probed by the spectro-astrometry (from 0.1 arcsec to 1-2 arcsec, up to 6 magnitudes difference, Baines et al. 2006) was not covered in any previous study into the binarity of Be stars (see references above), and observationally this was a completely unconstrained problem. If true, the large fraction of (sub-)arcsecond Be star binaries, would have important implications for our understanding of Be stars. Obviously, if wide binarity could be linked to the Be star phenomenon it would require new physics or new models as the effect from distant companions will be subtle. Alternatively, low number statistics could have mimicked a high binary fraction, whereas, in reality, this may not be the case. A follow-on study with more objects matched by a sample of normal B stars should allow us to decide on the issue. Whereas the technique of spectro-astrometry is very powerful in detecting binaries amongst emission-line stars, it is not as sensitive when considering normal, absorption line, B-type stars (Baines et al., 2006). In order to do a comparative study, we need to employ a technique that is both powerful and applicable to both types of star.
Here we present observations for a simple experiment: are Be stars more likely than normal B stars to be in a binary system? To this end, we obtained Adaptive Optics (AO) data of a matched sample of 40 B and Be stars using an 8 meter class telescope.
2 Observations and Data Reduction
2.1 Target selection
In order to arrive at an unbiased, bright sample of Be stars, we used the Bright Star Catalogue (Hoffleit & Warren Jr, 1982, BSC) as a starting point. We selected on spectral type and luminosity class (BIVe and BVe), and on Declinations that can be covered by the ESO-VLT. There are 71 BVe and BIVe stars in the BSC and its Supplement located below +10o Declination. As comparison, we selected all BV and BIV stars with Declination smaller than +10o. This returned 640 objects, consistent with the notion mentioned above that about 15% of all B stars are of Be spectral type. A random sub-sample of B stars was selected from this master sample to match the number of Be stars to be observed. As Be stars predominately occur for earlier B spectral types, a slight preference was given to the earlier type B stars in this selection. The typical K band magnitudes of the Be stars are around 5-7. The intrinsic K magnitudes for M0 dwarfs are (only) 6-9 magnitudes fainter than those of B9V and B0V stars respectively. Thus, for a limiting K-band magnitude of 12.5 almost the entire main sequence down to the M dwarfs can be probed. A total of 40 B and 39 Be stars was observed using adaptive optics (AO) on Yepun, one of UTs of the Very Large Telescope (VLT) at the European Southern Observatory (ESO) in Chile. No selection on binarity or brightness was applied, instead, the targets were chosen for their observability in terms of their Right Ascension, their location on the sky. The targets are presented in Table 1.
2.2 Observations
The observations were carried out in service mode during 9 nights between 24 March 2005 and 5 June 2005. The observations were conducted with the AO system NACO (Lenzen et al., 2003; Rousset et al., 2003). In order to achieve the best resolution images, data were taken in the K band, where the diffraction limit is 0.057 arcsec or 57 milli-arcsec (mas). NACO has a 10241024 pixel array, with a pixel size of 27 m. The finest plate scale of 13.27 maspix was used, giving a field of view of 13.6 arcsec 13.6 arcsec.
As the targets are very bright, the NB2.17 narrow band filter was used. This filter is centered on Br with a central wavelength of 2.166 m and a full-width at half maximum (FWHM) of 0.023 m. The contribution of Br emission to the total flux from the Be stars is negligible - a typical emission line with an Equivalent Width of 2-3 (see e.g. Persson & McGregor, 1985) would contribute less than 1% to the total flux received by the filter. For each target star, 5 frames were taken in the auto-jitter mode with a box size of 5 5 arcsec. The integration time was dependent on the brightness of the target, and was in most cases 12 seconds per jitter position. For the very brightest sources, a Neutral Density filter was employed. The seeing was always better than 1.4 arcsec, and airmasses were below 1.2, in order to achieve a good AO correction. The targets were used as AO reference stars.
The data were reduced with the ESO pipeline reduction software. Dark frames were produced on the same night as each observing run, with the same integration time as the science frames produced. Dark subtraction and flat field division were performed on individual frames by the pipeline, before the 5 calibrated frames were combined. This was performed by automated detection of the target, determining an offset then registering and stacking of the 5 calibrated frames. All the raw data were checked by eye to investigate whether the automated detection did not produce artificial binaries, and in the few ambiguous cases, the shift-and-add procedure was done by hand.
Typical FWHM of 0.09 arcsec were measured on the final images, and the point spread function’s (PSF) widths ranged between nightly averages of 0.07 arcsec and 0.10 arcsec. The typical Strehl ratio achieved was 30%, with a fair fraction of targets having Strehl ratios exceeding 45%.
2.3 Binary Detection
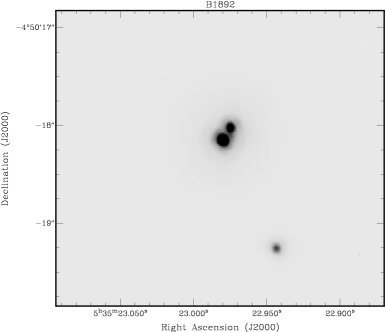
The raw and reduced images were visually inspected to identify binary companions. The binary separation and position angle were determined by fitting a two-dimensional Gaussian function to both spatial profiles. The maximum separation found was 8 arcsec, which is about the maximum possible value in our square field-of-view with the target source positioned in the centre of the frame and a 5 arcsec jitter offset. The minimum separation was 0.1 arcsec, at the resolution limit of our data. The difference in K-band magnitude (or rather, difference in magnitude of the light through the NB filter, , which is very close to ), was measured for each component using either aperture photometry, or by estimating the total counts of each star, based on a two-dimensional Gauss fit of the spatial profiles. In the case of more than one companion, the magnitude difference was found for the closest of the companions. In two cases it proved difficult to obtain a reliable estimate of the secondary’s magnitude and the entry is left blank in Table 2. The largest, reliable, magnitude difference was 7.3 magnitude. As a check on the quality of our data, the parameters of known binaries were compared to our results. For example, HR 3745 was identified as having a separation of 0.55 arcsec and a PA of by Hartkopf et al. (1996). Here we find a separation of 0.55 arcsec. and a PA of . The difference in position angle is not necessarily an indication of the errors involved as it can well be due to orbital motion.
We find 14 visual binaries among the 40 observed B stars and 13 visual binaries among the 39 Be stars observed. Taken at face value, the binary fractions are therefore 35 8 % (70% confidence interval) for the B stars and 33 8 % for Be stars.
The numbers for B and Be stars are very close and comfortably within the uncertainties. However, it is not obvious that these concern physical binaries or visual binaries whose secondaries have no physical association with the target stars. The best way to test this is to obtain second epoch data to investigate whether the secondary stars share a common proper motion or not. In the absence of such data, we consider the following as a proxy for the possibility of finding a chance binary companion.
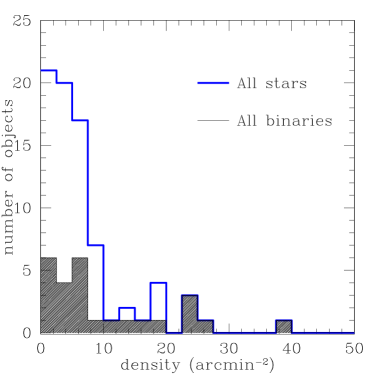
The chances of finding one star in the field of view are large when the stellar density is at, or exceeds, a value of 1 star per field of view of 13.6 13.6 arcsec2 corresponding to 19.5 stars per arcmin2. A measure of the local surface density of stars was obtained from the 2MASS Point Source Catalogue (Cutri et al., 2003) by tallying up all objects within a circle with a radius of 1 arcmin from the target objects. The frequency of the stellar densities towards the sample is shown in Fig. 2. Most objects lie in regions with stellar densities less than 10 per arcmin2, less than half a star per field of view, and the presence of a chance companion is not expected. However, all six objects which lie in densely populated areas on the sky (densities larger than 20 arcmin-2), are found to have a companion. It is much more likely that these objects are normal field stars that happen to be in the field of view rather than physical binary stars, and we will proceed without those objects.
3 Results
3.1 Binary fraction
After selecting on the objects with a local field star surface density less than 20 arcmin-2, we remain with 11 Be binaries out of 37 targets (30 8 %) and 10 B binaries out of 36 targets (29 8%). The B and Be binary fractions are remarkably similar. In the remainder of this study, we will continue the analysis with these 21 binary systems. For completeness we note that if the density criterion were lowered to 12.5 or 15 to exclude the next two objects, the statistics remain the same, but now both samples would be reduced by exactly one object. HR 5661 (a Be star with a local source density of 16 arcmin-2) and HR 6316 (a B star with a local source density of 18 arcmin-2) remain in the sample.
In the following, we investigate and compare basic properties of the binary systems such as separations and flux differences - which directly translate into mass ratios - between the primaries and secondaries. The binary systems and their parameters are listed in Table 2.
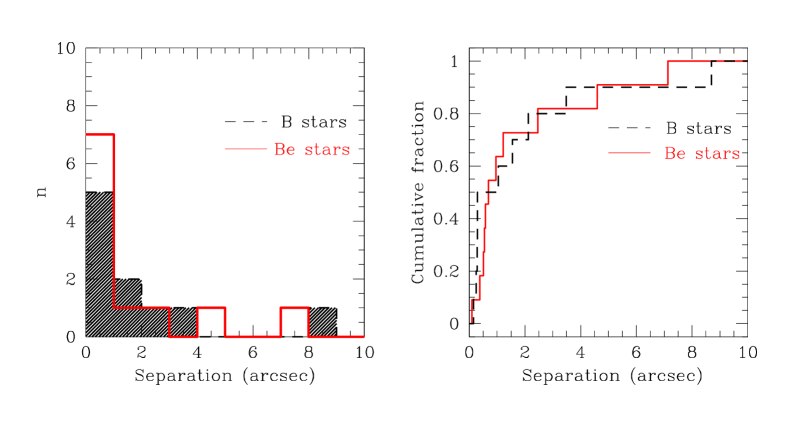
3.2 Binary separation
Here we compare the binary separations for all B and Be stars. A histogram of the separations is shown in Fig. 3. The Be-star separations are slightly more centrally peaked than the B star separations. Although it is not a very significant result, we would wish to draw attention to the fact that this may be expected. The Be stars are rarer than B stars and they are thus, on average, further away. This is corroborated by the parallaxes of the sample objects. Using the Hipparcos parallaxes taken either from Perryman et al. (1997) or van Leeuwen (2007), we find that the average parallax of the B-binaries is 4.9 milli-arcsec (with a generous spread of 2.7 mas) while the average parallax of the Be stars is slightly lower at 4.4 mas (with a of 2.8 mas). Should the intrinsic separation distribution be similar, then it is to be expected that the Be stars’ separations (in arcsec) are smaller, or somewhat more centrally peaked than for the B stars. We note however, that this is not a large effect. We also performed a 2-sample Kolmogorov-Smirnov (KS) test. The cumulative distribution is shown in the right hand panel of Fig. 3. The KS statistic indicates that the hypothesis that the Be and B binary separations are drawn from different separation distributions can be rejected at the 74% level. This is not overly conclusive, but the sample is large enough to have identified large differences in the distribution of separations, if there would have been any.
As conclusion of this section, we find that the Be binaries are similar to the B binaries in terms of separation.
3.3 Mass ratios
Here we consider the masses of the components in the binary systems. In principle, we can infer the masses of the primaries from their listed spectral types using published calibrations, and derive spectral types of the secondaries using the flux differences and by comparing with the intrinsic magnitudes listed for the different spectral types, we can then determine the secondaries’ masses. Although this is a standard method, it is fairly elaborate and introduces various errors. These comprise the error in spectral typing, the mass and magnitudes range for a given spectral type (cf. e.g. the width of the Main Sequence, Perryman et al. (1997), see also Oudmaijer et al. (1999) for an in-depth study of K0V stars) and affect the final result.
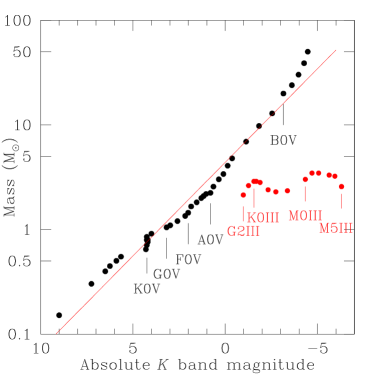
These issues are mostly avoided in the present study by simply using the K band magnitude difference. This provides an excellent opportunity to derive the mass ratio with no dependence at all on the spectral type of either component. It turns out that there is a strong relation between the intrinsic K band magnitude and the mass of a main sequence star. This is shown in Fig. 4, where the mass of a star (taken from Straizys & Kuriliene 1981) is plotted against the intrinsic K band magnitude which was computed using the intrinsic V band magnitudes also taken from Straizys & Kuriliene (1981) and the intrinsic V K colours due to Koornneef (1983). The relation for Main Sequence stars is close to a straight line which can be represented as
with in solar units, and a formal uncertainty on the slope of 0.005. This in turn translates into a mass ratio - without the need of knowing the masses separately:
with the magnitude difference between both objects in our data.
By virtue of the rather linear relationship between K band flux and stellar mass, the mass ratio can be determined independent of prior knowledge of the stellar spectral types and luminosities while it is independent of reddening too. The only assumption we tacitly make is that both the primary and secondary stars under consideration are on the Main Sequence. This may seem obvious, but we note that many known binaries with a hot O, B type dwarf star have a cool, G, K or M-type giant secondary (see e.g. Ginestet & Carquillat 2002). In our sample, HR 2577, an unresolved spectroscopic binary with a K2II companion listed in Table 1 is a prime example. In most such binary stars, the B-type component dominates at optical wavelengths, while the secondary dominates at longer wavelengths, simply because cooler stars are redder. In contrast, the current study is conducted in the infrared already and the brightest binary component is the previously known B-star whose catalogued K band magnitide is consistent with the optical brightness, while the secondary is fainter.
For reference, we have also plotted the mass of a selected number of giant stars against their intrinsic K band magnitudes in Fig. 4. The cool G, K and M-giants are brighter than most B stars up to a spectral type of B3V. This means that for all stars with spectral types of B3 or later in our sample, we can be fairly certain that the companion is not a giant as the primary star, the B star, is the brightest. Indeed, only for B0V-B3V stars there would be a chance that the (fainter) companion is a giant rather than a main sequence dwarf star. In such a case, the magnitude difference will be at most 2 magnitudes. Inspection of Table 2 however reveals that almost all binaries with a B0V-B3V primary have a magnitude difference larger than 2. We conclude that it is very likely that the secondary stars are main sequence stars and that we are therefore justified in applying our K-mass relation to determine the mass ratio of the systems.
One correction needs to be made for the Be stars, the free-free emission from the ionized disk increases with wavelength, and can give a slight excess emission at the K-band (e.g. Dougherty et al. 1991). To arrive at the intrinsic magnitude of the star itself, we need to subtract the disk contribution from the K band flux. This is done in the standard manner by dereddening the V band magnitude (using intrinsic colours for the respective spectral types from Schmidt-Kaler in Aller et al. (1982, Chap. 4)) and computing the predicted K band magnitude using the V K colours as outlined above. The difference between the predicted and observed K-band magnitude is the excess. In two cases, HR 6712 and HR 5193, the excesses were negative by up to half a magnitude and thus unphysical. These stars are variable and using the optical colours from SIMBAD rather than from the BSC solved this situation. The “excesses” computed for the normal B stars averaged 0.01 magnitude with a scatter of 0.1 magnitude, which gives an indication of the uncertainties involved in this exercise. As all magnitude differences between the companions are much larger than 0.3 magnitudes, this error does not affect the resulting mass ratio. In fact, only two Be stars have computed excesses which are much larger than 0.3 magnitude, these are HR 2142 (0.6 mag) and HR 2356 (0.8 mag). After correcting for the excess emission, we can then compute the photospheric magnitude difference and the mass ratio .
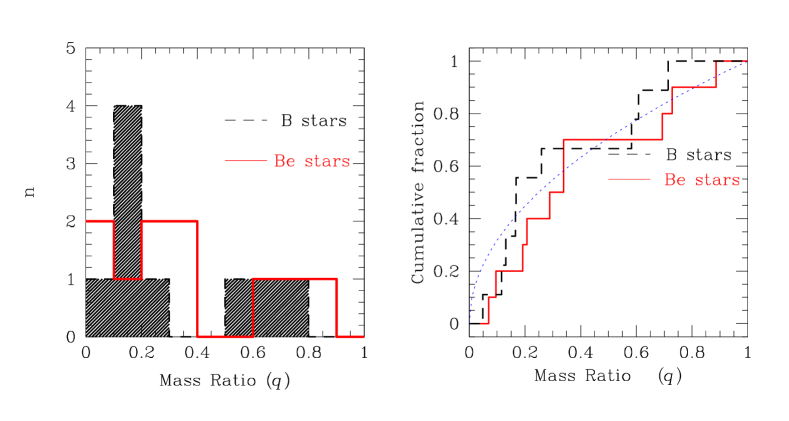
In Fig. 5 the results for the mass ratios are presented in a similar fashion as for the separations in the previous figure. Note that the two objects for whose close companions we were unable to retrieve accurate photometry are not plotted. The left hand plot shows the distribution of mass ratios, which range from 0.07 to 0.9. Based on the relatively low numbers, it is hard to describe this distribution, but it would seem that the distributions are similar and rather flat for the B and Be stars. It does not rise steeply to low masses as would be the case if the secondary masses were randomly sampled from the Initial Mass Function (see e.g. Wheelwright et al. 2010). The cumulative plot in the right hand panel confirms that there is not a significant difference between the two distributions. The KS test returns a probability that the samples are drawn from different populations can be rejected at 50%. As with the separations, if the mass ratios would have been very different, the current sample is large enough to highlight this. It therefore seems likely that the mass ratios of both the B and Be type binaries too are sampled from the same parent distribution. For reference the function is overplotted as a dashed line. This is not a fit to our data, instead it is what Shatsky & Tokovinin (2002) found to best represent the mass ratio they determined for a large sample of B-type binaries. Our data are consistent with their data, which sample a similar separation and magnitude range.
In summary of this exercise, there is no difference between B and Be binaries as far as their companion masses is concerned.
| HR | SpTp | K | ||||
| (arcsec) | o | (mag) | (mag) | |||
| 1753 | B3V | 0.28 | -65 | 4.3 | 6.79 | 0.17 |
| 1892 | B1V | 0.15 | -32 | 1.2 | 5.06 | 0.61 |
| 2056 | B5V | 1.04 | 198 | 5.2 | 5.25 | 0.12 |
| 3990 | B3IV | 0.29 | -56 | 5.10 | ||
| 4940 | B5V | 1.55 | 267 | 3.2 | 5.05 | 0.26 |
| 5559 | B9V | 2.12 | 278 | 0.8 | 5.68 | 0.72 |
| 5708 | B2IV-V | 0.29 | 228 | 1.3 | 4.13 | 0.58 |
| 6316 | B8V | 8.70 | 27 | 7.3 | 5.26 | 0.05 |
| 6960 | B2IV-V | 0.25 | 178 | 4.3 | 5.54 | 0.17 |
| 7709 | B1V | 3.49 | 150 | 4.9 | 6.95 | 0.13 |
| 2142 | B2Vne | 0.58 | 269 | 4.6 | 4.78 | 0.19 |
| 2231 | B6Ve | 0.39 | -83 | 3.8 | 6.38 | 0.21 |
| 2356 | B3Ve | 7.14 | 133 | 1.7 | 4.08 | 0.70 |
| 2412 | B9Ve | 2.46 | 221 | 2.7 | 5.72 | 0.34 |
| 2690 | B2IVe | 0.69 | 228 | 6.0 | 5.64 | 0.10 |
| 3745 | B6Ve | 0.55 | 281 | 1.0 | 6.09 | 0.73 |
| 3946 | B4Ve | 0.51 | -9 | 3.2 | 6.23 | 0.29 |
| 5193 | B2Vnpe | 4.60 | -57 | 6.4 | 4.01 | 0.07 |
| 5661 | B0.5Ve | 1.22 | 164 | 2.6 | 5.94 | 0.34 |
| 5683 | B8Ve | 0.96 | -55 | 0.3 | 4.43 | 0.89 |
| 6712 | B2Ve | 0.10 | 154 | 5.03 |
4 Discussion and final remarks
We have observed a total of 79 B and Be stars at high spatial resolution to study their binary properties. This is the first systematic comparative and deepest imaging study into the binarity of Be stars published. The observations probe scales down to less than 0.1 arcsecond and allow companions up to 10 magnitudes fainter to be detected. In the process, we derived a simple relation between the K-band magnitude difference and the mass-ratio of the binary components under the assumption that both components are on the Main Sequence. The latter is justified in our sample. After excluding a few visual binaries that are located in regions of high stellar density, we find that :
-
1.
There are 10 detected binaries out of 36 B stars and 11 detected binaries out of 37 Be stars (corresponding to binary fractions of 29 8 % and 30 8% respectively). The binary fractions are nearly identical.
-
2.
The separations of the B and Be binary systems follow the same cumulative distributions.
-
3.
The mass ratios for the 9 B and 10 Be binaries for which we have differential photometry have similar distributions. Like for the separations, the samples appear to be drawn from the same parent distribution.
This leads to our main conclusion :
-
•
The binary fraction, and the binaries’ properties, of Be stars in the separation range 20 - 1000 AU are very similar to those of a matched sample of B stars. This is a statistically robust result and as both samples were observed with the same observational equipment, and therefore were subject to the same observational biases, we can rule out binary companions at separations of 20 AU or more as being responsible for the Be phenomenon.
Returning to the original motivation of the survey, the previously found large fraction of wide Be binaries has been reduced by a factor of 2 due to improved number statistics. More importantly, the comparison with normal B stars now allows us to firmly conclude that there is no need, based on this study, to explore new models involving wide binaries for the Be phenomenon.
Closer binaries than 20 AU can only be found with methods that have even higher spatial resolution than here (diffraction limited imaging at an 8 meter telescope in the K band), or with radial velocity studies. A systematic imaging study at even higher resolution (indeed at any resolution) such as this one has not been performed, but the systematic spectroscopic study by (Abt & Levy, 1978) does not reveal a large percentage of close binaries. Indeed, on the contrary, they find a lower close binary fraction among Be stars than B stars. Therefore, binarity can not be responsible for all Be stars.
Finally, a word on the similar mass ratios and binary separations. The mass ratio and separation of a binary system are the result of the initial conditions governing the formation of both components and their subsequent evolution. The stars in our sample are field stars, which means that if they were formed in clusters, as most massive stars do, these clusters have dispersed long since. Given that the separations of the B and Be binaries under consideration are fairly wide, the objects were most likely formed in low density clusters or even in isolation. This is because large separation binaries will be destroyed early in the evolution of dense clusters, while close, more strongly bound binaries are most likely to survive throughout the entire evolution (Kouwenhoven et al., 2009; Parker et al., 2009). It is beyond the scope of this paper to derive the precise cluster conditions, but it would appear that both the evolutionary history and the birthplaces of the B and Be stars are very much the same. It can be concluded from our data, therefore, that the Be phenomenon does not result from a substantially different star formation mechanism or conditions compared to those for normal B stars.
Acknowledgments
RDO is grateful for the support from the Leverhulme Trust for awarding a Research Fellowship. AMP acknowledges support from The Rothschild Community of Excellence Programme. We thank the referee, Helmut Abt, for his perceptive comments. It is a pleasure to thank Ben Davies, Hugh Wheelwright and Willem-Jan de Wit for their comments on an earlier version of the manuscript. We thank Simon Goodwin for insightful discussions and Simon Baber for his expert help in the final stages of this project.
References
- Abt & Cardona (1984) Abt H. A., Cardona O., 1984, ApJ, 285, 190
- Abt & Levy (1978) Abt H. A., Levy S. G., 1978, ApJS, 36, 241
- Aller et al. (1982) Aller L. H., Appenzeller I., Baschek B. e. a., 1982, Landolt-Börnstein: Numerical Data and Functional Relationships in Science and Technology . Springer-Verlag Berlin Heidelberg New York
- Baines (2004) Baines D., 2004, PhD Thesis. University of Leeds, UK
- Baines et al. (2006) Baines D., Oudmaijer R. D., Porter J. M., Pozzo M., 2006, MNRAS, 367, 737
- Cutri et al. (2003) Cutri R. M., Skrutskie M. F., van Dyk S. e. a., 2003, 2MASS All Sky Catalog of point sources.. NASA/IPAC Infrared Science Archive.
- Dougherty et al. (1991) Dougherty S. M., Taylor A. R., Clark T. A., 1991, AJ, 102, 1753
- Gies et al. (1998) Gies D. R., Bagnuolo Jr. W. G., Ferrara E. C., Kaye A. B., Thaller M. L., Penny L. R., Peters G. J., 1998, ApJ, 493, 440
- Ginestet & Carquillat (2002) Ginestet N., Carquillat J. M., 2002, ApJS, 143, 513
- Harmanec et al. (2002) Harmanec P., Bisikalo D. V., Boyarchuk A. A., Kuznetsov O. A., 2002, A&A, 396, 937
- Hartkopf et al. (1996) Hartkopf W. I., Mason B. D., McAlister H. A., Turner N. H., Barry D. J., Franz O. G., Prieto C. M., 1996, AJ, 111, 936
- Hoffleit & Warren Jr (1982) Hoffleit D., Warren Jr W., 1982, The Bright Star Catalogue. New Haven: Yale University Observatory (5th edition), 1991
- Jaschek & Jaschek (1990) Jaschek C., Jaschek M., 1990, The Classification of Stars
- Jones et al. (2008) Jones C. E., Tycner C., Sigut T. A. A., Benson J. A., Hutter D. J., 2008, ApJ, 687, 598
- Koornneef (1983) Koornneef J., 1983, A&A, 128, 84
- Kouwenhoven et al. (2009) Kouwenhoven M. B. N., Goodwin S. P., Parker R. J., Davies M. B., Malmberg D., Kroupa P., 2009, ArXiv e-prints 0909.1225
- Lenzen et al. (2003) Lenzen R., Hartung M., Brandner W., Finger G., Hubin N. N., Lacombe F., Lagrange A.-M., Lehnert M. D., Moorwood A. F. M., Mouillet D., 2003, in SPIE, Vol. 4841, p. 944
- Mason et al. (1997) Mason B. D., Ten Brummelaar T., Gies D. R., Hartkopf W. I., Thaller M. L., 1997, AJ, 114, 2112
- Negueruela (2007) Negueruela I., 2007 Vol. 361 of ASP Conference Series, . Astron. Soc. Pac., p. 376
- Oudmaijer et al. (1999) Oudmaijer R. D., Groenewegen M. A. T., Schrijver H., 1999, A&A, 341, L55
- Oudmaijer et al. (2008) Oudmaijer R. D., Parr A. M., Baines D., Porter J. M., 2008, A&A, 489, 627
- Parker et al. (2009) Parker R. J., Goodwin S. P., Kroupa P., Kouwenhoven M. B. N., 2009, MNRAS, 397, 1577
- Perryman et al. (1997) Perryman M. A. C., Lindegren L., Kovalevsky J. e. a., 1997, A&A, 323, L49
- Persson & McGregor (1985) Persson S. E., McGregor P. J., 1985, AJ, 90, 1860
- Porter & Rivinius (2003) Porter J. M., Rivinius T., 2003, PASP, 115, 1153
- Rousset et al. (2003) Rousset G., Lacombe F., Puget P., Hubin N. N., Gendron E., Fusco T., Arsenault R., Charton J., Feautrier P., Gigan P., Kern P. Y., Lagrange A.-M., Madec P.-Y., Mouillet D., Rabaud D., Rabou P., Stadler E., Zins G., 2003, in SPIE, Vol. 4839, p. 140
- Shatsky & Tokovinin (2002) Shatsky N., Tokovinin A., 2002, A&A, 382, 92
- Straizys & Kuriliene (1981) Straizys V., Kuriliene G., 1981, Ap&SS, 80, 353
- van Leeuwen (2007) van Leeuwen F., 2007, A&A, 474, 653
- Wheelwright et al. (2010) Wheelwright H. E., Oudmaijer R. D., Goodwin S. P., 2010, MNRAS, 401, 1199