to appear in The Astrophysical Journal
On Radiation Pressure in Static, Dusty H II Regions
Abstract
Radiation pressure acting on gas and dust causes H II regions to have central densities that are lower than the density near the ionized boundary. H II regions in static equilibrium comprise a family of similarity solutions with 3 parameters: , , and the product ; characterizes the stellar spectrum, characterizes the dust/gas ratio, is the stellar ionizing output (photons/s), and is the rms density within the ionized region. Adopting standard values for and , varying generates a one-parameter family of density profiles, ranging from nearly uniform-density (small ) to shell-like (large ). When , dusty H II regions have conspicuous central cavities, even if no stellar wind is present. For given , and , a fourth quantity, which can be , determines the overall size and density of the H II region. Examples of density and emissivity profiles are given. We show how quantities of interest – such as the peak-to-central emission measure ratio, the rms-to-mean density ratio, the edge-to-rms density ratio, and the fraction of the ionizing photons absorbed by the gas – depend on , , and . For dusty H II regions, compression of the gas and dust into an ionized shell results in a substantial increase in the fraction of the stellar photons that actually ionize H (relative to a uniform density H II region with the same dust/gas ratio and density ). We discuss the extent to which radial drift of dust grains in H II regions can alter the dust-to-gas ratio. The applicability of these solutions to real H II regions is discussed.
1 Introduction
Strömgren (1939) idealized photoionized nebulae around hot stars as static, spherical regions with a uniform density of ionized gas out to a bounding radius . The Strömgren sphere model continues to serve as the starting point for studies of H II regions around hot stars. However, a number of physical effects lead to departures from the simple Strömgren sphere model: dynamical expansion of the H II region if the pressure in the surrounding neutral medium cannot confine the ionized gas; deviations from sphericity due to nonuniform density; motion of the star relative to the gas; injection of energy and momentum by a stellar wind; absorption of H-ionizing photons by dust grains; and radiation pressure acting on gas and dust. Each of these effects has been the object of a number of investigations, beginning with the study of ionization fronts by Kahn (1954).
Savedoff & Greene (1955) appear to have been the first to discuss the expansion of a spherical H II region in an initially uniform neutral medium. Mathews (1967, 1969) and Gail & Sedlmayr (1979) calculated the dynamical expansion of an H II region produced by an O star in a medium that was initially neutral, including the effects of radiation pressure acting on the dust. Mathews (1967, 1969) showed that radiation pressure on dust would produce low-density central cavities in H II regions. More recently, Krumholz & Matzner (2009) reexamined the role of radiation pressure on the expansion dynamics of H II regions, concluding that radiation pressure is generally unimportant for H II regions ionized by a small number of stars, but is important for the expansion dynamics of giant H II regions surrounding clusters containing many O-type stars. Their study concentrated on the forces acting on the dense shell of neutral gas and dust bounding the H II region, hence they did not consider the density structure within the ionized region.
Dust absorbs photons that would otherwise be able to ionize hydrogen, thereby reducing the extent of the ionized zone. Petrosian et al. (1972) developed analytic approximations for dusty H II regions. They assumed the gas density to be uniform, with a constant dust-to-gas ratio, and found that dust could absorb a substantial fraction of the ionizing photons in dense H II regions. Petrosian et al. did not consider the effects of radiation pressure.
Dopita et al. (2003, 2006) constructed models of compact H II regions, including the effects of radiation pressure on dust, and presented models for different ionizing stars and bounding pressures. In these models, radiation pressure produces a density gradient within the ionized gas.
The present paper provides a systematic discussion of the structure of dusty H II regions that are assumed to be in equilibrium with an external bounding pressure. The assumptions and governing equations are presented in §2, where it is shown that dusty H II regions are essentially described by a 3-parameter family of similarity solutions. In §3 we show density profiles for selected cases, as well as surface brightness profiles. The characteristic ionization parameter and the fraction of the ionizing photons absorbed by dust are calculated. Dust grain drift is examined in §4, where it is shown that it can alter the dust-to-gas ratio in the centers of high density H II regions. The results are discussed in §5, and summarized in §6.
2 Equilibrium Model
Consider the idealized problem of a static, spherically-symmetric equilibrium H II region ionized by a point source, representing either a single star or a compact stellar cluster. Assume a constant dust-to-gas ratio (the validity of this assumption will be examined later). For simplicity, ignore scattering, and assume , the dust absorption cross section per H nucleon, to be independent of photon energy over the to range containing most of the stellar power.
Let the star have luminosity , where and are the luminosities in and photons, respectively. The rate of emission of photons is and the mean energy of the ionizing photons is . A single main sequence star of spectral type O6V has and (Martins et al. 2005). A compact cluster of OB stars might be treated as a point source with much larger values of and .
Ignore He, and assume the H to be nearly fully ionized, with photoionization balancing “Case B” radiative recombination, with “on-the-spot” absorption of recombination radiation. Take the effective radiative recombination coefficient to be for , with , where is the gas temperature.
Assume the gas to be in dynamical equilibrium (the neutral gas outside the ionized zone is assumed to provide a confining pressure). Static equilibrium then requires that the force per unit volume from radiation pressure be balanced by the pressure gradient:
| (1) |
where is the proton density, is the power in photons crossing a sphere of radius , and is the dust absorption optical depth. Eq. (1) underestimates the radiation pressure force, because it assumes that recombination radiation (including Lyman-) and cooling radiation escape freely.
The functions and are determined by
| (2) | |||||
| (3) |
with boundary conditions and . Define a characteristic density and length scale
| (4) | |||||
| (5) |
and the dimensionless parameters
| (6) | |||||
| (7) |
The parameter , the ratio of the power in non-ionizing photons to the power in photons with , depends solely on the stellar spectrum. We take as our standard value, corresponding to the spectrum of a blackbody, but we also consider () and (); the latter value might apply to a cluster of O and B stars.
Momentum can be transferred to a dust grain by photon absorption, but also by scattering. The cross section appearing in eq. (1) should be , the radiation pressure cross section per H, , averaged over the spectrum of the radiation field at radius , where and are the absorption and scattering cross section per H, and is the mean value of the cosine of the scattering angle for photons of frequency .
In eqs. (2) and (3), characterizes the effectiveness of the dust in attenuating the radiation field. While scattering does not destroy the photon, it does increase the probability of the photon undergoing subsequent absorption. Thus, the value of in eqs. (2) and (3) should exceed .
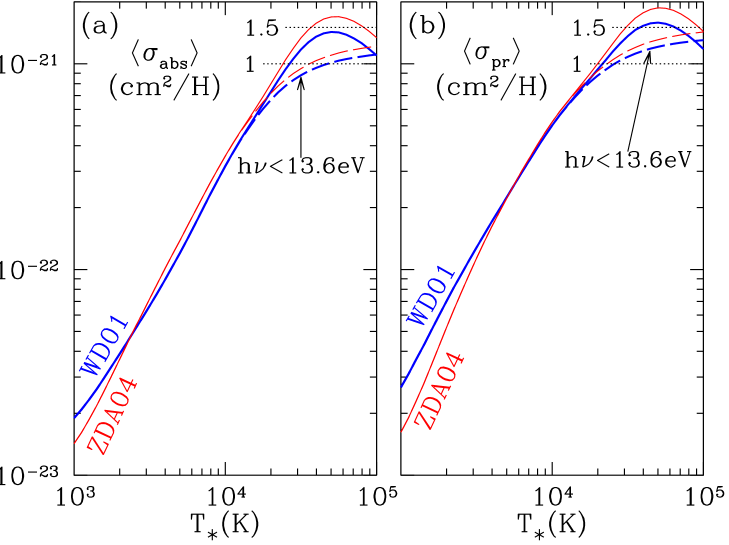
Figure 1(a) shows the dust absorption cross section per H nucleon averaged over a blackbody spectrum, for two dust models (Weingartner & Draine 2001; Zubko et al. 2004) that reproduce the wavelength-dependent extinction in the diffuse interstellar medium using mixtures of PAHs, graphite, and amorphous silicate grains. Fig. 1(b) shows that , the radiation pressure cross section averaged over blackbody spectra, is only slightly larger than . Given the uncertainties in the nature of the dust in H II regions, it is reasonable to ignore the distinction between and the attenuation cross section and simply take in eq. (1–3).
For dust characteristic of the diffuse ISM, one could take for . However, dust within an H II region may differ from average interstellar dust. For example, the small-size end of the size distribution might be suppressed, in which case would be reduced. Low metallicity galaxies will also have lower values of , simply because there is less material out of which to form grains. In the present work we will assume a factor 1.5 reduction in relative to the local diffuse ISM, taking as the nominal value, but larger and smaller values of will also be considered.
The dimensionless parameter (defined in eq. 7) depends also on the gas temperature and on the mean ionizing photon energy , but these are not likely to vary much for H II regions around OB stars. We take as a standard value, but will also consider and . Low-metallicity systems would be characterized by small values of .
Switching to dimensionless variables , , the governing equations (1–3) become
| (8) | |||||
| (9) | |||||
| (10) |
with initial conditions and . The solutions are defined for , where is determined by the boundary condition . The actual radius of the ionized zone is . For each solution the mean density is
| (11) |
the root-mean-square density is
| (12) |
and the gas pressure at the edge of the H II region is
| (13) |
Let
| (14) |
be the radius of a dustless Strömgren sphere with density . The fraction of the photons that are absorbed by H is simply
| (15) |
For given , varying the initial value111 For , as , and the integration must start at some small . of at some fixed generates solutions with different density profiles. Therefore the full set of solutions forms a three-parameter family of similarity solutions , , and , parametrized by , , and a third parameter. The third parameter can be taken to be . For dusty H II regions, an alternative choice for the third parameter is the dust optical depth on a path with density :
| (16) | |||||
| (17) |
The static H II regions described by eq. (1 – 3) are determined by 7 distinct dimensional quantities: three parameters describing the central star (, , and ), the recombination rate coefficient , the thermal energy , the dust cross section per nucleon , and the external pressure confining the H II region. According to the present analysis, this 7-parameter family of solutions actually reduces to a 3-parameter family of similarity solutions. The dimensionless parameters and , plus choice of an initial value for the function near , suffice to determine the scaled density profile and radius : this is the 3-parameter family of similarity solutions.
Specifying numerical values for the ratios and fixes the values of and , thus giving for . Thus far we have invoked 5 independent parameters, but have not actually specified either or .
Specifying and – the 6th and 7th parameters – allows us to compute the actual values of and , and the bounding pressure .
If the “initial value” of near the origin is taken as a boundary condition, then emerges as a derived quantity. However, if we instead regard as a boundary condition, then the initial value of ceases to be a free parameter, and instead must be found (e.g., using a shooting technique) so as to give the correct boundary pressure : the initial value of is thus determined by the 7 physical parameters (, , , , , , and ).
Thus we see how the 3 parameter family of dimensionless similarity solutions corresponds to a 7 parameter family of physical solutions.


3 Results
Equations (8-10) can be integrated numerically. Figure 2a shows the solution for the case where no dust is present (). Radiation pressure associated with photoionization produces a density gradient in the H II region, but it is modest unless is very large. The central density is nonzero. For , the density is uniform to within .
As discussed above, the dust abundance relative to H is characterized by the parameter . Density profiles are shown in Fig. 2b-d for and , corresponding approximately to . With dust present, the density formally goes to zero at . For fixed , the size of the low-density central cavity (as a fraction of the radius of the ionization front) increases with increasing . The enhancement of the density near the ionization front also becomes more pronounced as is increased. For , and , we find .


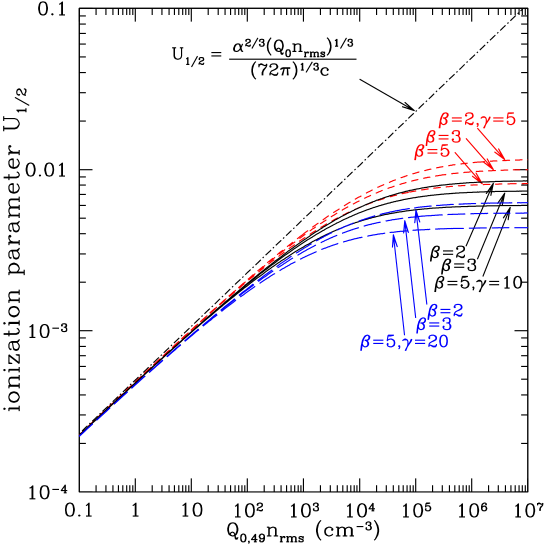
The state of ionization of the gas is determined by the hardness of the radiation field, and the value of the dimensionless “ionization parameter”
| (18) |
where is the density of photons with . Within an H II region, the value of varies radially. As a representative value, we evaluate , the value at the “half-ionization” radius , the radius within which 50% of the H ionizations and recombinations take place.222 Some authors (e.g., Dopita et al. 2006) use the volume-averaged ionization parameter . For a uniform density dustless H II region, . In a uniform density dustless H II region, is the same as the half-mass radius, and
| (19) |
For our present models,
| (20) |
where is the value of within which 50% of the H ionizations and recombinations take place. Figure 3 shows as a function of for static dusty H II regions with radiation pressure, for selected values of and . For small values of , dust and radiation pressure are negligible and coincides with (eq. 19). However, for large values of , falls below . For – corresponding to the dust abundances that we consider to be likely for Galactic H II regions – we see that for .
The emission measure is shown as a function of impact parameter in Figure 4. For small values of , the intensity profile is close to the semicircular profile of a uniform density sphere. As is increased, the profile becomes flattened, but, if no dust is present (, Fig. 2a), the ionized gas only begins to develop an appreciable central minimum for .
When dust is present, however, the profiles are strongly affected. For standard parameters , the emission measure shows a pronounced central minimum for , with a peak-to-minimum ratio for . As is increased, the ionized gas becomes concentrated in a thin, dense shell, the peak intensity near the edge rises, and the central emission measure changes from for small to as .
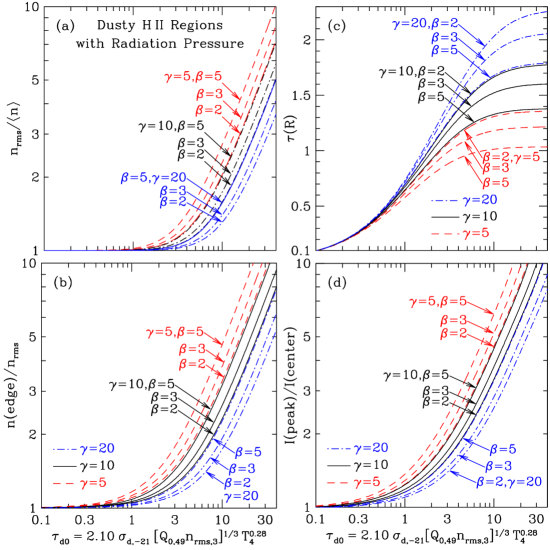
When , the present models have the ionized gas concentrated in a thin, dense, shell. Figure 5a shows the ratio of the rms density to the mean density as a function of . The highest ionized density occurs at the outer edge of the ionized zone, and Figure 5b shows the ratio as a function of .
In the low density limit , the dust optical depth from center to edge . The actual dust optical depth from center to edge is shown in Figure 5c. When the H II region develops a dense shell, which occurs for , the actual dust optical depth is significantly smaller than the value . Figure 5c shows that for , for example, the actual dust optical depth is only in the range 1–2.3, depending on the values of and .
The shell-like structure is also apparent in the ratio of the peak intensity to the central intensity. As seen in Figures 4(b-d), dust causes the peak intensity to be off-center. For fixed and , the ratio of peak intensity to central intensity increases monotonically with increasing , as shown in Fig. 5(d).
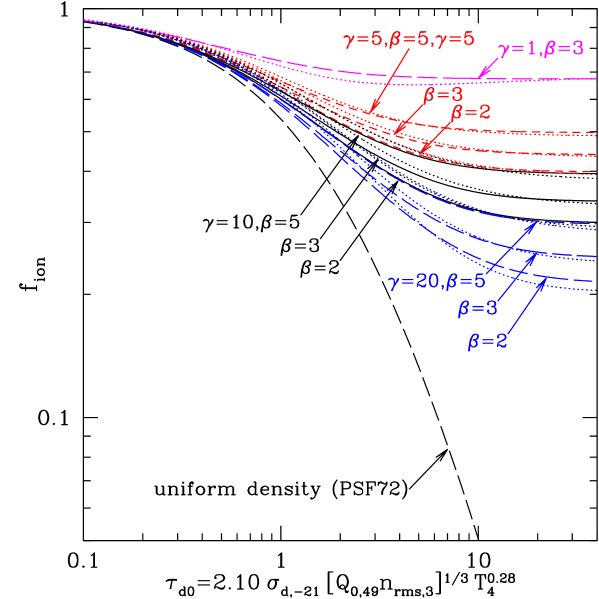
Because the shell is dense, radiative recombination is rapid, the neutral hydrogen fraction is enhanced, and H atoms can compete with dust to absorb photons. Figure 6 shows , the fraction of the photons emitted by the star that photoionize H (i.e., are not absorbed by dust), as a function of the parameter . Results are shown for and . For , , and , the numerical results in Figure 6can be approximated by the fitting formula
| (21) | |||||
| (22) | |||||
| (23) |
where , , and are given by (6), (7), and (16). The form of eq. (21-23) has no physical significance, but eq. (21) can be used to estimate the total H ionization rate in dusty H II regions.
4 Dust Drift
4.1 Gas Drag vs. Radiation Pressure
Eq. (1) assumes the dust to be tightly coupled to the gas, so that the radiation pressure force on the dust can be considered to act directly on the gas. In reality, radiation pressure will drive the dust grains through the plasma. If the grains approach their terminal velocities (i.e., acceleration can be neglected) then, as before, it can be assumed that the radiation pressure force is effectively applied to the gas. However, the motion of the dust grains will lead to changes in the dust/gas ratio, due to movement of the grains from one zone to another, as well as because of grain destruction. Here we estimate the drift velocities of grains.
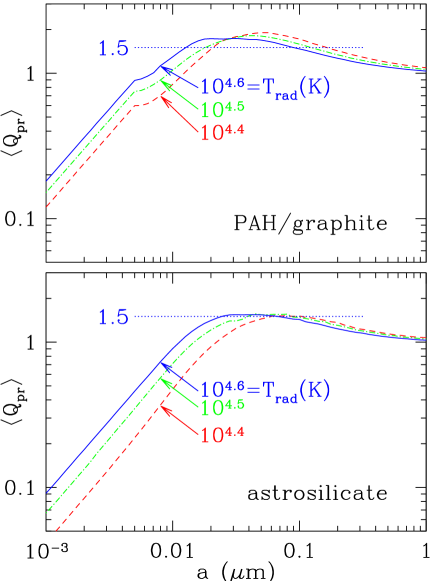
Let be the radiation pressure cross section for a grain of radius . Figure 7 shows averaged over blackbody radiation fields with , 32000 K, and 40000 K, for carbonaceous grains and amorphous silicate grains. For spectra characteristic of O stars, for .
If the magnetic field , the terminal velocity for a grain at distance is determined by balancing the forces due to radiation pressure and gas drag:
| (24) |
where the drag function , including both collisional drag and Coulomb drag, can be approximated by (Draine & Salpeter 1979)
| (25) | |||||
| (26) |
where is the grain potential, , and . The drag force from the electrons is smaller than that from the ions by at least , and can be neglected. The charge on the grains will be determined by collisional charging and photoelectric emission. Collisional charging would result in (Spitzer 1968), or . Photoelectric charging will dominate close to the star, but is expected to result in potentials . Taking and as representative,
| (27) |
Note that is not monotonic: as increases from 0, reaches a peak value for , but then begins to decline with increasing as the Coulomb drag contribution falls. At sufficiently large , the direct collisional term becomes large enough that rises above and continues to rise thereafter.
The drag time for a grain of density in H II gas is
| (28) |
For this is sufficiently short that each grain can be assumed to be moving at its terminal velocity , with isothermal Mach number determined by the dimensionless equation
| (29) |
Eq. (29) is solved to find . For , there are three values of for which the drag force balances the radiation pressure force. The intermediate solution is unstable; we choose the smaller solution,333 This solution is physically relevant if the drift speed began with and increased with time. which means that undergoes a discontinuous jump from to at . The resulting terminal velocity is shown in Figure 8 for 7 values of . The velocities in the interior can be very large, but the velocities where most of the dust is located [] are much smaller.
In the outer part of the bubble, where most of the gas and dust are located, the drift velocities are much more modest. This is visible in Fig. 8a, where the drift speeds become small as , but is more clearly seen in Fig. 8b, showing drift speeds as a function of normalized optical depth. The range contains more than 50% of the dust, and throughout this zone the drift speeds are even for as large as . With drift speeds , grains will not be destroyed, except perhaps by shattering in occasional collisions between grains with different drift speeds. However, for large values of , these grains are located close to the boundary, the drift times may be short, and the grains may be driven out of the H II and into the surrounding shell of dense neutral gas. This will be discussed further below.


4.2 Magnetic Fields
Let be the ratio of magnetic pressure to gas pressure. The importance of magnetic fields for the grain dynamics is determined by the dimensionless ratio , where is the gyrofrequency for a grain with charge and mass in a magnetic field :
| (30) |
If and , then for .
Let the local magnetic field be . The steady-state drift velocity is
| (31) | |||||
| (32) | |||||
| (33) | |||||
| (34) |
where , , are the radial and transverse components. If , the magnetic field does not affect the radiation-pressure-driven drift velocity, but in the limit magnetic effects can strongly suppress the radial drift if and .
The magnetic field strength is uncertain, but it is unlikely that the magnetic energy density will be comparable to the gas pressure; hence . From eq. (30) it is then apparent that if the magnetic field is strong (), magnetic effects on the grain dynamics can be important in low density H II regions, but will not be important for very high densities: for .
4.3 Drift Timescale
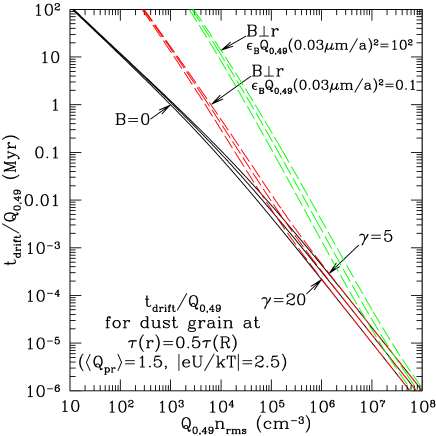
When radiation pressure effects are important, the gas and dust are concentrated in a shell that becomes increasingly thin as is increased. The drift velocities where most of the dust is located are not large (see Fig. 8b), but the grains are also not far from the ionization front. The timescale on which dust drift would be important can be estimated by calculating the drift velocity at the radius defined by . More than 50% of the dust has . Figure 9 shows the characteristic drift time
| (35) |
If no magnetic field is present, the drift velocity depends only on and the dimensionless quantities (see eq. 29). It is easy to see that for fixed and , the radius , thus . Figure 9 shows . For , H II regions with have if magnetic effects are negligible. If a magnetic field is present with and , then the grain drift is slowed, but drift times of are found for . Therefore, compact and ultracompact H II regions around single O stars are able to lower the dust/gas ratio by means of radial drift of the dust on time scales of . However, if the O star is moving relative to the gas cloud with a velocity of more than a few , then individual fluid elements pass through the ionized zone on timescales that may be shorter than the drift timescale, precluding substantial changes in the dust-to-gas ratio.
Grain removal by drift can also occur for giant H II regions. As an example, consider a giant H II region ionized by a compact cluster of O stars emitting ionizing photons at a rate . For , we have , and we see that if , the drift timescale is only . If a magnetic field is present with and , then from Figure 9 the drift timescale is increased, but only to . It therefore appears possible for radiation-pressure driven drift to remove dust from giant H II regions provided they are sufficiently dense.
Aside from magnetic effects, the drift speeds at a given location depend only on and (see eq. 29). Figure 7 shows that is constant to within a factor 1.5 for . Hence radiation-pressure-drive drift would act to drive grains with outwards. Smaller grains will drift as well, but more slowly. Because of this, the gas-to-dust ratio in the centers of H II regions should in general be lower than the gas-to-dust ratio in the gas prior to ionization. The dust-to-gas ratio will first be reduced in the center, where the drift speeds (see Fig. 8) are large. Dust drift will also alter the dust-to-gas ratio in the outer ionized material, initially raising it by moving dust outwards from the center. In an initially uniform neutral cloud, the ionization front expands rapidly at early times (see, e.g., Fig. 37.3 in Draine 2011) but in gas with , at late times the ionization front will slow to velocities small enough for dust grains to actually drift outward across the ionization front, lowering the overall dust-to-gas ratio within the H II region.
4.4 Grain Destruction
Arthur et al. (2004) computed models of uniform density H II regions including the effects of dust destruction by sublimation or evaporation, finding that the dust/gas ratio can be substantially reduced near the star. If the maximum temperature at which a grain can survive is , and the Planck-averaged absorption efficiencies are and for and , then grains will be destroyed within a distance with
| (36) |
For parameters of interest (e.g., , ) we find for , and sublimation would therefore destroy only a small fraction of the dust.
As we have seen, we expect radiation pressure to drive grains through the gas, with velocity given by eq. (31). Drift velocities will lead to sputtering by impacting He ions, with sputtering yield for (Draine 1995). For hypersonic motion, the grain of initial radius will be destroyed after traversing a column density
| (37) |
for a grain density , appropriate for either silicates (e.g., FeMgSiO4, ) or carbonaceous material (). Therefore the dust grain must traverse material with (initial) dust optical depth
| (38) |
if it is to be substantially eroded by sputtering. However, Fig. 8b shows that even in the absence of magnetic effects, occurs only in a central region with . Therefore sputtering arising from radiation-pressure-driven drift will not appreciably affect the dust content.
5 Discussion
5.1 Absorption of Ionizing Photons by Dust

For a sample of 13 Galactic H II regions, Inoue (2002) used infrared and radio continuum observations to obtain the values of shown in Figure 10. The estimated values of are much larger than would be expected for uniform H II regions with dust-to-gas ratios comparable to the values found in neutral clouds. Inoue (2002) concluded that the central regions of these H II regions must be dust-free, noting that this was likely to be due to the combined effects of stellar winds and radiation pressure on dust. As seen in Fig. 10, the values of found by Inoue are entirely consistent with what is expected for static H II regions with radiation pressure for (corresponding to ), with no need to appeal to stellar winds or grain destruction.
5.2 The Density-Size Correlation for H II Regions
H II regions come in many sizes, ranging from H II regions powered by a single O star, to giant H II regions ionized by a cluster of massive stars. The physical size of the H II region is obviously determined both by the total ionizing output provided by the ionizing stars, and the r.m.s. density of the ionized gas, which is regulated by the pressure of the confining medium. With the balance between photoionization and recombination determining the size of an H II region, an anticorrelation between size and density is expected, and was observed as soon as large samples of H II regions became available (e.g., Habing & Israel 1979; Kennicutt 1984). For dustless H II regions, one expects for fixed , but for various samples relations close to were reported (e.g., Garay et al. 1993; Garay & Lizano 1999; Kim & Koo 2001; Martín-Hernández et al. 2005). For ultracompact H II regions, Kim & Koo (2001) attribute the trend to a “champagne flow” and the hierarchical structure of the dense gas in the star-forming region, but Arthur et al. (2004) and Dopita et al. (2006) argue that the trend is a result of both absorption by dust and radiation pressure acting on dust in static H II regions.
Hunt & Hirashita (2009) recently reexamined the size-density relationship. They interpreted the size-density relation for different observational samples in terms of models with different star formation rates [and hence different time evolution of the ionizing output ], and differences in the density of the neutral cloud into which the H II region expands. Their models did not include the effects of radiation pressure on dust; at any time the ionized gas in an H II region was taken to have uniform density, resulting in overestimation of the dust absorption.
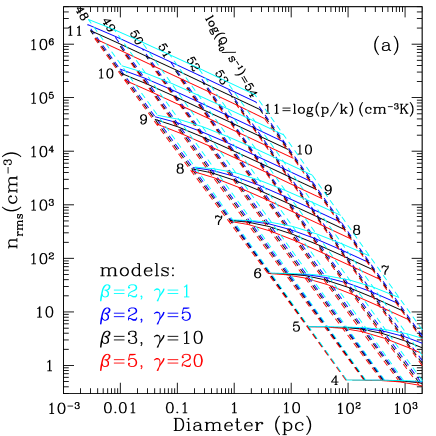
Figure 11a shows a grid of vs. for the present models, for four combinations of . While differences between the models with different can be seen, especially for high and high , the overall trends are only weakly dependent on and , at least for .
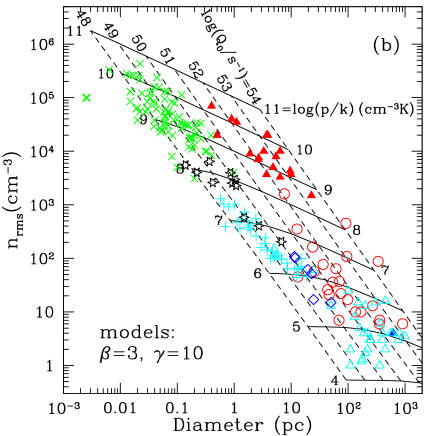
Figure 11b shows the model grid for and together with observed values of and from a number of different studies. It appears that observed H II regions – ranging from H II regions ionized by one or at most a few O stars () to “super star clusters” powered by up to O stars () can be accomodated by the present static equilibrium models with external pressures in the range . Note that for diameters , the assumption of static equilibrium is unlikely to be justified, because the sound-crossing time becomes longer than the lifetimes of high-mass stars.
The fact that some H II region samples (e.g., Garay et al. 1993; Kim & Koo 2001) seem to obey a relationship appears to be an artifact of the sample selection. We see in Fig. 11b that the overall sample of H II regions does not have a single -vs.- relationship. But the observations appear to be generally consistent with the current models of dusty H II regions.
5.3 Cavities in H II Regions: N49
Even without dust present, radiation pressure from photoelectric absorption by H and He can alter the density profile in a static H II region, lowering the central density and enhancing the density near the edge of the ionized region (see Fig. 2a). As seen in Figure 4a, for large values of the surface brightness profile can be noticeably flattened. If dust is assumed to be present, with properties typical of the dust in diffuse clouds, the equilibrium density profile changes dramatically, with a central cavity surrounded by a high-pressure shell of ionized gas pushed out by radiation pressure. In real H II regions, fast stellar winds will also act to inflate a low-density cavity, or “bubble”, near the star; the observed density profile will be the combined result of the stellar wind bubble and the effects of radiation pressure.
The GLIMPSE survey (Churchwell et al. 2009) has discovered and catalogued numerous interstellar “bubbles”. An example is N49 (Watson et al. 2008), with a ring of free-free continuum emission at 20 cm, surrounded by a ring of PAH emission. An O6.5V star is located near the center of the N49 ring. The image is nearly circularly symmetric, with only a modest asymmetry that could be due to motion of the star relative to the gas. The 20 cm image has a ring-peak-to-center intensity ratio .
Is the density profile in N49 consistent with what is expected for radiation pressure acting on dust? From the 2.89 Jy flux from N49 at cm (Helfand et al. 2006) and distance (Churchwell et al. 2006), the stellar source has . If , then . The H II region, with radius deg, has . Hence . If , then . From Fig. 6a we confirm that for .
Figure 5d shows that an H II region with is expected to have a central minimum in the emission measure, but with for , whereas the observed . The central cavity in N49 is therefore significantly larger than would be expected based on radiation pressure alone. While the effects of radiation pressure are not negligible in N49, the observed cavity must be the result of the combined effects of radiation pressure and a dynamically-important stellar wind (which is of course not unexpected for an O6.5V star).
5.4 Lyman-
The original ionizing photon deposits a radial momentum at the point where it is absorbed by either a neutral atom or a dust grain. A fraction () of the ionizing photons are absorbed by dust; this energy is reradiated isotropically, with no additional force exerted on the emitting material. Because the infrared optical depth within the H II region is small, the infrared emission escapes freely, with no dynamical effect within the H II region.
A fraction of the ionizing energy is absorbed by the gas. Subsequent radiative recombination and radiative cooling converts this energy to photons, but the isotropic emission process itself involves no net momentum transfer to the gas. We have seen above that the H II can have a center-to-edge dust optical depth for , or (cf. Fig. 5c with , ). This optical depth applies to the ionizing radiation; the center-to-edge optical depth for the Balmer lines and collisionally-excited cooling lines emitted by the ionized gas will be significantly smaller, and much of this radiation will escape dust absorption or scattering within the H II region. That which is absorbed or scattered will exert a force on the dust at that point only to the extent that the diffuse radiation field is anisotropic. We conclude that momentum deposition from the Balmer lines and collisionally-excited cooling lines within the ionized zone will be small compared to the momentum deposited by stellar photons.
Lyman- is a special case. At low densities (), of Case B recombinations result in emission of a Ly- photon, increasing to for as a result of collisionally-induced transitions (Brown & Mathews 1970). After being emitted isotropically, the photon may scatter many times before either escaping from the H II or being absorbed by dust. Most of the scatterings take place near the point of emission, while the photon frequency is still close to line-center. On average, the net radial momentum transfer per emitted photon will likely be dominated by the last scattering event before the photon escapes from the H II region, or by the dust absorption event if it does not. At a given point in the nebula, the incident photons involved in these final events will be only moderately anisotropic. Since there is less than one Ly- photon created per case B recombination, the total radial momentum deposited by these final events will be a small fraction of the radial momentum of the original ionizing photons. Henney & Arthur (1998) estimate that dust limits the Ly- radiation pressure to of the gas pressure. We conclude that Ly- has only a minor effect on the density profile within the ionized zone.
5.5 H II Region Expansion
H II regions arise when massive stars begin to emit ionizing radiation. The development of the H II region over time depends on the growth of the ionizing output from the central star, and the expansion of the initially-high pressure ionizing gas. Many authors (e.g., Kahn 1954; Spitzer 1978) have discussed the development of an H II region in gas that is initially neutral and uniform. If the ionizing output from the star turns on suddenly, the ionization front is initially “strong R-type”, propagating supersonically without affecting the density of the gas, slowing until it becomes “R-critical”, at which point it makes a transition to “D-type”, with the ionization front now preceded by a shock wave producing a dense (expanding) shell of neutral gas bounding the ionized region.
While the front is R-type, the gas density and pressure are essentially uniform within the ionized zone. When the front becomes D-type, a rarefaction wave propagates inward from the ionization front, but the gas pressure (if radiation pressure effects are not important) remains relatively uniform within the ionized region, because the motions in the ionized gas are subsonic.
When radiation pressure effects are included, the instantaneous density profile interior to the ionization front is expected to be similar to the profile calculated for the static equilibria studied here. Let be the velocity of the ionization front relative to the star. When the ionization front is weak D-type, the velocity of the ionization front relative to the ionized gas just inside the ionization front is (Spitzer 1978). Given the small dust drift velocities near the ionization front (i.e., in Fig. 8), dust is unable to drift outward across the ionization front as long as the ionization front is propagating outward with a speed (relative to the ionized gas)
6 Summary
-
1.
Dusty H II regions in static equilibrium consist of a three-parameter family of similarity solutions, parametrized by parameters , , and a third parameter, which can be taken to be or (see eq. 16). The parameter (eq. 6) characterizes the relative importance of photons, and (eq. 7) characterizes the dust opacity. A fourth parameter – e.g., the value of or – determines the overall size and density of the H II region.
-
2.
Radiation pressure acting on both gas and dust can strongly affect the structure of H II regions. For dust characteristic of the diffuse ISM of the Milky Way, static H II regions with will have nearly uniform density, but when , radiation pressure acts to concentrate the gas in a spherical shell.
-
3.
For given and , the importance of radiation pressure is determined mainly by the parameter (see eq. 16). When , radiation pressure will produce a noticeable central cavity.
-
4.
If the dust-to-gas ratio is similar to the value in the Milky Way, then compression of the ionized gas into a shell limits the characteristic ionization parameter: , even for (see Fig. 3).
-
5.
For , compression of the gas and dust into an ionized shell leads to a substantial increase (compared to the estimate by Petrosian et al. 1972) in the fraction of photons that actually ionize H, relative to what would have been estimated for a uniform density H II region, as shown in Fig. 6. Eq. (21) allows to be estimated for given , , and . Galactic H II regions appear to have values of consistent with the present results for H II regions with radiation pressure (see Fig. 10).
-
6.
Interstellar bubbles surrounding O stars are the result of the combined effects of radiation pressure and stellar winds. For the N49 bubble, as an example, the observed ring-like free-free emission profile is more strongly peaked than would be expected from radiation pressure alone, implying that a fast stellar wind must be present to help create the low-density central cavity.
-
7.
For static H II regions, dust drift would be important on time scales for . Real H II regions are not static, and the dust will not drift out of the ionized gas because the ionization front will generally be propagating (relative to the ionized gas just inside the ionization front) faster than the dust drift speed (see Fig. 8).
References
- Arthur et al. (2004) Arthur, S. J., Kurtz, S. E., Franco, J., & Albarrán, M. Y. 2004, ApJ, 608, 282
- Brown & Mathews (1970) Brown, R. L., & Mathews, W. G. 1970, ApJ, 160, 939
- Churchwell et al. (2009) Churchwell, E., et al. 2009, PASP, 121, 213
- Churchwell & Goss (1999) Churchwell, E., & Goss, W. M. 1999, ApJ, 514, 188
- Churchwell et al. (2006) Churchwell, E., et al. 2006, ApJ, 649, 759
- Dopita et al. (2006) Dopita, M. A., et al. 2006, ApJ, 639, 788
- Dopita et al. (2003) Dopita, M. A., Groves, B. A., Sutherland, R. S., & Kewley, L. J. 2003, ApJ, 583, 727
- Draine (1995) Draine, B. T. 1995, Ap&SS, 233, 111
- Draine (2011) —. 2011, Physics of the Interstellar and Intergalactic Medium (Princeton, NJ: Princeton University Press)
- Draine & Salpeter (1979) Draine, B. T., & Salpeter, E. E. 1979, ApJ, 231, 77
- Gail & Sedlmayr (1979) Gail, H. P., & Sedlmayr, E. 1979, A&A, 77, 165
- Garay & Lizano (1999) Garay, G., & Lizano, S. 1999, PASP, 111, 1049
- Garay et al. (1993) Garay, G., Rodriguez, L. F., Moran, J. M., & Churchwell, E. 1993, ApJ, 418, 368
- Habing & Israel (1979) Habing, H. J., & Israel, F. P. 1979, ARA&A, 17, 345
- Helfand et al. (2006) Helfand, D. J., Becker, R. H., White, R. L., Fallon, A., & Tuttle, S. 2006, AJ, 131, 2525
- Henney & Arthur (1998) Henney, W. J., & Arthur, S. J. 1998, AJ, 116, 322
- Hunt & Hirashita (2009) Hunt, L. K., & Hirashita, H. 2009, A&A, 507, 1327
- Inoue (2002) Inoue, A. K. 2002, ApJ, 570, 688
- Kahn (1954) Kahn, F. D. 1954, Bull. Astron. Inst. Netherlands, 12, 187
- Kennicutt (1984) Kennicutt, Jr., R. C. 1984, ApJ, 287, 116
- Kim & Koo (2001) Kim, K., & Koo, B. 2001, ApJ, 549, 979
- Krumholz & Matzner (2009) Krumholz, M. R., & Matzner, C. D. 2009, ApJ, 703, 1352
- Martín-Hernández et al. (2005) Martín-Hernández, N. L., Vermeij, R., & van der Hulst, J. M. 2005, A&A, 433, 205
- Martins et al. (2005) Martins, F., Schaerer, D., & Hillier, D. J. 2005, A&A, 436, 1049
- Mathews (1967) Mathews, W. G. 1967, ApJ, 147, 965
- Mathews (1969) —. 1969, ApJ, 157, 583
- Petrosian et al. (1972) Petrosian, V., Silk, J., & Field, G. B. 1972, ApJ, 177, L69
- Savedoff & Greene (1955) Savedoff, M. P., & Greene, J. 1955, ApJ, 122, 477
- Spitzer (1968) Spitzer, L. 1968, Diffuse matter in space (New York: Interscience)
- Spitzer (1978) —. 1978, Physical Processes in the Interstellar Medium (New York: Wiley)
- Strömgren (1939) Strömgren, B. 1939, ApJ, 89, 526
- Watson et al. (2008) Watson, C., et al. 2008, ApJ, 681, 1341
- Weingartner & Draine (2001) Weingartner, J. C., & Draine, B. T. 2001, ApJ, 548, 296
- Zubko et al. (2004) Zubko, V., Dwek, E., & Arendt, R. G. 2004, ApJS, 152, 211