email:gemma.janssen@manchester.ac.uk 22institutetext: Astronomical Institute “Anton Pannekoek”, University of Amsterdam, Postbus 94249, 1090 GE Amsterdam, The Netherlands; 33institutetext: Stichting ASTRON, Postbus 2, 7990 AA Dwingeloo, The Netherlands 44institutetext: SRON, Sorbonnelaan 2, 3584 CA Utrecht, The Netherlands 55institutetext: Department of Astrophysics/IMAPP, Radboud University Nijmegen, PO Box 9010, 6500 GL Nijmegen, The Netherlands 66institutetext: Laboratoire de Physique et Chimie de l’Environnement, CNRS, 3A Avenue de la Recherche Scientifique, F-45071 Orléans, Cedex 2, France 77institutetext: Max-Planck-Institut für Radioastronomie, Auf dem Hügel 69, 53121 Bonn, Germany 88institutetext: Galaxies, Étoiles, Physique, Instrumentation, CNRS URA 1757, 92195 Meudon Principal Cedex, France
Long-term timing of four millisecond pulsars
We have timed four millisecond pulses, PSRs J17212457, J17450952, J18102005, and J19180642, for up to a total of 10.5 years each using multiple telescopes in the European Pulsar Timing Array network: the Westerbork Synthesis Radio Telescope in The Netherlands, the Nançay Radio Telescope in France and the Lovell telescope at Jodrell Bank in the UK. The long time span has enabled us to measure the proper motions of J17450952 and J19180642, indicating that they have transverse velocities of 200(50) and 54(7) km s-1respectively. We have obtained upper limits on the proper motion of J17212457 and J18102005, which imply that they have transverse velocities less than 140 and 400 km s-1respectively. In all cases, the velocities lie in the range typical of millisecond pulsars. We present pulse profiles for each pulsar taken from observations at multiple frequencies in the range of 350 to 2600 MHz, and show that J18102005 shows significant profile evolution in this range. Using our multi-frequency observations, we measured the spectral indices for all four pulsars, and for J18102005 it appears to be very flat. The flux density of J19180642 shows extensive modulation which we attribute to the combined effects of refractive and diffractive scintillation. We discuss the possible use of including J17212457 or J19180642 in a pulsar timing array, and find that J19180642 will be useful to include when the timing precision of this pulsar is improved over the next few years. We have searched archival optical observations to detect companions of the binary pulsars, but none were detected. However, we provide lower limits on the masses of the white dwarf companions of PSRs J17450952 and J19180642.
Key Words.:
stars: neutron – pulsars: general – pulsars: individual: J17212457, J17450952, J18102005, J191806421 Introduction
In this paper we present improved timing solutions for four millisecond pulsars (MSPs): PSRs J17212457, J17450952, and J19180642, discovered by Edwards & Bailes (2001), and J18102005, that was discovered by Camilo et al. (2001). Long-term timing of MSPs is an important tool to determine masses of the individual stars in binary systems, and by constraining secular effects like proper motion, it can be used to improve statistics on the evolution of these systems.
In general, masses of pulsars are not easy to determine. In some cases, when the pulsar is in a binary with another compact object, high precision pulsar timing observations on extended timescales can allow for detecting post-Keplerian parameters of the systems, which can be used to separately measure the individual masses of the stars. Space velocities derived from proper motion measurements of radio pulsars give clues about the evolution of these systems and their birth supernovae (e.g. Toscano et al. (1999); Hobbs et al. (2005); Lorimer (2008)). It is believed that recycled pulsars have lower space velocities than normal, slowly rotating pulsars. However as MSPs are generally the most stable rotators, the effects of their space velocities on their rotational and orbital parameters will be easier to derive from timing measurements of those systems and could be used to deduce the intrinsic properties of the stars.
Another interesting and important use of timing MSPs to high precision, is the formation of a pulsar timing array (PTA, e.g. Hobbs et al. 2008; Janssen et al. 2008b). An instrument like this will use an array of MSPs as the endpoints of a Galaxy-scale gravitational wave (GW) detector. Current estimates predict that to detect a GW background, long-term high precision timing of about 20 MSPs is required (Jenet et al. 2005; Van Haasteren et al. 2008). Increasing the number of stable MSPs in the array will improve the detection significance. In order to better understand these systems in general, and to determine their suitability for inclusion in a timing array, their long-term timing behaviour needs to be determined. Moreover, the best frequency at which they should be timed needs to be ascertained. This is a combination of the pulse shape at these frequencies and their intensity. We observed all four pulsars at additional frequecies to find their best possible observing frequency for timing purposes, and discuss their suitability for inclusion in a PTA.
Three of the pulsars that are presented in this paper are in low-eccentricity binary systems with white dwarf companions (see Table 1). These systems are usually classified as low-mass binary pulsars (LMBPs). The LMBPs distinguish themselves from intermediate-mass binary pulsars (IMBPs) in having shorter periods ( ms), very low eccentricities (), and they follow relationships between their orbital period and the eccentricity of their orbit, and their orbital period and the companion mass (Thorsett & Chakrabarty 1999). The origin of the difference between these two classes of binary MSPs is believed to be an evolutionary effect, and mainly due to the progenitor masses of the companion stars. There are now 65 MSP binary pulsars with probable white dwarf companions known (e.g. Lorimer 2008) and about 16 of these can be regarded as IMBP candidates (Jacoby et al. 2006).
Detecting an optical counterpart to one of the binary pulsars allows to derive properties of their white dwarf companions. Because of differences in the cooling properties of white dwarfs in LMBPs and IMBPs, optical observations can in some cases be used to distinguish between the two classes (e.g. van Kerkwijk & Kulkarni 1995). So far, for all three binary pulsars described in this paper, the most recently published limit on optical magnitude of the companion is (van Kerkwijk et al. 2005).
2 Pulsar timing observations and data analysis
2.1 Westerbork
The pulsars were observed approximately monthly using the pulsar machines at the Westerbork Synthesis Radio Telescope (WSRT): PuMa (Voûte et al. 2002) since August 1999, and PuMaII (Karuppusamy et al. 2008) since August 2006. The WSRT has three frequency ranges allocated for pulsar timing; for observations centred at 350 MHz we use two bands of 10 MHz wide, and observations centred at 1380 or 2300 MHz use 80 MHz of bandwidth, spread in 8 steps of 10 MHz over a range of 160 MHz. The new pulsar machine uses the full 80 MHz bandwidth at the low frequencies, and all of the available 160 MHz bandwidth at 1380 and 2300 MHz. For all four pulsars presented here, we mainly used the 1380 MHz band as the pulsars were detected in this band, and there are no other reports of detections in other bands. Also this is the best available band for timing at the WSRT as it has the best sensitivity. For completeness, we observed all pulsars for one hour at 350 and 2300 MHz, see Fig 1.
For a complete description of the PuMa data analysis, we refer to Janssen et al. (2008a). Analysis of the PuMaII data was carried out using the PSRCHIVE (Hotan et al. 2004) software suite. For both instruments, each profile was cross-correlated with a standard profile at the corresponding observing frequency (Fig. 1), obtained from the summation of high signal-to-noise (S/N) profiles, to calculate a time of arrival (TOA) for each observation. These were referred to local time using time stamps from a H-maser at WSRT and converted to UTC using global positioning system (GPS) maser offset values measured at the observatory, and GPS to UTC corrections from the Bureau International des Poids et Mesures (BIPM)111http://www.bipm.org. The TOAs were converted to the Solar system barycentre using the JPL ephemeris DE405222ftp://ssd.jpl.nasa.gov/pub/eph/export/DE405/de405iom.ps. We used the tempo2 timing software package (Hobbs et al. 2006) to analyse the data.
Flux densities were calculated for the WSRT observations by using the aforementioned bandwidth and observing times, the measured S/N ratio for each profile, the gain of the WSRT (1.2 K/Jy), the pulse duty cycle (10%), the system temperature and the pulsar specfic radiometer equation (Dewey et al. 1985). The total system temperature was determined from the synthesis data that is taken in parallel with the pulsar observations.
2.2 Nançay
PSR J17212457, J17450952 and J19180642 were observed roughly every 3 to 4 weeks with the Nançay Radio Telescope (NRT) since 2006.
Equivalent to a 93-m dish, the Nançay Radio Telescope and the BON (Berkeley-Orléans-Nançay) coherent dedispersor were used for typical integration times of 45 min. Coherent dedispersion of a 64 MHz band centred on 1398 MHz was carried out on sixteen 4 MHz channels using a PC-cluster in the period covered by the observations. The Nançay data are written with timestamps which are directly tied to UTC(GPS) in realtime, using a Thunderbolt receiver (Trimble Inc.), when converting from an analogue to digital signal is performed. Differences between UTC and UTC(GPS) are less than 10 ns at maximum, and therefore no laboratory clock corrections are needed. One TOA was calculated from a cross-correlation with a pulse template for each observation of 45 min.
The flux densities for the Nançay data were calculated in a similar way to those for the WSRT except that the system temperature was determined from the known receiver temperature and sky temperature in the direction of the source. The gain of the NRT is 1.4 K/Jy.
2.3 Jodrell Bank
PSR J18102005 was observed at Jodrell Bank since November 1997, and PSR J19180642 since February 2008. Both pulsars were observed every two weeks at a centre frequency around 1400 MHz. The gain of the Lovell telescope is 1 K/Jy.
The polarized signals from the receiver were were fed into an analogue filterbank system with MHz channels, and filtered and digitised at appropriate sampling intervals and incoherently dedispersed in hardware. The resulting dedispersed timeseries were folded on-line with the topocentric pulsar period and finally written to disc. In the off-line reduction, the two polarisations were summed to form total-intensity profiles. A standard high S/N pulse template was used to determine a TOA for each observation. During this process, TOAs were referred to the local H-maser time-standard and already corrected to UTC using information obtained via the GPS.
3 Pulsar timing results and discussion
| Pulsar name | J17212457 | J17450952 | J18102005 | J19180642 |
|---|---|---|---|---|
| Fit and data-set | ||||
| MJD range | 52076–54799 | 52076—54776 | 50757–54796 | 52094-54814 |
| Number of TOAs | 120 | 113 | 491 | 152 |
| Rms timing residual (s) | 31.9 | 20.8 | 270.7 | 2.6 |
| Weighted fit | Y | Y | Y | Y |
| Reduced valuea | 1.05 | 1.02 | 1.01 | 1.04 |
| Measured Quantities | ||||
| Right ascension, (J2000) | 17h21m054963(3) | 17h45m091348(2) | 18h10m589919(6) | 19h18m48035270(13) |
| Declination, (J2000) | 24°57′0636(6) | 09°52′39682(15) | 20°05′0827(14) | 06°42′348636(6) |
| Pulse frequency, (s-1) | 285.989343507338(15) | 51.609431233273(5) | 30.467142155106(7) | 130.7895141841235(6) |
| First derivative of pulse frequency, (s-2) | 4.533(5) | 2.4627(13) | 1.3684(11) | 4.39525(17) |
| Dispersion measure, DM (cm-3pc) | 48.34(3) | 64.27(9) | 241.0(3) | 26.554(10) |
| Proper motion in RA, (mas yr-1) | 1.8(1.8) | 21.2(1.1) | 0(2) | 7.20(10) |
| Proper motion in DEC, (mas yr-1) | 14(25) | 11(5) | 17(37) | 5.7(3) |
| Binary | ELL1 | ELL1 | ELL1 | |
| Orbital period, (d) | 4.943453386(12) | 15.01201911(4) | 10.9131777486(12) | |
| Projected semi-major axis of orbit, (lt-s) | 2.378599(5) | 11.977880(18) | 8.3504716(4) | |
| TASC (MJD) | 53198.621445(3) | 53195.528458(4) | 53402.53135510(8) | |
| EPS1 () | 0.000009(3) | 0.000009(3) | 0.00001244(9) | |
| EPS2 () | 0.000004(4) | 0.000017(3) | 0.00001555(9) | |
| Set Quantities | ||||
| Epoch of frequency determination (MJD) | 53400.0 | 53200.0 | 53200.0 | 53400.0 |
| Epoch of position determination (MJD) | 53400.0 | 53200.0 | 53200.0 | 53400.0 |
| Epoch of DM determination (MJD) | 53400.0 | 53200.0 | 53200.0 | 53400.0 |
| Derived Quantities | ||||
| Orbital eccentricity, | - | 1.0(0.4) | 1.9(4) | 1.991(13) |
| Omega, = arctan ( () | - | 114(28) | 152(12) | 218.6(4) |
| Characteristic age, (Gyr) | 10.0 | 3.3 | 3.5 | 4.7 |
| Surface magnetic field strength, (G) | 1.4 | 13.5 | 22.4 | 4.4 |
| Distanceb, (kpc) | ||||
| Spin period (ms) | 3.49663 | 19.3763 | 32.8222 | 7.64587 |
| Spin period derivative | 5.55 | 9.23 | 1.47 | 2.57 |
| Mass function, (M⊙ ) | 0.000591270(4) | 0.00818737(4) | 0.0052494438(8) | |
| Minimum companion mass, (M⊙ ) | 0.11 | 0.28 | 0.24 | |
| Total proper motion, (mas yr-1) | 15(25) | 24(2) | 17(37) | 9.2(2) |
| Transverse velocity, VT (km s-1) | 200(50) | 54(7) | ||
| Assumptions | ||||
| Clock correction procedure | TT(TAI) | |||
| Solar system ephemeris model | DE405 | |||
| Model version number | 5.00 | |||
Note: Figures in parentheses are the nominal 1 tempo2
uncertainties in the least-significant digits quoted.
aBefore
combining the data sets from the different observatories, the errors
on the TOAs were scaled with a constant factor to have each individual
data set return a reduced . bThe DM distances are
estimated from the Cordes & Lazio (2002) model. c Velocity limits from
Eq. 1.
We present new timing solutions for the pulsars in Table 1, based on 7.5 to 10.5 years of radio pulsar timing as described in Sect. 2. The vast majority of our timing data were taken using a centre frequency around 1380 MHz, and therefore originally only the timing variation across the observing bandwidth was used to measure the dispersion measure (DM) of the four pulsars. As the combined data sets of WSRT and Nançay or Jodrell Bank together cover more than 200 MHz of bandwidth, the DM was already determined with good accuracy using only that data. However, to allow for refining the DM value even more, and to study the pulse shape and flux densities at other frequencies, we also observed the pulsars at 350 MHz and 2.3 GHz. This resulted in a few detections, see Fig. 1.
For PSRs J17450952, J18102005 and J19180642, all in very low-eccentricity binaries, we have used the ELL1 timing model (Lange et al. 2001) to avoid the high degree of covariance between the epoch and longitude of periastron.
We have measured significant proper motions for PSRs J19180642: = 9.2(2) mas yr-1 and J17450952: = 24(2) mas yr-1. By combining those proper motions with the DM-derived distances from the Cordes & Lazio 2002 model, we have calculated transverse velocities for those systems. For the other two pulsars, we use the marginally significant values from the timing solution to calculate a limit on their transverse velocities, see Sect. 3.1.
3.1 Proper motion and velocity
We use our proper motion measurements to derive transverse velocities, or limits on those, for all four pulsars (see Table 1). We have a highly significant measurement of the proper motion of PSR J19180642, and a significant detection in right ascension for PSR J17450952. The proper motion values as presented for the other two pulsars are not significant. We note that both PSR J17212457 and J18102005 have ecliptic latitudes very close to the ecliptic plane ( and respectively), and therefore their proper motions may be better and more independently fit in ecliptic parameters. However, as the coordinate systems are nearly parallel because both pulsars are near = 18h, fits in this coordinate system did not result in an improvement of the limits on their proper motions, or the significance of their positions. As both of these pulsars lie quite close to the ecliptic, it may be that they will show effects due to the solar wind (You et al. 2007). However at the present timing precision we see no influence on the observed TOAs.
Due to changes in the projected line of sight, transverse motions of pulsars can affect observed periodicities in the system (Shklovskii 1970). We present the contributions to the spin period derivative of each pulsar in Table 2. For completeness, the contributions to the observed from accelerations in the Galactic potential are also presented, although those are not important effects for these pulsars. To calculate the magnitude of the Shklovskii term we have used the total proper motion values as presented in Table 1. For PSR J19180642, the contribution to its spin period derivatives, , from proper motion is less than of the observed value. However for PSR J17450952, the effect can be as large as of the observed value, leading to an underestimation of the characteristic age and an overestimation of the magnetic field. Moreover, as the proper motions for the solitary pulsar J17212457 and PSR J18102005 have not been determined significantly yet, the Shlovskii term may even completely dominate the observed for those pulsars. To calculate an upper limit for the proper motion, and accordingly a limit to the transverse velocity, we can use the observed as a maximum:
| (1) |
This yields mas yr-1 and V km s-1for PSR J17212457 and mas yr-1 and V km s-1 for PSR J18102005.
About 50% of the known solitary and low-eccentricity binary pulsars have measured transverse velocities (Tables 2 and 4 in Lorimer 2008). Hobbs et al. (2005) quote mean values of 2D speeds of 77(16) km s-1 for solitary MSPs and 89(15) km s-1 for binary MSPs. Compared to those, the (limits on) transverse velocities that we have derived from the proper motion measurements represent normal velocities for recycled pulsars.
| PSR | ||||
|---|---|---|---|---|
| J17212457 | 5.55 | 4.0 | 4.4 | |
| J17450952 | 9.23 | 4.5 | 2.8 | |
| J18102005 | 1.47 | 1.1 | 1.8 | |
| J19180642 | 2.57 | 1.4 | 3.7 |
3.2 Profiles
Apart from our normal timing observing frequency of 1380 MHz, we have observed all four pulsars at additional frequencies: 350 MHz and 2300 MHz. The results are shown in Fig. 1. It is now standard procedure for WSRT timing observations of MSPs to use both pulsar machines, and as we have twice the bandwidth available in PuMaII, we present the profile of the detected pulsars at 350 MHz and 2.3 GHz from that data, see Fig. 1. Single observations of 55 min. were used to generate the profiles at 350 and 2300 MHz. Where no profile is plotted, the pulsar was not seen at that frequency. The profiles at 1380 MHz were generated using one year of regular timing observations and consist of 10 to 12 observations of 25 min, except for PSR J19180642, where again one observation of 55 min. was used. PSR J17450952 was detected with NRT at 2600 GHz in an observation of 50 min.
As reported by Kramer et al. (1998), for most MSPs there is very little development of pulse profiles with frequency, which can be explained by MSPs having a very compact magnetosphere. For all pulsars except PSR J18102005, we indeed see no changes in the pulse profile with changing frequency, except for changes in the ratios of the heights of some components, within the significance of our detections. Compared to its profile at 1380 MHz, the 2300 MHz profile of 1810 appears to have more components in the main peak. Also the profile appears to show a leading component about 70 degrees before the main peak, although higher S/N will be needed to confirm this. Of all the MSP profiles presented by Kramer et al. (1999) none show more complex profiles at higher frequencies than at lower frequencies. Thus a further study of the profile of PSR J18102005 and its polarisation properties could reveal more about MSP emission profiles. The extra features in the peak of the high-frequency profiles of PSR J18102005 could be an indication that the profile at 1380 MHz suffers from scattering effects. However, the Cordes & Lazio (2002) model predicts very little scattering for this pulsar at both 1380 MHz (0.26 ms) and 2300 MHz (0.03 ms) suggesting that the features in the main peak of the pulse profile are intrinsic to the pulsar. It may turn out that, when better sensitivity can be achieved at higher frequencies, PSR 18102005 will give better timing results compared with the more commonly used 1380 MHz as its profile shows more features at higher frequencies.

3.2.1 Useful for pulsar timing array?
PSR J17212457 shows very stable rotational behaviour. All parameters of the timing solution presented in Table 1 are consistent with the original timing solution as published by Edwards & Bailes (2001). However, for the present S/N ratio, the wide profile of this pulsar does not allow for the high timing precision that is required for PTA pulsars (Jenet et al. 2005).
In contrast, despite its relatively long spin period compared to most pulsars considered for PTA studies, PSR J19180642 may be worthwile to include. Already at 1380 MHz the profile has a very sharp peak, allowing for very precise timing over 7.5 years (rms = 2.3 s). Furthermore, it is possible that better results for pulsar timing arrays may be deduced by including not only the best-timing pulsars, but extending the PTA pulsar set with pulsars that have timing solution with rms s (Jenet et al. 2005; Van Haasteren et al. 2008). The pulse profile as shown in Fig. 1 was generated by the PuMaII machine in WSRT, promising even better timing precision in the ongoing timing programme. Observations with PuMaII use twice the bandwidth of those with PuMaI and so give an increase in the sensitivity. Moreover, because PuMaII uses coherent dedispersion, it yields a sharper profile. The combination of these effects should lead to an improvement in the timing precision of a factor between 2 and 4 for this pulsar over the next five years which may bring it to the required level for a PTA pulsar.
3.3 Flux density and scintillation
We calculated flux densities for the four pulsars as described in Sect. 2.1, based on the profiles as shown in Fig. 1, see Table 3. We note that apart from those at 21 cm, the profiles are generated from single observations only, and therefore the resulting flux densities should not be regarded as accurate measurements, but are indicative of the intensities of the pulsars at the observed frequencies. The spectral indices for these pulsars are normal except for PSR J18102005, which appears to have a relatively flat spectrum. We observed this pulsar a couple of times at 2.3 GHz, and the resulting flux densities were varying by a factor 2, indicating that the brightness of this pulsar may be affected by scintillation.
Not long after we began our observations of PSR J19180642 we noticed that there were a number of occasions when we either did not detect the pulsar at all or it was extremely bright. A plot of the flux densities determined from all observations is shown in Fig. 2.
The left hand panel shows a histogram of flux values from both Nançay and WSRT observations with the non-detections in the WSRT data shown in the far left hand bin. The right hand panel shows the variation in flux density as a function of time indicating the variations are typically on short timescales, although a long period of non-detections can be seen in 2006-2007. We note that the pulsar is not detected in approximately 20% of all WSRT observations. The pulsar is always detected, although sometimes with very low S/N ratio, in the Nançay data. This is not suprising due to the higher gain and longer integration times for the Nançay observations meaning that the NRT is approximately 30% more sensitive than the WSRT for this pulsar.
If these flux variations are due to scintillation then the quite frequent non-detections would suggest that the scintillation bandwidth must be at least as wide as the PuMaI bandwidth of 80 MHz. For the dispersion measure of this pulsar at this observing frequency such a large scintillation bandwidth seemed too large to be diffractive (Rickett 2001). Checking the literature, we found four pulsars with similar dispersion measures which had measured diffractive scintillation bandwidths in the range 15 – 70 MHz (Johnston et al. 1998; Wang et al. 2005) at 21 cm. While this is a large range the diffractive scintillation bandwidth would need to be above the highest measured value to explain the observed flux variations.
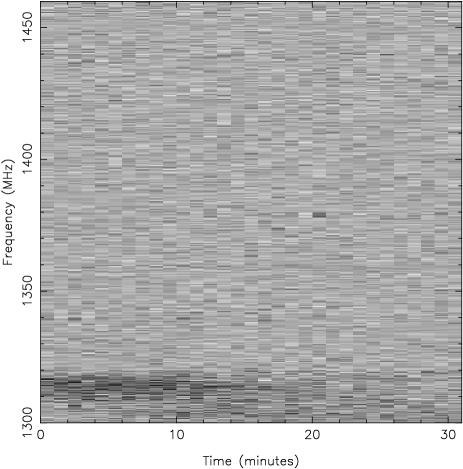
Using the improved bandwidth of our PuMaII measurements we were able to better explain the scintillation properties of PSR J19180642. In Fig. 3 we show the dynamic spectra from two observations of PSR J19180642, separated by just one month. The left hand side shows a classic case of scintillation with a scintillation bandwidth of approximately 5 MHz. Comparing this value to the range of bandwidths seen for similar dispersion measure pulsars, as discussed earlier, it is a factor of three smaller than the lowest measured scintillation bandwidth. In contrast, the right hand plot shows just a single scintle, which is perhaps somewhat broader than 5 MHz, across the full 160 MHz of bandwidth. It may be possible that these variations are purely statistical in nature, although the lack of any scintiles in the band of at least 80 MHz in width, appears to happen about 20% of the time. We note that Gupta et al. (1994) explain variations in the scintillation properties like this as being to the refractive modulation of the diffractive interstellar scintillation pattern. While beyond the scope of this paper, the techniques outlined by Gupta et al. (1994) could be used to further examine the relationship between the velocities in this system and the interstellar medium along the line of sight. We note also that very wide bandwidth observations of this pulsar provide the best opportunity to do high precision timing, as when the pulsar is bright it can be timed to high precision.
| PSR | S350 (mJy) | S1380 (mJy) | S2273 (mJy) | SI |
|---|---|---|---|---|
| J17212457 | 0.58(2) | 0.28(3) | -1.5(2) | |
| J17450952 | 1.8(3) | 0.38(3) | -1.14(12) | |
| J18102005 | 1.33(2) | 0.95(4) | -0.67(3) | |
| J19180642 | 5.9(6) | 0.58(2) | -1.67(6) |
*[0.5ex] Note: These numbers correspond to the WSRT profiles in Fig. 1. Measurements of flux densities at 350 and 2273 MHz, and PSR J19180642 at 1380 MHz are based on one or two 50 min. observations, and therefore should be regarded as indicative of the intensities of the pulsars at the observed frequencies only. The ranges in flux densities, and consequently, SI calculations, are now based on the uncertainties in duty cycles.


4 Optical observations

We have analysed archival observations of PSR J17450952 and PSR J18102005. These observations were obtained with the ESO Multi-Mode Instrument (EMMI) at the 3.6 m telescope of the European Southern Observatory at La Silla, Chile on March 15th, 2004. The instrument has two 2K4K detectors which were read out with binning, providing a pixel scale of pix-1. The observations consisted of two 10 min. -band exposures of PSR J17450952 and two 5 min. -band exposures for PSR J18102005. For both pulsars, these long exposures were preceded by short (10 s) exposures, also in the -band. The seeing during these observations was about to . All images were bias-subtracted and flat-fielded using twilight flats. The two deep images of each pulsar were averaged and used for further analysis.
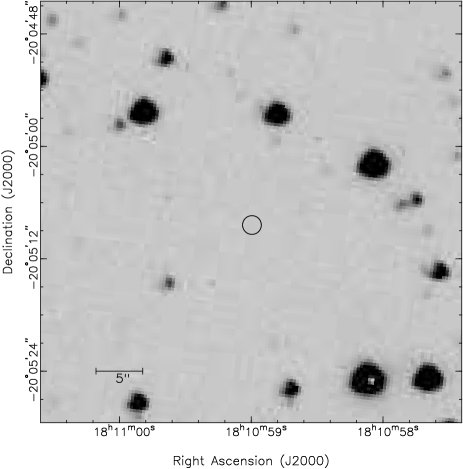
The short 10 s observations were astrometrically calibrated against the 2nd version of the USNO CCD Astrograph Catalog (UCAC2, Zacharias et al. 2004). For the PSR J17450952 observations, 34 UCAC2 stars overlapped with the chip on which the pulsar was located, of which 26 were not saturated and appeared stellar and unblended, giving rms residuals of in right ascension and in declination. A secondary astrometric catalog was created from the stars on the short exposure and used to calibrate the average of the two 10 min. exposures. For the transfer, about 300 stars were used, giving residuals of in right ascension and in declination. Combined with the uncertainty on the timing position of the pulsar, the quadratic uncertainty of the pulsar position on the deep optical image is in right ascension and in declination. For PSR J18102005, we used 23 of the 32 overlapping UCAC2 stars, giving rms residuals of in right ascension and in declination. The transfer of the secondary catalog to the deeper average of the two 5 min. 180 secondary standards, giving residuals of in right ascension and in declination. The final uncertainty on the pulsar position on the deep image is in right ascension and in declination. No sources are present in the error circles of both pulsars, as shown in Fig. 4.
In order to determine upper limits on the brightness of the pulsar companions, we performed PSF photometry on the averaged deep images using DAOPHOT II (Stetson 1987). The resulting instrumental magnitudes were calibrated against 47 standard stars in the PG 1525071 using the calibrated magnitudes of Stetson (2000). Since only -band observations were taken, only the zeropoint was fitted for the calibration, giving rms residuals of 0.02 mag. The standard La Silla -band extinction of 0.07 mag per airmass was used to correct for extinction between the standard observations taken at an airmass of 1.08 and the pulsar observations taken at an airmass of 1.34 (for PSR J17450952) and 1.25 (for PSR J18102005). Based on the magnitudes and uncertainties of faint stars in the images, we estimate the detection limit at for PSR J17450952 and for PSR J18102005.
4.1 Model predictions
Though no optical counterparts to PSR J17450952, PSR J18102005 and PSR J19180642 (, see van Kerkwijk et al. 2005) were detected, it is still worthwhile to compare the upper limits on the white dwarf magnitudes with those predicted by models. To convert the upper limits on the apparent magnitudes to limits on the absolute magnitude, we need estimates for the distance and absorption. Estimates for the distance to each pulsar using the observed dispersion measure and the Cordes & Lazio (2002) model for the Galactic distribution of electrons are given in Table 1. The -band absorption along the line-of-sight and at the distance of each pulsar was estimated using the Drimmel et al. (2003) model for Galactic extinction and converted to -band absorption using the extinction coefficients of Schlegel et al. (1998) (). We estimate upperlimits on the absolute -band magnitude of for PSR J17450952, for PSR J18102005 and for PSR J19180642.
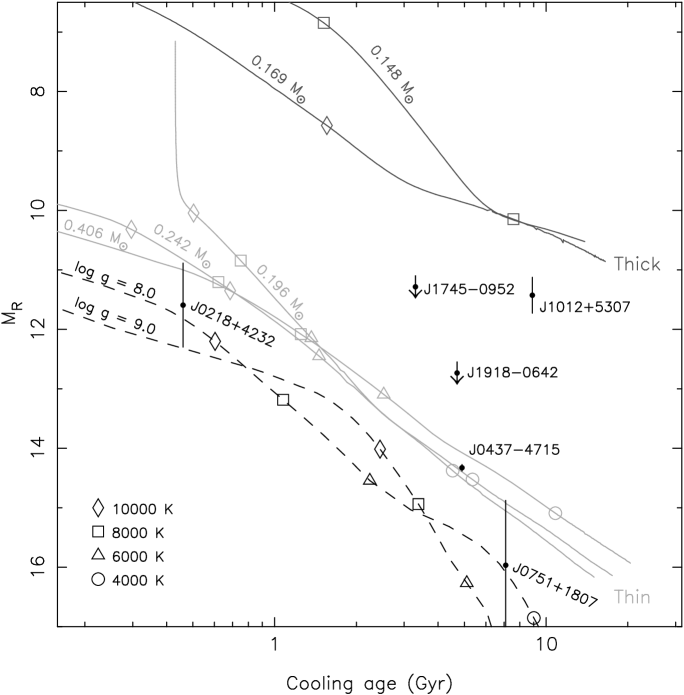
In Fig. 5 we show predictions of absolute magnitude and cooling ages from the white dwarf cooling tracks by Rohrmann et al. (2002) and Bergeron et al. (1995). The helium-core white dwarf cooling tracks show a dichotomy in the cooling properties of helium-core white dwarfs caused by differences in the thickness of the hydrogen layer surrounding the helium core of these white dwarfs (see, e.g. Schönberner et al. 2000; Althaus et al. 2001). White dwarfs heavier than 0.18–0.20 M⊙ have thin envelopes and cool faster than lighter white dwarfs which have thick envelopes. Cooling tracks appropriate for heavier carbon-oxygen white dwarfs with hydrogen-rich atmospheres are even fainter.
Under the assumption that the characteristic pulsar ages are equal to the white dwarf cooling ages, we plot the upper limits on our white dwarf pulsar companions and detections of others in Fig. 5. Because of the large distance and absorption towards PSR J18102005, the limit does not constrain any white dwarf parameters. For PSR J17450952 and PSR J19180642 the upper limits exclude white dwarfs with thick hydrogen envelopes. As such, the mass of the white dwarf in these systems is constrained to M⊙. For PSR J17450952 this mass limit, combined with the low massfunction of the system, constrains the inclination of the binary orbit to the low value of (assuming M⊙). Should this pulsar have a carbon-oxygen white dwarf, which is not excluded by the optical observations, the limit on the inclination will be even lower.
5 Conclusions
Using the WSRT, NRT and Lovell telescopes, we have timed four MSPs for 7.5 to 10.5 years. We have presented updated timing solutions, pulse profiles at multiple frequencies for each pulsar, and scintillation parameters for PSR J19180642. We have measured transverse velocities for PSRs J17450952 and J19180642, and set limits on the velocities of PSRs J17212457 and J18102005. All velocities are consistent with previously published distributions for solitary and binary MSPs.
We have analysed archival optical observations for the binary MSPs and found no companions to the pulsars. From the magnitde limits we deduce for the companions, we can exclude white dwarfs with thick atmospheres. This indicates that the companions must be heavier than about 0.2 M⊙ . At this point, the mass restrictions as well as the optical magnitude limits give no conclusive information to classify PSRs J17450952 or J18102005 as either LMBPs or IMBPs.
For low-eccentricity binary pulsars, the only post-Keplerian parameter that is likely to be measurable is the Shapiro delay. The upper limit for inclination of PSR J17450952, i34 , suggests that the effect of Shapiro delay in timing will be very low and therefore we can not expect to use pulsar timing analyis to disentangle the individual masses of this system. However, the expected luminosity of indicates that using a dedicated optical observation, the companion of this pulsar may be detectable, and this will therefore be the most promising way of deducing the pulsar and companion masses.
Acknowledgements.
The Westerbork Synthesis Radio Telescope is operated by ASTRON (Netherlands Foundation for Research in Astronomy) with support from the Netherlands Foundation for Scientific Research NWO. The Nançay radio Observatory is operated by the Paris Observatory, associated to the French Centre National de la Recherche Scientifique (CNRS). The Nançay Observatory also gratefully acknowledges the financial support of the Region Centre in France.References
- Althaus et al. (2001) Althaus, L. G., Serenelli, A. M., & Benvenuto, O. G. 2001, MNRAS, 324, 617
- Bassa et al. (2003) Bassa, C. G., van Kerkwijk, M. H., & Kulkarni, S. R. 2003, A&A, 403, 1067
- Bassa et al. (2006) Bassa, C. G., van Kerkwijk, M. H., & Kulkarni, S. R. 2006, A&A, 450, 295
- Bergeron et al. (1995) Bergeron, P., Wesemael, F., & Beauchamp, A. 1995, PASP, 107, 1047
- Camilo et al. (2001) Camilo, F., Lyne, A. G., Manchester, R. N., et al. 2001, ApJ, 548, L187
- Cordes & Lazio (2002) Cordes, J. M. & Lazio, T. J. W. 2002, preprint (arXiv:astro-ph/0207156)
- Danziger et al. (1993) Danziger, I. J., Baade, D., & Della Valle, M. 1993, A&A, 276, 382
- Dewey et al. (1985) Dewey, R. J., Taylor, J. H., Weisberg, J. M., & Stokes, G. H. 1985, ApJ, 294, L25
- Drimmel et al. (2003) Drimmel, R., Cabrera-Lavers, A., & López-Corredoira, M. 2003, A&A, 409, 205
- Edwards & Bailes (2001) Edwards, R. T. & Bailes, M. 2001, ApJ, 553, 801
- Gupta et al. (1994) Gupta, Y., Rickett, B. J., & Lyne, A. G. 1994, MNRAS, 269, 1035
- Hobbs et al. (2008) Hobbs, G., Jenet, F., Lommen, A., et al. 2008, in AIP Conf. Series, Vol. 983, AIP Conf. Series, ed. C. G. Bassa, Z. Wang, A. Cumming, & V. M. Kaspi, 630–632
- Hobbs et al. (2005) Hobbs, G., Lorimer, D. R., Lyne, A. G., & Kramer, M. 2005, MNRAS, 360, 974
- Hobbs et al. (2006) Hobbs, G. B., Edwards, R. T., & Manchester, R. N. 2006, MNRAS, 369, 655
- Hotan et al. (2004) Hotan, A. W., van Straten, W., & Manchester, R. N. 2004, Proc. Astr. Soc. Aust., 21, 302
- Jacoby et al. (2006) Jacoby, B. A., Chakrabarty, D., van Kerkwijk, M. H., Kulkarni, S. R., & Kaplan, D. L. 2006, ApJ, 640, L183
- Janssen et al. (2008a) Janssen, G. H., Stappers, B. W., Kramer, M., et al. 2008a, A&A, 490, 753
- Janssen et al. (2008b) Janssen, G. H., Stappers, B. W., Kramer, M., et al. 2008b, in AIP Conf. Series, Vol. 983, AIP Conf. Series, ed. C. G. Bassa, Z. Wang, A. Cumming, & V. M. Kaspi, 633–635
- Jenet et al. (2005) Jenet, F. A., Hobbs, G. B., Lee, K. J., & Manchester, R. N. 2005, ApJ, 625, L123
- Johnston et al. (1998) Johnston, S., Nicastro, L., & Koribalski, B. 1998, MNRAS, 297, 108
- Karuppusamy et al. (2008) Karuppusamy, R., Stappers, B. W., & Van Straten, W. 2008, PASP, 120, 191
- Kramer et al. (1999) Kramer, M., Lange, C., Lorimer, D. R., et al. 1999, ApJ, 526, 957
- Kramer et al. (1998) Kramer, M., Xilouris, K. M., Lorimer, D. R., et al. 1998, ApJ, 501, 270
- Lange et al. (2001) Lange, C., Camilo, F., Wex, N., et al. 2001, MNRAS, 326, 274
- Lorimer (2008) Lorimer, D. R. 2008, Living Reviews in Relativity, http://relativity.livingreviews.org/Articles/lrr-2008-8/
- Lorimer et al. (1995) Lorimer, D. R., Lyne, A. G., Festin, L., & Nicastro, L. 1995, Nature, 376, 393
- Rickett (2001) Rickett, B. J. 2001, A&AS, 278, 5
- Rohrmann et al. (2002) Rohrmann, R. D., Serenelli, A. M., Althaus, L. G., & Benvenuto, O. G. 2002, MNRAS, 335, 499
- Schönberner et al. (2000) Schönberner, D., Driebe, T., & Blöcker, T. 2000, A&A, 356, 929
- Schlegel et al. (1998) Schlegel, D. J., Finkbeiner, D. P., & Davis, M. 1998, ApJ, 500, 525
- Shklovskii (1970) Shklovskii, I. S. 1970, Sov. Astron., 13, 562
- Stetson (1987) Stetson, P. B. 1987, PASP, 99, 191
- Stetson (2000) Stetson, P. B. 2000, PASP, 112, 925
- Thorsett & Chakrabarty (1999) Thorsett, S. E. & Chakrabarty, D. 1999, ApJ, 512, 288
- Toscano et al. (1999) Toscano, M., Sandhu, J. S., Bailes, M., et al. 1999, MNRAS, 307, 925
- Van Haasteren et al. (2008) Van Haasteren, R., Levin, Y., McDonald, P., & Lu, T. 2008, MNRAS, 395, 1005
- van Kerkwijk et al. (2005) van Kerkwijk, M., Bassa, C. G., Jacoby, B. A., & Jonker, P. G. 2005, in Binary Radio Pulsars, ed. F. Rasio & I. H. Stairs (San Francisco: Astronomical Society of the Pacific), 357–370
- van Kerkwijk & Kulkarni (1995) van Kerkwijk, M. H. & Kulkarni, S. R. 1995, ApJ, 454, L141
- Voûte et al. (2002) Voûte, J. L. L., Kouwenhoven, M. L. A., van Haren, P. C., et al. 2002, A&A, 385, 733
- Wang et al. (2005) Wang, N., Manchester, R. N., Johnston, S., et al. 2005, MNRAS, 358, 270
- You et al. (2007) You, X. P., Hobbs, G. B., Coles, W. A., Manchester, R. N., & Han, J. L. 2007, ApJ, 671, 907
- Zacharias et al. (2004) Zacharias, N., Urban, S. E., Zacharias, M. I., et al. 2004, AJ, 127, 3043