Long-term solar activity influences on South American rivers
Abstract
River streamflows are excellent climatic indicators since they integrate precipitation over large areas. Here we follow up on our previous study of the influence of solar activity on the flow of the Paraná River, in South America. We find that the unusual minimum of solar activity in recent years have a correlation on very low levels in the Paraná’s flow, and we report historical evidence of low water levels during the Little Ice Age. We also study data for the streamflow of three other rivers (Colorado, San Juan and Atuel), and snow levels in the Andes. We obtained that, after eliminating the secular trends and smoothing out the solar cycle, there is a strong positive correlation between the residuals of both the Sunspot Number and the streamflows, as we obtained for the Paraná. Both results put together imply that higher solar activity corresponds to larger precipitation, both in summer and in wintertime, not only in the large basin of the Paraná, but also in the Andean region north of the limit with Patagonia.
keywords:
South American rivers, solar activity, streamflow.1 Introduction
Usually, studies focusing on the influence of solar activity on climate have concentrated on Northern Hemisphere temperature or sea surface temperature. However, climate is a very complex system, involving many other important variables. Recently, several studies have focused in a different aspect of climate: atmospheric moisture and related quantities like, for example, precipitation.
Perhaps the most studied example is the Asian monsoon, where correlations between solar activity and precipitation have been found in several time scales. For example, Neff et al. (2001) found strong coherence between solar variability and the monsoon in Oman between 9 and 6 kyr ago. Agnihotri et al. (2002) found that Indian monsoon intensity followed the solar irradiance variability on centennial time scales during the last millennium. Fleitmann et al. (2003) studied Holocene forcing of the Indian monsoon, and found that intervals of weak (strong) solar activity correlates with periods of low (high) monsoon precipitation. On shorter time scales, Mehta and Lau (1997), found that, at decadal-multidecadal time scales, the correlation between the El Niño 3 index and the monsoon rainfall is stronger when solar irradiance is above normal and viceversa. Correlations between solar activity and Indian monsoon in decadal time scales were also found by Bhattacharyya and Narasimha (2005) and Kodera (2004), among others.
Wang et al. (2005) studied the monsoon in southern China over the past 9000 years, and found that higher solar irradiance corresponds to stronger monsoon. They proposed that the monsoon responds almost immediately to solar changes by rapid atmospheric responses to solar forcing.
All these studies reported a positive correlation, where periods of higher solar activity correspond to periods of larger precipitation. In contrast, Hong et al. (2001) studied a 6000-year record of drought and precipitation in northeastern China, and found that most of the dry periods agree well with stronger solar activity and viceversa. In the American continent, droughts in the Yucatan Peninsula have been associated with periods of high solar activity and have even been proposed to explain the Mayan decline (Hodell et al., 2001).
In the same sense, studies based on the water level of Lakes Naivasha (Verschuren et al., 2000) and Victoria (Stager et al., 2005) in East Africa, report severe droughts during phases of high solar activity and increased precipitation during periods of low solar irradiation. To explain these differences it has been proposed that increased solar irradiation causes more evaporation in equatorial regions, enhancing the net transport of moisture flux to the Indian sub-continent via monsoon winds (Agnihotri et al., 2002).
However, these relationships seem to have reversed sign around 200 years ago, as severe droughts developed over much of tropical Africa during the Dalton sunspot minimum, ca. AD 1800-1820 (Stager et al., 2005). Furthermore, Stager et al. (2007) studied recent water levels in Lake Victoria, and found that peaks in the 11-year sunspot cycle were accompanied by water level maxima throughout the 20th century, due to the occurrence of positive rainfall anomalies 1 year before solar maxima. Similar patterns also occurred in at least five other East African lakes, indicating that these sunspot-rainfall relationships were broadly regional in scale.
A different approach was taken by Mauas and Flamenco (2005) who proposed to study the streamflow of a large river, the Paraná in southern South America, as an indicator of precipitation. In fact, flows of continental-scale rivers are excellent climatic indicators since they integrate precipitation, infiltrations and evapotranspiration over large areas and smooth out local variations. Signals of solar activity have recently been found with spectral analysis techniques in the river Nile by Ruzmaikin et al. (2006), who found a low-frequency 88-year variation present in solar variability and in the Nile records. Similarly, Zanchettin et al. (2008) found that the discharge of the Po river appear to be correlated with variations in solar activity, on decadal time scales.
In Mauas et al. (2008) (hereinafter Paper I) we presented the results of our study of the Paraná. We found that the streamflow variability of the Paraná river has three temporal components: on the secular scale, it is probably part of the global climatic change, which at least in this region of the world is related with more humid conditions; on the multidecadal time scale, we found a strong correlation with solar activity, as expressed by the Sunspot Number, and therefore probably with solar irradiance, with higher activity coincident with larger discharges; on the yearly time-scale, the dominant correlation is with El Niño.
In the present paper we follow up on the study of the influence of solar activity on the flow of South American rivers. In Section 2 we expand in time the study of the multi-decadal component of the Paraná’s streamflow, to include the most recent years, which have shown particularly low levels of solar activity. In Section 3 we study other South American rivers, to see whether the influence extends to other areas of the continent. Finally, in Section 4 we discuss the implications of our findings.
2 The multidecadal component of the Paraná’s streamflow
The Paraná is the fourth river of the world according to streamflow (20 600 m3/s), and the fifth according to drainage area (3 100 000 km2), which is the second largest in South America. Its origin is in the southernmost part of the Amazon forest, from where it flows south collecting water from territories in Brazil, Bolivia, Paraguay and Argentina. Its outlet is in the Plata River, a few kilometers north of the City of Buenos Aires. It flows through heavily populated areas and it is navigated by overseas trade ships, unlike other rivers of similar size. For these reasons, its streamflow has been measured continuously during the last century.
As in Paper I, we analyze the streamflow data measured daily since 1904, at a gauging station located in the city of Corrientes, 900 km north of the outlet of the Paraná. Since the Paraná’s hydrological year goes from September to August, with maximum streamflow in the Southern Hemisphere’s summer months of January, February and March, our yearly series integrates the flow from September to August of the next year.
In Paper I we found that in intermediate scales of decades, there is a strong correlation between the Paraná’s streamflow and solar activity, as expressed by the Sunspot Number ()111Available at ftp://ftp.ngdc.noaa.gov/STP/SOLARDATA/SUNSPOTNUMBERS., with larger solar activity corresponding to larger streamflow. We found a similarly strong correlation with the irradiance reconstruction by Wang et al. (2005).
We further explore this correlation in Fig. 1, which is an update of Fig. 2 of Paper I, including 4 more years of data. To retain only the intermediate scale, we first computed the secular trends with a low-pass Fourier filter with a 50 years cut-off, as shown in Fig. 1 of Paper I, which was substracted from the data. Then, we performed an 11-year-running mean to smooth out the solar cycle (for this reason, only data for the period 1909-2003 are shown). In this way, both high and low frequencies have been filtered out of the data in Fig. 1, which only retain the variations in timescales between 11 and 50 years.
When plotting together different quantities, the offset and the relative scales are free parameters which are usually arbitrarily introduced. To avoid these two artificial parameters, as a final step we have standardized the quantities by subtracting the mean and dividing by the standard deviation of each series shown, for the whole period 1909-2003. More details can be found in Paper I.
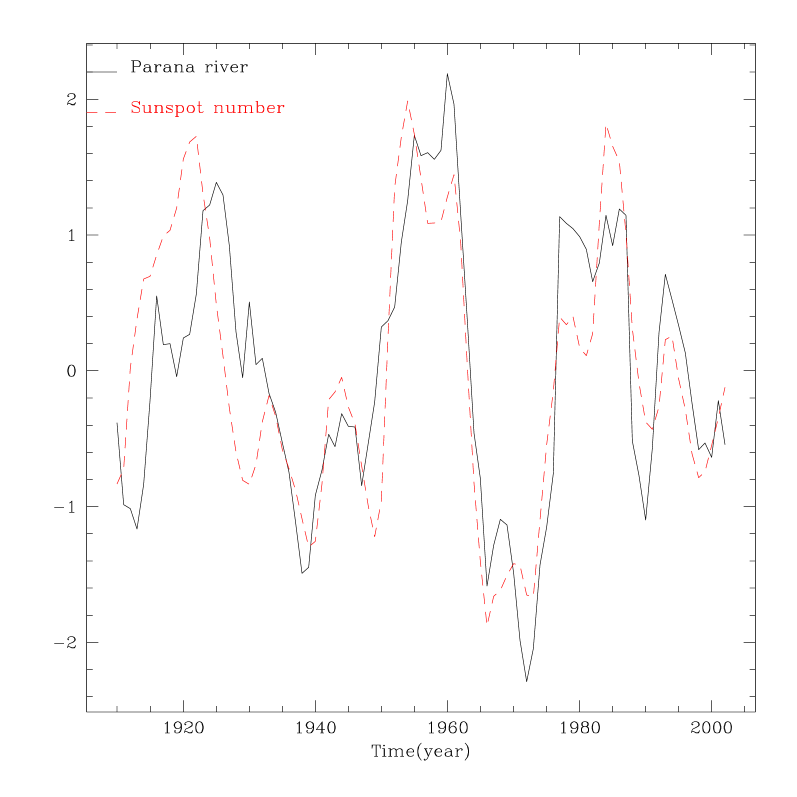
The correlation between the Paraná’s streamflow and the Sunspot Number in Fig. 1 is quite remarkable. In fact, the correlation coefficient between both series is R=0.78, significant to a 99% level.
We point out that this correlation is found in the intermediate time scale. On longer timescales, both the Paraná’s discharge and solar activity are larger in the last decades than in the first ones of the 20th century, and these increases are not correlated (for a discussion, see Paper I). On the yearly timescale, the dominant factor influencing streamflow’s variations is El Ninño (again, see Paper I for details). The results shown in Fig. 1 show that decades of larger discharge correspond to decades of higher activity, with these variations overimposed on the corresponding secular trends.
It can be seen that the correlation is still found in the most recent years. In particular, in the period 1995-2003 both the mean Sunspot Number and the Paraná’s streamflow have decreased by similar amounts. In fact, Solar Cycle 23 was the weakest since the 1970s, and the onset of Solar Cycle 24 was delayed by a minimum with the largest number of spotless days since the 1910s. Morover, for the years 2008 and 2009 (2.9 and 3.1, respectively), have been the lowest since 1913. Similarly, the mean levels of the Paraná were also the lowest since the 1970s.
We have also tested the correlations between the Paraná’s discharge and the neutron count at Climax, Colorado222Available at http://www.env.sci.ibaraki.ac.jp/ftp/pub/WDCCR/STATIONS/climax., which is a direct measure of the galactic cosmic rays (GCR) flux. Of course, since neutron count is correlated with sunspot numbers, we found a correlation with Paraná’s streamflow. However, the correlation with is larger, pointing to a more direct correlation with solar irradiance than with GCR.
The relationship between smaller solar activity and low Paraná’s discharge can also be found in historical records. For example, low discharges were reported during the period known as the Little Ice Age (LIA). In particular, a traveler of that period recalls in his diary that in the year 1752 the streamflow was so small that the river could not even be navigated by the ships of that time, which were less than 5 ft draft, to be compared with ships up to 18 ft draft that can navigate it at present as far north as Asunción in Paraguay (Iriondo, 1999). The fact that the LIA coincided with reduced precipitation in this region has been found in different climatic records (e.g. Piovano et al. 2009 and references therein). It is well known that the LIA coincided with, and perhaps was caused by, low solar activity (Eddy, 1976).
3 The Colorado river basin
Here we study the streamflow of the Colorado river, and two of its tributaries, the San Juan and the Atuel rivers (see Fig. 2). We also analyze snow levels, measured near the sources of the Colorado.
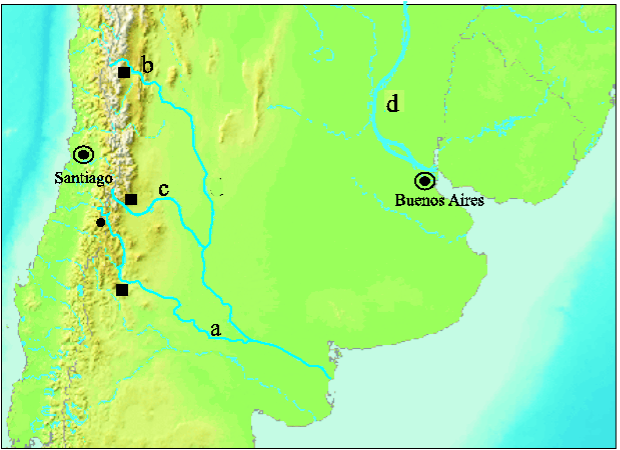
The Colorado river marks the north boundary of the Argentine Patagonia, separating it from the Pampas, to the northeast, and the Andean region of Cuyo, to the Northwest. Its origin is on the eastern slopes of the Andes Mountains, from where it flows southeast until it discharges in the Atlantic Ocean. The Atuel, which originates in the glacial Atuel Lake, at 3250 m above sea level in the Andes range, and the 500 km long San Juan river, join the Colorado downstream of it’s gauging station. Therefore, the data given by the three series are not directly related.
In Table 1 we list the mean stream flow and drainage basin area of the Colorado, Atuel and San Juan rivers. We also include the time interval of the stream flow records plotted in Fig. 4 and the geographical coordinates of the gauging stations.
| River | Gauging Station | ||||
|---|---|---|---|---|---|
| (m3/s) | (km2) | ||||
| Colorado | 150 | 15 300 | 1940-2006 | Buta Ranquil | 37∘ 06’ S 69∘ 44’ W |
| Atuel | 32 | 3800 | 1916-1999 | La Angostura | 35∘ 02’ S 68∘ 52’ W |
| San Juan | 56 | 25700 | 1909-2005 | KM 47,3 | 31∘ 32’ S 68∘ 53’ W |
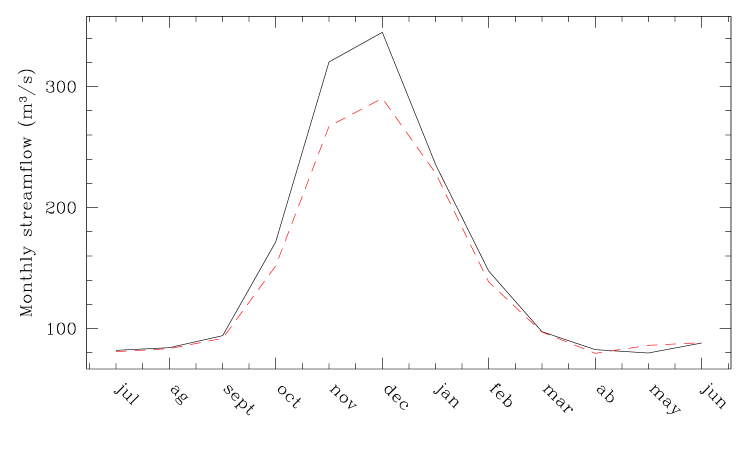
Unlike the Paraná, whose streamflow is directly related to precipitation, the regime of all these rivers is dominated by snow melting, and their streamflows reflect precipitation accumulated during the winter, and melted during spring and summer. For this reason, the streamflows are largest during summer, and the hydrological year for these rivers goes from July to June next year. This can be seen In Fig. 3, where we show the mean monthly flow of the Colorado. In the figure we separately plot the flow for years when the multidecadal component of the sunspot number shown in Fig. 1 is high (low), i.e. larger (smaller) than 0.5 above (below) the mean value. It can be seen that during the decades with larger activity, the streamflow is larger from September to December, when most of the melting takes place, and remains almost constant during the rest of the year.
To directly study the snow precipitation, we complete our data with measurements of the height of snow accumulated at Valle Hermoso (35∘ 15’ S; 70∘ 20’ W), in the Andes at 2250 m above Sea level, close to the origin of the Colorado (see Fig. 2), which were measured in situ at the end of the winter since 1952. In fact, the correlation between the streamflow of the Colorado and the snow height is very good, with a correlation coefficient R=0.87, significant to a 99% level. Correlation coefficients between the snow data and the Atuel and San Juan streamflows are R=0.76 and R=0.64, respectively. Since Valle Hermoso is placed closer to the origin of the Colorado, and closer to the Atuel than to the San Juan, this progressive reduction of the correlation is to be expected.
In Fig. 4 we plot the yearly time series of the streamflow of the Colorado, San Juan and Atuel rivers, the snow height and the Sunspot number. We also show the variation in the longest scales, obtained with a low-pass Fourier filter, as we did for the Paraná. However, since the length of the time series is not the same for every set of observations, we could not apply a uniform filter for all of them. In all cases, the cut-off was taken as half the length of the observations (33 years for the Colorado, 40 years for the Atuel, 50 years for the San Juan and the Sunspot Number and 28 years for the snow)
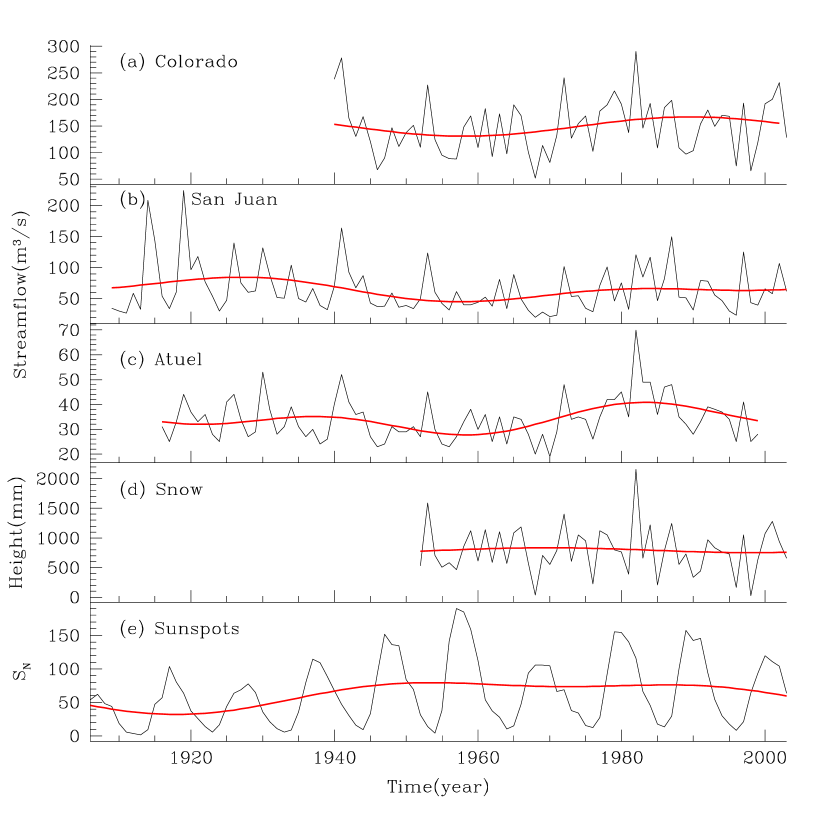
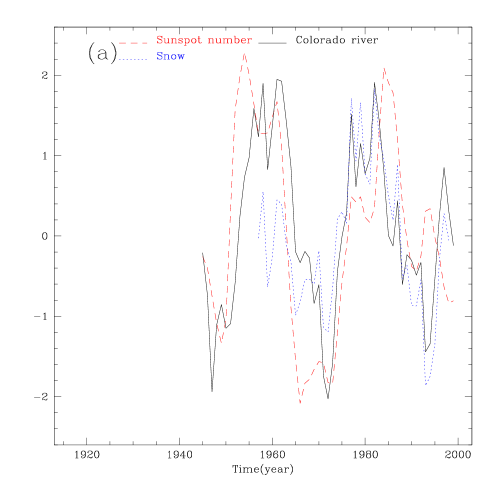
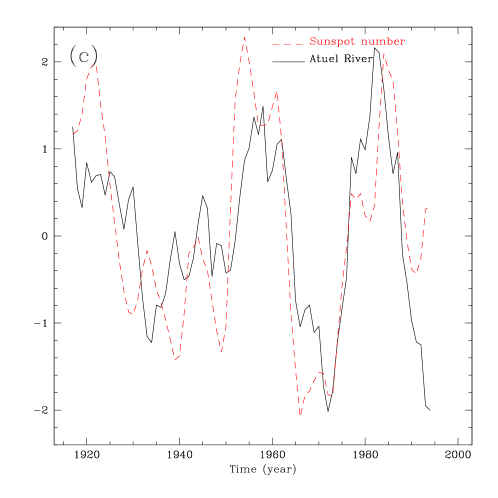
In Fig. 5 we compare the multidecadal component of the streamflows with the corresponding series for the sunspot number. In each case, we smoothed out the solar cycle with an 11-year running mean, and we detrended the series by subtracting the long term component shown in Fig. 4. Finally, we standardized the data by subtracting the mean and dividing by the standard deviation of each series shown for the period 1971-2000, suggested by the World Meteorological Organization as standard reference. In the panel corresponding to the Colorado, we also include the snow height.
It can be seen that in all cases the agreement is remarkable. The correlation coefficients are 0.59, 0.47, 0.67 and 0.69 for the Colorado, the snow level, the San Juan and the Atuel, respectively, all significant to the 96-97% level. Therefore, also in these cases we found a relation between solar activity, on one hand, and the streamflow of these rivers and snow level, on the other, as we found for the Paraná.
Probably, the most important correlation is the one with snow level, and the correlations with the rivers’ streamflow are indirect consequences of the variations in precipitations. We should point out that climate in this area is correlated with the conditions over the equatorial Pacific, as measured by El Niño. This correlation was studied for the Diamante River, also a tributary of the Colorado, by Berri and Flamenco (1999).
In particular, the peaks in the snow level and the streamflows (see Fig. 4) in the year 1982/3 coincide with a very strong El Niño event, which caused a huge flood in the Paraná’s basin, as we discussed in Paper I. Correlation coefficients between our data and el Niño 1+2 index in November (at the beginning of the austral Summer), are R=0.51, R=0.60, R=0.60, and R=0.61, for snow level and the Colorado, Atuel and San Juan rivers, respectively.
Although all these rivers have maximum streamflow during Summer, there is a big difference, however, between the regimes of the Paraná and the remaining rivers: for these ones, the important factor is the intensity of the precipitation occurring in the winter months, from June to August. For the Paraná, what is most important is the level of the precipitation during the summer months. It is also worth noticing the sense of the relationship: here again, stronger activity coincides with larger precipitation.
4 Discussion
In this paper we analyzed the influence of solar activity in the streamflow of South American rivers of different regimes. First, we extended in time the study of the correlation between Sunspot Number and the Paraná’s streamflow we reported in Paper I. On one hand, we found that the unusual minimum of solar activity in recent years have a correlation on very low levels in the Paraná’s flow. On the other, we reported historical evidence of low water levels during the Little Ice Age. We also found that the correlation is stronger with sunspot number than with neutron count, which confirms that what is affecting climate is most probably solar irradiance, and not GCRs.
The fact that the river’s behaviour follows through one more minimum strongly enhances the significance of the correlation and its predictive value. In particular, the low levels of activity expected for Solar Cycle 24 anticipate that the dry period in the Paraná will continue well into the next decade.
To study whether the solar influence extends to other areas of the continent, we analyzed the streamflow of three South American rivers: the Colorado and two of its tributaries, the San Juan and Atuel rivers. We also used snow level from a station at the origin of the Colorado. We obtained that, after eliminating the secular trends and smoothing out the solar cycle, there is a strong correlation between the residuals of both the Sunspot Number and the streamflows. In all cases, the correlation we found on multi-decadal time scales is positive, i.e., higher solar activity corresponds to larger snow accumulation and, therefore, to larger discharges of all these rivers, as we obtained for the Paraná river.
Therefore, both results put together imply that higher solar activity corresponds to larger precipitation, not only in the large basin of the Paraná, but also in the Andean region north of the limit with Patagonia. Furthermore, since streamflow variability of rivers on central Chile are controlled by the same mechanisms that regulate the rivers studied in this paper, one might expect the same correlation to be found west of the Andes.
Solar activity can affect precipitation through the position of the Inter Tropical Convergence Zone (ITCZ), which has been shown to correlate with variations in solar insolation (Poore et al., 2004; Haug et al., 2001). In fact, it has been proposed that a displacement southwards of the ITCZ would increase precipitation in southern tropical South America (Newton et al., 2006). We point out that increased precipitation occur both in the Southern Hemisphere’s summer when the ITCZ is over the equator, close to the origin of the Paraná, and in wintertime, when the ITCZ displaces north, and precipitation increase further South.
References
- Agnihotri et al. (2002) Agnihotri, R., K. Dutta, R. Bhushan, and B. L. K. Somayajulu 2002. Evidence for solar forcing on the Indian monsoon during the last millennium. Earth and Planetary Science Letters 198, 521–527.
- Berri and Flamenco (1999) Berri, G. J., and E. A. Flamenco 1999. Seasonal volume forecast of the Diamante River, Argentina, based on El Niño observations and predictions. Water Resources Research 35, 3803–3810.
- Bhattacharyya and Narasimha (2005) Bhattacharyya, S., and R. Narasimha 2005. Possible association between Indian monsoon rainfall and solar activity. Geophysical Research Letters 32, 5813–+.
- Eddy (1976) Eddy, J. A. 1976. The Maunder Minimum. Science 192, 1189–1202.
- Fleitmann et al. (2003) Fleitmann, D., S. J. Burns, M. Mudelsee, U. Neff, J. Kramers, A. Mangini, and A. Matter 2003. Holocene Forcing of the Indian Monsoon Recorded in a Stalagmite from Southern Oman. Science 300, 1737–1740.
- Haug et al. (2001) Haug, G. H., K. A. Hughen, D. M. Sigman, L. C. Peterson, and U. Röhl 2001. Southward Migration of the Intertropical Convergence Zone Through the Holocene. Science 293, 1304–1308.
- Hodell et al. (2001) Hodell, D. A., C. D. Charles, and F. J. Sierro 2001. Late Pleistocene evolution of the ocean’s carbonate system. Earth and Planetary Science Letters 192, 109–124.
- Hong et al. (2001) Hong, Y. T., Z. G. Wang, H. B. Jiang, Q. H. Lin, B. Hong, Y. X. Zhu, Y. Wang, L. S. Xu, X. T. Leng, and H. D. Li 2001. A 6000-year record of changes in drought and precipitation in northeastern China based on a C time series from peat cellulose. Earth and Planetary Science Letters 185, 111–119.
- Iriondo (1999) Iriondo, M. 1999. Climatic changes in the south american plains: Records of a continent-scale oscillation. Quat. Int. 57-58, 112.
- Kodera (2004) Kodera, K. 2004. Solar influence on the Indian Ocean Monsoon through dynamical processes. Geophysical Research Letters 31, 24209–+.
- Mauas and Flamenco (2005) Mauas, P., and E. Flamenco 2005. Solar activity and the streamflow of the Paraná River. Memorie della Societa Astronomica Italiana 76, 1002–+.
- Mauas et al. (2008) Mauas, P. J. D., E. Flamenco, and A. P. Buccino 2008. Solar Forcing of the Stream Flow of a Continental Scale South American River. Physical Review Letters 101(16), 168501–05.
- Mehta and Lau (1997) Mehta, V. M., and K.-M. Lau 1997. Influence of solar irradiance on the Indian monsoon-ENSO relationship at decadal-multidecadal time scales. Geophysical Review Letters 24, 159–162.
- Neff et al. (2001) Neff, U., S. J. Burns, A. Mangini, M. Mudelsee, D. Fleitmann, and A. Matter 2001. Strong coherence between solar variability and the monsoon in Oman between 9 and 6kyr ago. Nature 411, 290–293.
- Newton et al. (2006) Newton, A., R. Thunell, and L. Stott 2006. Climate and hydrographic variability in the Indo-Pacific Warm Pool during the last millennium. Geophysical Review Letters 33, 19710–+.
- Piovano et al. (2009) Piovano, E., D. Ariztegui, F. Córdoba, M. Cioccale, and F. Sylvestre 2009. Past Climate Variability in South America and Surrounding Regions From the Last Glacial Maximum to the Holocene, Chapter 14. Hydrological Variability in South America Below the Tropic of Capricorn (Pampas and Patagonia, Argentina) During the Last 13.0 Ka, pp. 323–351. Springer Netherlands.
- Poore et al. (2004) Poore, R. Z., T. M. Quinn, and S. Verardo 2004. Century-scale movement of the Atlantic Intertropical Convergence Zone linked to solar variability. Geophysical Research Letters 31, 12214–+.
- Ruzmaikin et al. (2006) Ruzmaikin, A., J. Feynman, and Y. L. Yung 2006. Is solar variability reflected in the Nile River? Journal of Geophysical Research (Atmospheres) 111, 21114–+.
- Stager et al. (2007) Stager, J. C., A. Ruzmaikin, D. Conway, P. Verburg, and P. J. Mason 2007. Sunspots, El Niño, and the levels of Lake Victoria, East Africa. Journal of Geophysical Research (Atmospheres) 112, 15106–+.
- Stager et al. (2005) Stager, J. C., D. Ryves, B. Cumming, L. Meeker, and J. Beer 2005. Solar variability and the levels of Lake Victoria, East Africa, during the last millenium. J. Paleolimnol. 33, 243–251.
- Verschuren et al. (2000) Verschuren, D., K. R. Laird, and B. F. Cumming 2000. Rainfall and drought in equatorial east Africa during the past 1,100 years. Nature 403, 410–414.
- Wang et al. (2005) Wang, Y., H. Cheng, R. L. Edwards, Y. He, X. Kong, Z. An, J. Wu, M. J. Kelly, C. A. Dykoski, and X. Li 2005. The Holocene Asian Monsoon: Links to Solar Changes and North Atlantic Climate. Science 308, 854–857.
- Wang et al. (2005) Wang, Y.-M., J. L. Lean, and N. R. Sheeley, Jr. 2005. Modeling the Sun’s Magnetic Field and Irradiance since 1713. ApJ 625, 522–538.
- Zanchettin et al. (2008) Zanchettin, D., A. Rubino, P. Traverso, and M. Tomasino 2008. Impact of variations in solar activity on hydrological decadal patterns in northern Italy. Journal of Geophysical Research (Atmospheres) 113, 12102–+.