Phase transitions and phase diagram of the ferroelectric perovskite (Na0.5BiBaxTiO3 by anelastic and dielectric measurements
Abstract
The complex elastic compliance and dielectric susceptibility of (Na0.5BiBaxTiO3 (NBT-BT) have been measured in the composition range between pure NBT and the morphotropic phase boundary included, . The compliance of NBT presents sharp peaks at the rhombohedral/tetragonal and tetragonal/cubic transitions, allowing the determination of the tetragonal region of the phase diagram, up to now impossible due to the strong lattice disorder and small distortions and polarizations involved. In spite of ample evidence of disorder and structural heterogeneity, the R-T transition remains sharp up to , whereas the T-C transition merges into the diffuse and relaxor-like transition associated with broad maxima of the dielectric and elastic susceptibilities. An attempt is made at relating the different features in the anelastic and dielectric curves to different modes of octahedral rotations and polar cation shifts. The possibility is also considered that the cation displacements locally have monoclinic symmetry, as for PZT near the morphotropic phase boundary.
pacs:
77.80.B-, 77.84.Cg, 77.22.Ch, 62.40.+iI Introduction
The phase diagrams of the solid solutions of the ferroelectric perovskite Na0.5Bi0.5TiO3 (NBT) with other tetrahedral perovskites are actively studied, mainly with the intent of obtaining compositions close to a morphotropic phase boundary (MPB) between rhombohedral (R) and tetragonal (T) phases, with easily reorientable ferroelectric domains and high electromechanical coupling. In fact, NBT based perovskites are among the possible lead-free piezoelectric materials that would substitute the widely used PbZr1-xTixO3, when new environmental legislations will limit the use of Pb containing materials.
The phase diagram of (Na0.5BiBaxTiO3 (here abbreviated as NBT-BT or BNBT-) is still uncertain in the interesting region including the MPB, particularly regarding the nature and extension of the presumably almost antiferroelectric (AFE) phase that becomes ferroelectric (FE) on further cooling. Also the temperature evolution of the structure of undoped NBT is the object of contradictory interpretations.DTB08 The main difficulties in determining the structure of NBT by neutron or x-ray diffraction are due to the very low distortion in both the tetragonal and rhombohedral phases, with a cell distortion from cubic of and respectively,JT02 and to the structural disorder in the Na/Bi sublattice, which is averaged out and compensated by anomalously large thermal factors in the analysis.ASI09 In addition, x-ray diffraction is little sensitive to the rotations of the O octahedra involved in the various structural transformations, due to the low atomic number of O. Cation disorder is enhanced in the solid solutions with other perovskites; it is responsible for the diffuse nature of the lower temperature transitions in the dielectric measurements, sometimes considered of the relaxor type, and possibly for the very broad temperature range of coexistence between T and R phases, with characteristics that vary from study to study. There is also scarce reproducibility of the transition temperatures and of the associated anomalies in the dielectric and other physical properties, which generally exhibit very broad anomalies with large hysteresis between heating and cooling.DTB08 ; FLG09 These uncertainties may also be connected with differences from sample to sample in the local cation ordering and non perfect stoichiometry in the Na/Bi sublattice, due to preferential loss of Bi during sintering.
The elastic constants should provide clear information on the occurrence of transformations between C, T and R phases, which are of ferroelastic nature, but to our knowledge only few studies of the acoustic properties of NBT exist,STS95 ; FLG09 ; Suc02 which have not an obvious connection with the known phase transitions. Here we present an extensive study of (NBT)1-x(BT)x with by combined anelastic and dielectric spectroscopies.
II Experimental
Powders of the composition (Na0.5BiBaxTiO3 with and 2, 3, 4, 5, 6, 8 mol% were prepared following the mixed-oxide method. Stoichiometric amounts of Na2CO3 (Merck 6392), Bi2O3 (Aldrich 223891), BaCO3 (Merck 1714), TiO2 (Degussa P 25) were mixed in ethanol with zirconia milling media for 48 h, dried and sieved. For each composition the calcining and sintering temperatures were systematically investigated in order to improve the cold consolidation behavior and the final density. After heat treatment at oC for 1 h and further milling and drying, the powders were isostatically pressed at 300 MPa and sintered at 1150 oC for 2 h. In order to avoid the loss of Na and Bi, which is significant at temperatures over 1000 oC, most of the sintering processes were carried out with the samples placed on a ZrO2 disc, covered with an Al2O3 crucible and sealed with NBT pack. The x-ray diffraction analysis evidenced the pure perovskitic phase in all the samples investigated. The microstructure of the sintered samples was observed on polished and etched surfaces by means of scanning electron microscopy (Leica Cambridge Stereoscan 360). Depending on the composition (at the same sintering conditions) the microstructures result more or less homogeneous, with some large, squared grains in a matrix of smaller grains; among those sintered in the NBT pack powder, pure NBT showed the largest grain size ( m), which reduced upon addition of barium, the lowest mean size being found with (0.5 m).
We prepared discs (diameter 22 mm, thickness 2 mm) for the dielectric measurements and blocks ( mm3) subsequently cut into bars ( mm3) for both anelastic and dielectric experiments. The faces of the discs were ground, silver electroded and poled with an electric field of 3 kV/mm in a silicon oil bath at 120 oC for 30 min, while the bars were tested unpoled.
The dielectric measurements were carried out on poled and unpoled discs and bars in a frequency range between 200 Hz and 200 kHz using a Hewlett-Packard LCR meter (HP 4284A) with a four wire probe and an ac driving signal level of 0.5 V/mm. The dielectric permittivity was obtained from the measured values of capacitance and loss . The measurements were made on heating/cooling at K/min between 300 and 570 K in a Delta Design climatic chamber model 9023A.
The complex Young’s modulus was measured by electrostatically exciting the flexural vibrations of the bars, which were suspended on thin thermocouple wires in vacuum. It was possible to excite the 1st, 3rd and sometimes 5th flexural modes, whose resonating frequencies are in the ratios . The fundamental frequency is given byNB72
where is the length, the thickness, the density the bar; for most samples it was kHz. From the above formula it is possible to extract the absolute value of the Young’s modulus. Such a value is affected by an error that may easily be of the order of 10%, due to uncertainties in the sample dimensions, porosity (the density was always of the theoretical one) and above all due to the Ag electrode, which was applied to one or two faces and whose thickness and Young’s modulus could not be controlled. The anelastic spectra are displayed in terms of the real part of the reciprocal Young’s modulus or compliance, , and of the elastic energy loss coefficient . Since the anelastic spectroscopy experiments were made in vacuum, some oxygen loss occurred when 800 K were exceeded, and the sample became darker. In most cases, however, we did not note any effect on the anelastic and even dielectric spectra; major changes occurred if 1000 K were exceeded with samples prepared without precautions against Bi loss during sintering.
III Results and Discussion
III.1 Undoped NBT
III.1.1 The anelastic spectrum of NBT
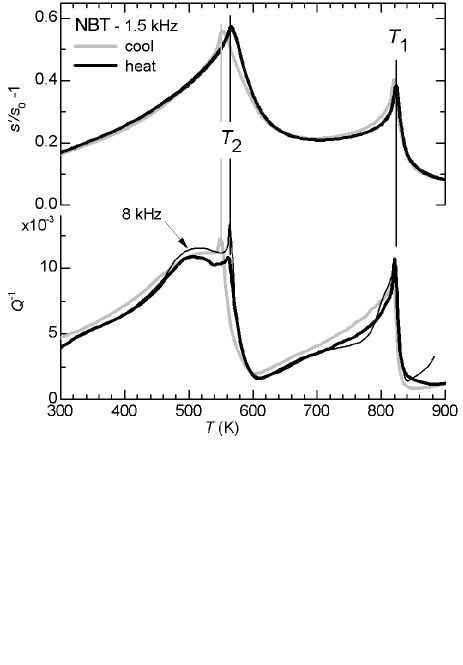
Figure 1 shows the compliance curves and the losses of undoped NBT measured on heating and cooling at 1.5 kHz (thick black and grey lines); the thin black curves were measured at 8 kHz during heating and are practically coincident with those at 1.5 kHz, especially in the real part. This means that the anomalies in are not due to relaxation of domain walls or defects, but they reflect the intrinsic elastic constants plus the fast relaxation of the order parameters involved in the structural transformations, which can instantaneously follow the sample vibration. Some frequency dependence is observed in the losses, and may be due to the relaxation of domain walls. There are sharp peaks at K and K (during heating) in the complex compliance, whose sharpness is in contrast with the broad anomalies in the other physical properties, including the acoustic ones in the GHz range, and with the structural changes, which are faint and spread over wide temperature ranges. The anomalies appear at slightly lower temperature during cooling, with hystereses of 3 and 13 K for and , respectively.
III.1.2 Phase transitions in NBT
The picture of the structural transformations in pure NBT is still confused and contradictory; therefore, in order to relate the elastic anomalies of Fig. 1 to structural changes, we replotted our data in Fig. 2a), together with the dielectric susceptibility and the temperature dependencies of various structural parameters measured in other experiments.
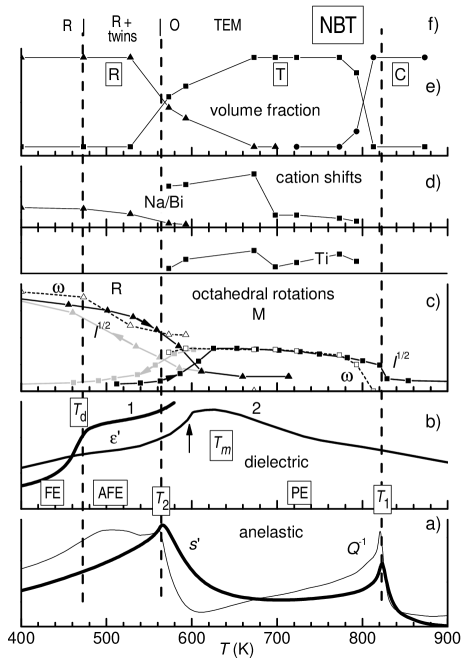
For clarity, the labels of the ordinates are omitted; only the temperature dependences are relevant here. Starting from the bottom panel a), the curves and measured during heating determine the temperatures and . In the next panel (ordinates: ) curve 1 is the dielectric permittivity measured during heating on poled NBT at 10 kHz. The step at K occurs at the same temperature where the macroscopic polarization vanishes, and the hysteresis loops become narrow or pinched in the center, and which is therefore called depolarization temperature ; it defines the transition between ferroelectric (FE) and possibly antiferroelectric (AFE)TSS94 ; OK06 ; HNT08 state. The antiferroelectric nature of the phase at is not unanimously acceptedVIK85 ; Suc98 ; BKN06 and is deduced, besides from the shape of the hysteresis curves, from the broad maximum of around K, which would signal the transition from AFE to paraelectric (PE). The width of this maximum, a possible slight frequency dispersion, especially at high frequencies,PKF04 the fact that no structural transformation at but instead several indications of phase coexistence on nanoscale exist,AIS06 ; DTB09 ; ASI09 induce several authors to liken this diffuse transition to a relaxor transition not only in the solid solutions with BT or other ferroelectrics, but also in pure NBT.LGS00 ; KBD03 ; HPK06 ; TWL07 ; FLG09 ; ASI09 The frequency dispersion is however definitely smaller than for traditional relaxors.TSS94 ; PKF04 Due to limitations in the temperature range of our apparatus, we could neither reach the T-C transition nor the maximum of at , and therefore we report curve 2 from Ref. OK06, , with a reduced step at and an additional step, indicated by an arrow, connected with the R-T transition at a temperature higher than our . The position, amplitude and shape of such a step is highly variable from experiment to experiment,TSS94 ; HNT06 while a dielectric anomaly has never been observed at .
Figure 2c) presents the temperature dependence of the rotations of the octahedra determined by neutron diffractionVIK85 ; JT02 (ordinates: ). In the case of NBT, the tetragonal structure arises from rotations of the octahedra about their axes ( in Glazer’s notationGla72 ), giving rise to superlattice peaks from the M point of the Brillouin zone, while the rhombohedral structure is due to rotations about all three principal directions of the cubic cell, with alternate sign along each axis ( in Glazer’s notation), giving rise to R-type superlattice peaks. The closed symbols (black = heating and gray = cooling) are the square root of the intensities of these superlattice reflections,VIK85 which should be proportional to the squares of the angles of rotations of type M and R.NC87 They are scaled in order to overlap with measured from Rietveld refinementsJT02 (open symbols). The curves from the two experimentsVIK85 ; JT02 are in reasonable agreement with each other and represent the rotational order parameters of the two transitions. On cooling from the C phase, the M rotation (squares) has an onset at K, no hysteresis between heating and cooling and a precursor tail extending a hundred kelvin above , at least in the experiment of Vakhrushev et al.VIK85 This behavior is close to what expected for the condensation of a soft M phonon mode at the zone boundary, acting as order parameter of the T phase. The softening of such a mode has been deduced from the intensity of the quasielastic neutron scattering at the M point,VIK85 but not observed by other techniques, to our knowledge. On further cooling, the R rotations (triangles) start being observed below K and the amplitude of the M rotations decreases. On the basis of these curves, the onset temperature for the R-T transformation cannot be defined with an uncertainty smaller than 40 K and there is a hysteresis of 60 K between heating and cooling. Again, a softening of the R phonon mode in the T phase has been deduced from the intensity of the quasielastic scattering at the R point.VIK85
The cation shifts with respect to the octahedra deduced from the neutron Rietveld refinementsJT02 are plotted in Fig. 2d). In the ferroelectric R phase both the Na/Bi and Ti (not shown) shifts are parallel to the pseudocubic direction; in the T phase, they are parallel to the tetragonal axis but with opposite signs, so that the structure is only weakly polar, in agreement with the nearly antiferroelectric properties in this temperature region. It is not clear whether the jump in cation shifts near 680 K may be put in relation with the broad dielectric maximum at . The refinements of the neutron scattering data of Jones and ThomasJT02 indicate regions of coexistence of C and T phases below and R and T phases around (volume fractions in Fig. 2e)). Unfortunately, the large temperature intervals between successive measurements did not allow to clarify the controversy on the R-T coexistence regions, as discussed by the same authors.JT02 A later diffuse neutron scattering studyBKN06 indicates a non trivial transformation between R and T structures over an extremely broad range of temperatures with a residual modulation of the R phase along the axis of the parent structure. A modulated R structure is found also in recent TEM experiments,DTB08 ; DTB09 which are interpreted in terms of a low temperature structure, which above 473 K starts twinning parallel to the pseudocubic planes. On further heating, the density of twin planes increases and the modulation of the polarization direction gives rise to antiferroelectric properties until at K the modulation disappears and the structure becomes homogeneous, identified as orthorhombic rather than tetragonal.DTB09 The temperatures of appearance and disappearance of the striation in the TEM images are indicated as vertical bars in Fig. 2e), and correspond to and .
III.1.3 Identification of the elastic anomalies
Based on Fig. 2 and the above discussion we can identify the temperatures and of the peaks in the elastic compliance with the onsets of the T-C and R-T transformations. The first case is obvious, in view of the coincidence of with the onset of the M-type rotations of the octahedra (Fig. 2c) causing the tetragonal distortion. The fact that the T-C transformation is evident in the elastic but absent in the dielectric susceptibilityTSS94 ; OK06 confirms that it is triggered by the non-polar rotational mode of the octahedra, as already discussed in connection with optical and high-frequency dielectric measurements.PKF04 The small hysteresis of 3 K between heating and cooling indicates that the transition is almost 2nd order. According to the Landau theory of phase transitions without fluctuations, the expected effect on the elastic constants involved in the resulting tetragonal distortion is a negative step when passing from cubic to tetragonal at ,CS98 or equivalently a positive step in the compliances. The elastic anomaly at has a consistent peaked component besides the step, but clearly corresponds to the almost 2nd order T-C transition. The occurrence of the additional peaked softening is common in perovskites and is usually explained in terms of fluctuation effects;CS98 it will not be discussed further here.
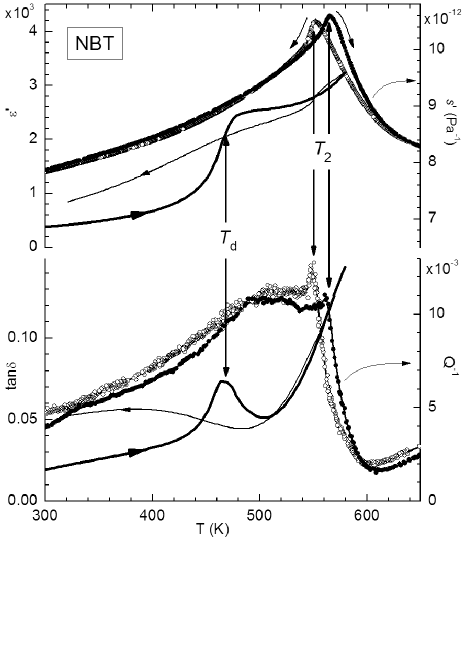
The R-T transition is characterized by a variety of apparently contradictory experimental results, which generally agree on the diffuseness of the transition and broad range of coexistence of the two phases; the competition between the two M and R rotational instabilities even suggests the possibility of glassy behavior.BKN06 In some dielectric measurements there is a step near the region of R-T coexistence, but only on heating and not on coolingTSS94 ; Suc01 and with varying temperatures and shapes.Suc01 ; QSS05 ; OK06 The dielectric permittivity and losses of one of our samples are plotted in Fig. 3 as thick (heating) and thin (cooling) lines, together with the compliance and elastic losses as closed (heating) and open (cooling) symbols. In spite of the limited maximum temperature, it is possible to see a step in the curves that correlates very well with the peak in . These compliance curves and particularly the acoustic losses are sharply peaked at a temperature with only 13 K of hysteresis between heating and cooling and allow us to define a precise temperature for the R-T transition (note the sharpness of the losses at higher frequency at in Fig. 1). In the light of the most recent experiments,BKN06 ; DTB08 ; DTB09 the temperature can be identified with the onset of the appearance of the R structure, which however appears gradually as a modulation between the M-type in-phase tilts of the octahedra about the axis in the T phase and the R-type antiphase tilts of the R phase,BKN06 or as finely twinned R phase.DTB09 Again, the fact that the anomaly is sharp and pronounced in the elastic compliance and less defined in the dielectric susceptibility suggests that the primary order parameter is the R-type tilting of the octahedra, which in turn induces a change in the direction and amplitude of the cation shifts. Conversely, there is no trace of the ferroelectric transition at in the elastic compliance. This may also be due to the fact that the ferroelectric transition does not seem to involve a change in the structure, but only in the size and correlation length of the domains.
The present measurements do not allow yet to unify the different pictures of the R phase obtained from various techniques into a coherent one, but indicate that, in spite of the various indications of extreme heterogeneity on the local scale, short correlation lengths and relaxor-like behavior, the R-type instability responsible for the R phase produces an elastic anomaly comparable to those of other crystalline perovskites with normal structural transitions occurring at a well defined temperature.
The above data can be compared with measured on a NBT crystal with the ultrasonic pulse echo technique,Suc02 where a shallow minimum is found near 580 K, with K of hysteresis between heating and cooling. The minimum has been attributed to relaxation of the polar regions rather that to the phase transition itself, and, although its temperature is close to , it is much shallower than the peak in the reciprocal Young’s modulus . Considering that the phase transition at involves the rhombohedral distortion, it is possible that the sharper response of the Young’s modulus is mainly due to the shear elastic constants of symmetry. Two Brillouin scattering experiments, which probe the acoustic properties at much higher frequencies, yield still different results. In one caseSTS95 a dip in sound velocity and a peak in damping are found near 700 K, which, instead of coinciding with one of the temperatures of the T-C and R-T transitions, is between the two. The observation has been explained in terms of strong fluctuations of the two coupled order parameters for the two T and R phases, plus disorder in the Na/Bi sublattice and has been put in parallel to relaxor ferroelectrics. In a more recent experiment,FLG09 the intensity of the quasi-elastic light scattering and a distortion of the phonon peaks from a lorentzian shape are found to be peaked at 550 K, which is about .
III.2 Samples quality
It is true that different techniques may produce different pictures of a same system; for example local probes like the NMR or EXAFS spectroscopies indicate larger and more disordered cation displacements than diffraction techniques.ASI08 Yet, the quality of samples is important for NBT, since different samples may give different results from the same technique, notably in the dielectric and ferroelectric properties. The main issues are cation ordering, stoichiometry and related defects providing ionized electronic charges. Regarding cation ordering, there are ferroelectric perovskites like Pb(Sc0.5Ta0.5)O3 (PST), where the level of Sc/Ta ordering can be controlled and produces marked effects on the temperature and diffuseness of the ferroelectric transition.SC80 In NBT, in some case superlattice peaks have been observed by x-ray diffraction PCK94 or TEMLYH01 ; LHK02 and attributed to an alternation of Bi and Na along the three directions, but usually cation order is found to be very weak and localizedWR05 or absent,JT02 so that a random distribution is assumed.PKF04 The level of cation ordering in NBT and its solid solutions with other perovskites is not controllable as in PST, and prolonged annealings in order to improve ordering might rather cause loss of Bi,HNT09 so that a spread of the NBT properties from sample to sample is not surprising. It is therefore appropriate to check whether the sharp elastic anomalies of NBT in Fig. 1 are the result of a sample of exceptional quality.
Figure 4 shows the anelastic spectra of three samples of NBT prepared in different ways. Samples 1 and 2 were calcined for 1 h at 800 oC (sample 1) or 700 oC (sample 2) and sintered for 2 h at 1150 oC with surrounding NBT packs in order to avoid Bi loss, while sample 3 was prepared with the same temperature schedules of sample 1 but without precautions against Bi loss. Sample 2 is the one of Fig. 1.
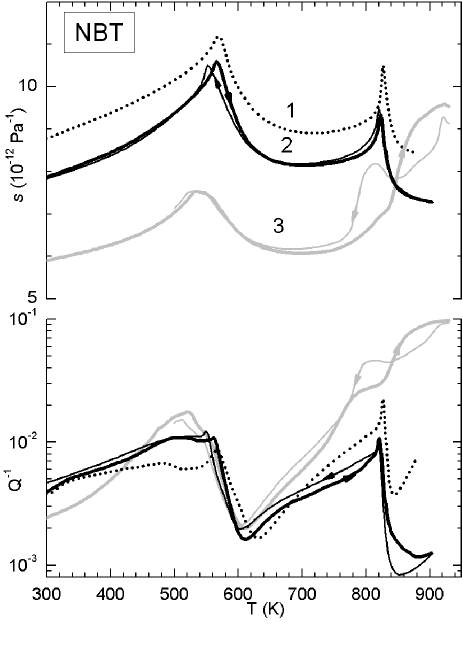
It is apparent that the Bi/Na stoichiometry is an issue, since in sample 3 only a reminiscence of the T-C transition at remains with the sign of the step in the compliance even reversed, and also the transition at is smeared; in addition, strong irreversible relaxation phenomena occur above 750 K, which are absent in the stoichiometric samples. Such relaxation processes appear as an elastic energy loss two orders of magnitude larger than in the cubic phase of stoichiometric samples, and are presumably due to the migration of the light Na ion by a vacancy mechanism in the cation deficient Na/Bi sublattice. The effect is absent in a perfectly stoichiometric lattice. The dielectric susceptibilities of two samples prepared as sample 1 and 3 (not shown here) demonstrate that the less stoichiometric samples of type 3 are indeed of extremely bad quality also from the dielectric point of view, with enormous losses due to mobile charges, which totally conceal the transition at . On the other hand, samples of type 1 present curves entirely comparable to those of ”good” samples in the literature; therefore, the sharp elastic anomalies at should not be ascribed to an exceptional quality of those samples, but are a general property of NBT. In addition, the elastic anomaly at clearly persists, although broadened, also in less stoichiometric samples of type 3, where the other transitions are washed out. This demonstrates that the rotational instability leading to the R-T transformation is also robust against lattice disorder.
III.3 Anelastic spectra of NBT-BT
Figure 5 presents compliance and elastic energy losses curves measured on heating of a series of samples with Ba substitution up to 6%. We do not include the curves for 8% for clarity and because we consider those measurements preliminary, due to the sample quality.
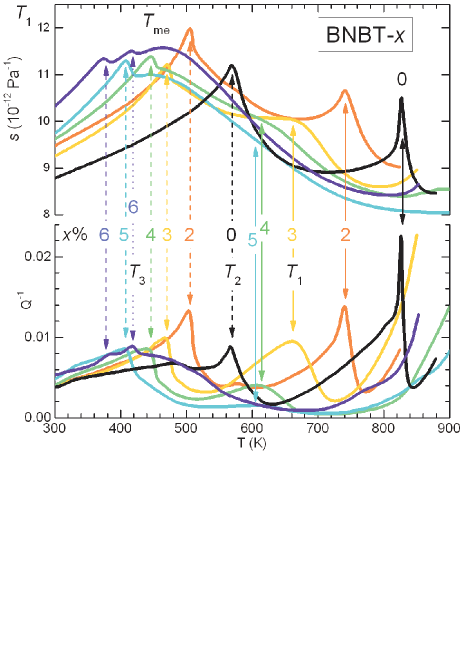
Upon substitution of Ba, the T-C transition lowers its temperature (continuous arrows), broadens and fades away, until at it is no more discernible from the broad maximum that develops around K. The R-T transition also lowers its temperature (dashed arrows), and the corresponding elastic anomaly looses intensity and sharpness, but remains always clearly visible. The peak in both the real and imaginary parts of the compliance maintains a rather sharp component at a decreasing , but its weight decreases in favor of a broad maximum at which is predominant already at . The existence of two distinct anomalies at and can be related to fact that there are at least three interacting but distinct order parameters, namely M-type and R-type rotations and cation shifts. Accordingly, the compliance presents three main anomalies: the one at is obviously related to the M rotations responsible for the tetragonal distortion, while the other two should involve R-type rotations and cation displacements. The identification of the step with the R/T transition, and therefore the R-type rotations, is clear at and , where the temperature so defined coincides with that determined for the R/T transition by other techniques, and should therefore hold also for the intermediate temperatures (see also the phase diagram below). We remain with the cation shifts as the main responsible for the maximum at .
III.3.1 The anomaly at
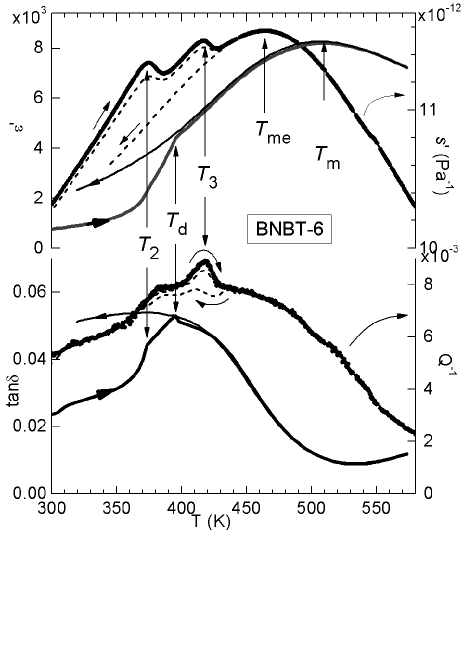
At a new anomaly appears at a temperature indicated as (dotted arrow) in Fig. 5. It would be natural to identify it with the ferroelectric transition at , but two observations cast doubts on this assignment. One is that deduced from the kink in and from the separation of the dielectric curves measured during heating and cooling is slightly different from . Figure 6 compares the anelastic and dielectric curves of two samples of BNBT-6, where the correlation between the anomalies at is excellent (hardly visible in but clear in ) but the identification of with is dubious. The other observation is that in the elastic compliance of NBT there is no trace of (see Fig. 1) and one would expect the same behavior at , unless the ferroelectric transition has changed nature. Indeed, at the temperature separates a FE-R from a AFE-R phase, while at it separates the FE-T phase from a presumably AFE-C or pseudocubic one. Notice that the anomalies of both permittivity and compliance are evident during heating but disappear during cooling, indicating that in the highly disordered NBT-BT there is a slow structural evolution in the R phase, presumably domain coarsening. This is confirmed by the fact that the anomalies on heating require few days of aging at room temperature in order to fully develop. The dashed anelastic curves in Fig. 6 are the result of one week of aging at room temperature after a measurement at high temperature, and the two elastic anomalies are not yet fully developed.
III.4 Dielectric spectra
The dielectric spectra have been extensively discussed,HWN07 ; Isu05b ; SM01 ; GSM04 ; LYH04b ; ZLL09 and here we point out only the main conclusions and some differences with respect to the previous literature.
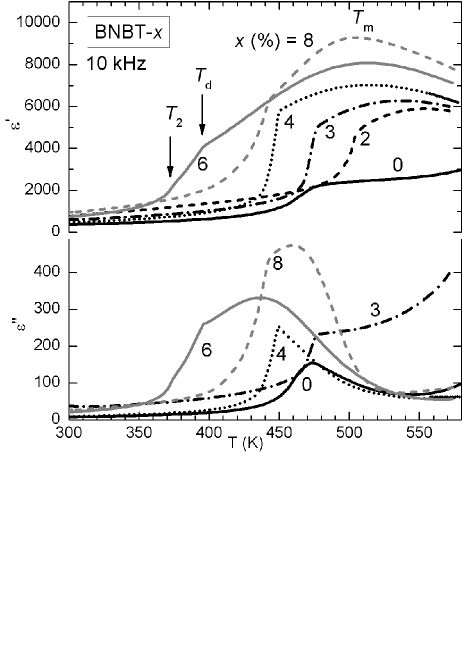
In Fig. 7 a panoramic of the dielectric permittivity and losses measured at 10 kHz during heating of (NBT)1-x(BT)x with is shown. The samples with 2 and 3% Ba had rather high conductivities and hence losses, but the real part at 10 kHz, where the influence of such conductivity effects is reduced, fit well the general trend of growing maximum of at and lowering with increasing . The step at is invisible in this scale at (but see Fig. 3), it is indistinguishable from the ferroelectric transition due to the coincidence of and for but it is again separated from at . A first difference between our measurements and those of Hiruma et al.HWN07 is that we see a single dielectric anomaly already at while they observe such a merging at . We also observed that temperature and width of these steps depend on the sample preparation and the polarization status, being generally sharper and at higher temperature in poled samples.
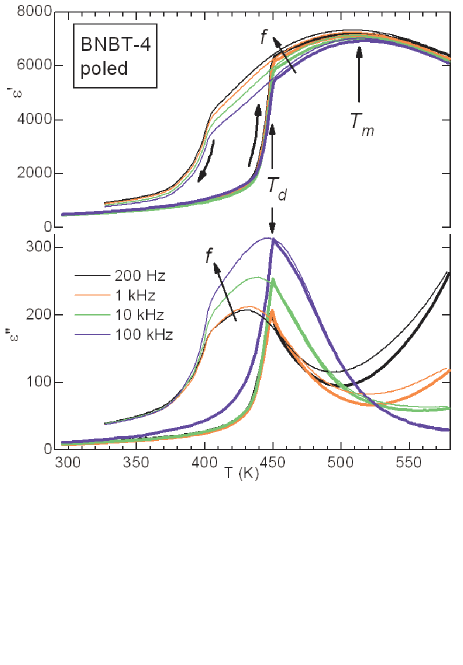
Regarding the frequency dispersion of the dielectric maximum and the presence of a secondary maximum with even stronger frequency dispersion near ,Isu05b ; SM01 Fig. 8 shows the dielectric permittivity of an initially poled sample with measured at different frequencies. There is some frequency dispersion at , although of reduced magnitude with respect to what found in typical relaxor ferroelectrics, but we never found the secondary maximum near ; we only find a neat step during heating in the poled state, with reduced sharpness and temperature during cooling, or heating in the unpoled state. The secondary maximum has been associated with an incommensurate modulation between FE and AFE state,LYH04b ; ZLL09 as found in the highly ordered ferroelectric perovskite Pb(Yb0.5Ta0.5)O3.YK93 Incommensurate modulation of the R phase along the axis of the parent T phase has indeed been found by neutron diffractionBKN06 and its persistence after the disappearance of the T phase has been suggested to be due to some type of ordering in the Na/Bi sublattice. Also TEM experiments indicate a R phase modulated by twins,DTB08 ; DTB09 but at .
Our dielectric and anelastic spectra do not show features necessarily ascribable to incommensurate modulations; the anelastic losses remain high also below and , but this might also be due to generic domain wall motion. Apparently, such walls may give rise to incommensurate modulations, whose morphology likely depends on the sample quality. In this respect, we recall that the dielectric hump that is presumed to accompany incommensurate modulations is enhanced by introducing cation vacancies through La dopingYLH02b or in solid solution with K0.5Bi0.5TiO3SMK03 ; YCC05 ; XJS09 or BaTiO3.GSM04 It is therefore likely that the exact stoichiometry and degree of ordering of cations determine the detailed structural distortions, their correlation lengths and domain morphologies, and the scarce consistency between the results of various experiments is not only due to differences in the properties that are probed but also in the quality of the samples.
III.5 Phase diagram
Figure 9 shows the phase diagram of (NBT)1-x(BT)xdeduced from the present anelastic and dielectric (10 kHz) measurements during heating, together with that available in the literatureHWN07 (grey lines , , ). The latter is mainly based on dielectric measurements and therefore does not include the border between T and C phases. It is sometimes assumed that the paraelectric phase above is cubic, but this cannot be the case at low enough , since the neutron diffraction data show that NBT is tetragonal above and becomes cubic only at K.
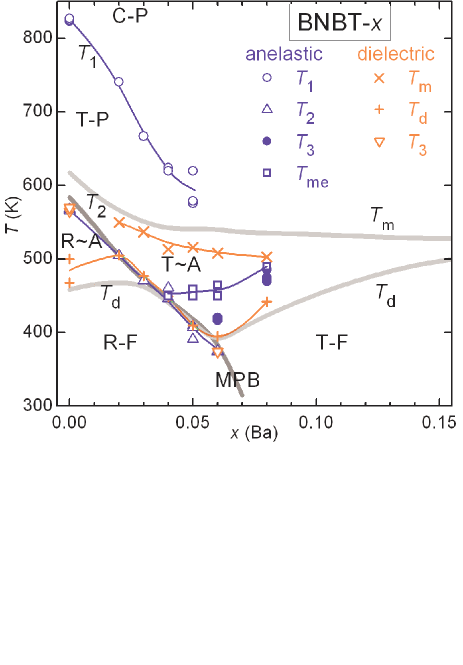
The anelastic spectra of Fig. 5 allow us to draw a line that drops rapidly toward , roughly at the composition of the MPB; similarly to the NBT-PbTiO3 phase diagram.HP96 It is not clear whether merges with the line at or dissolves into an average cubic phase with local tetragonal distortions. The three open circles at refer to three different samples where the anomaly at is extremely shallow and broadened. The region of the phase diagram defined by and is of uncertain nature. In (NBT)1-x(BT)x co-doped with Zr, with a particularly evident relaxor-like frequency dispersion in near , such a region has been defined as a frustrated region with coexistence of ”multiple domain states”.SSO01 The fading away of the anelastic anomaly at with increasing suggests that for and the phase is pseudocubic with local tetragonal distortions whose correlation length must be very small.
The temperature of the broad maximum of is somewhat lower than in Ref. HWN07, , while the temperature of the maximum of the compliance is up to 60 K lower than . A similar phenomenon occurs in the relaxor ferroelectrics Pb(Mg1/3Nb2/3)1-xTixO3 and (Pb/La)(Zr/Ti)O3, where the dielectric maximum is at a temperature higher than the maximum of the elastic compliance but also of the susceptibility deduced from NMR relaxation105 ; 116 (but, unlike dielectric and anelastic spectroscopies, NMR probes also excitations with , see Ref. Vug06, ). This has been explained as the result of the different sensitivity of the three techniques to the polar on one hand and non-polar rotational degrees of freedom on the other hand, all exhibiting a relaxational dynamics which is faster for the rotational ones.116 Indeed, also the dielectric maximum in NBT-BT acquires a dispersion in frequency with Ba doping. In NBT-BT, however, the R-type rotational degrees of freedom undergo a phase transformation at ; therefore, the elastic maximum at should involve other rotational degrees of freedom, possibly also M-type rotations, which are coupled to the polar modes and hence yield dielectric and elastic susceptibility maxima at similar temperatures.
The line separating the R from the T phases joins very soon, at according to Hiruma et al.HWN07 and already at after our measurements. There is some variability in the values of determined from the dielectric curves, depending on the polarization state, but overall there is good agreement with determined from the anelastic spectra on unpoled samples. At the line starts rising, while continues to decrease, determining the MPB.
As noted in the previous paragraphs, the dielectric anomaly at may be not very sharp, especially in unpoled samples, and the marked anomalies measured at may mainly reflect the ferroelectric transition. The compliance, however, is almost unaffected by the ferroelectric transition, and always presents a sharp step at . This means that the rotational instability of R type has a clear onset at a well defined temperature also at compositions where (NBT)1-x(BT)x displays properties typical of highly disordered or relaxor systems. Notably, the sharp step in coexist with the broad maximum at and a T-C transition that is almost completely faded away at (see Figs. 5 and 6). It turns out, therefore, that the polar modes are strongly affected by disorder, characterized by short correlation lengths and undergo a diffuse or relaxor transition; on the other hand, the R-type modes undergo a phase transition which is well-behaved from the elastic point of view, presumably with a long correlation length.
III.6 Morphotropic Phase Boundary and possible monoclinic phase
The composition-temperature phase diagrams of various solid solutions between a perovskite which is rhombohedral at low temperature and one which is tetrahedral, have an almost vertical line that separates the two phases and is called morphotropic phase boundary (MPB). Among the most studied ferroelectric systems of this type are PZTNC06 and PMN-PT.Dav07 After decades of studies on PZT, it has been found that an intermediate monoclinic phase exists in a narrow region at the MPB.GCP00 The identification of such a monoclinic phase, where the direction of the polarization may continuously vary between those in the R and T phases, was possible from high-resolution synchrotron x-ray diffraction experiments and careful analysis of the neutron diffraction data. The possibility for the polarization to continuously rotate between the T and R phases through the monoclinic one is still debated,FFN08 ; SSK07 but is generally considered as the key factor that yields an easy change of polarization under stress and therefore high electromechanical coupling at the MPB compositions.FC00
The solid solution NBT-BT at room temperature passes from R to T at the composition , which is generally identified with the MPB, and where the electromechanical coupling is maximum. Actually, there are few studies aimed at defining the MPB line ,TMS91 ; HWN07 which, to our knowledge, is defined by only two points at and 0.07. Other tetragonal perovskites that give rise to a MPB with NBT are PbTiO3HP96 and K0.5Bi0.5TiO3, but in the latter the composition of KBT at the border between R and T at room temperature has been reported to range between 0.17 and 0.8.XJS09
Besides better defining the MPB line, it would be interesting to investigate whether also NBT-BT has an intermediate monoclinic phase that allows continuous rotation of the polarization between the pseudocubic and directions. The identification of a monoclinic phase by diffraction would certainly be more difficult for (NBT)1-x(BT)x than for PZT, due to the larger disorder caused by the coexistence of ions with different charges, Na+, Bi3+ and Ba2+ in the A sublattice with respect to Zr4+ and Ti4+, which have the same charge. The signature of the M phase should be more evident in the elastic compliance versus temperature: in fact, the reciprocal Young’s modulus of PZT has a large peak in correspondence with the MPB,127 that may be simply explained in terms of the usual Landau free energy expansion with a coupling term linear in strain and quadratic in the polarization, if the polarization may rotate in a monoclinic phase instead of switching between R and T phases.127
The case of (NBT)1-x(BT)x is more complicated than PZT, since there is no single transformation between T and M, but two distinct processes: a R-T transformation at and a diffuse transformation around and . The first is well behaved from the elastic point of view, with the expected sharp step in the compliance at the R-type rotational instability.CS98 If monoclinic distortions exist, they must be connected with the diffuse process. The fact that it is the main feature in the dielectric susceptibility indicates that it is due to polar modes, while the strong peaked response in the elastic compliance recalls the behavior of the monoclinic phase of PZT. At variance with PZT, however, there should not be a monoclinic phase, but only local monoclinic distortions with short correlation lengths, thereby producing a diffuse response. This is in agreement with recent NMRASI08 and diffuse x-ray scattering experiments,KBD03 both revealing additional displacements of the Na/Bi ions away from the rhombohedral direction along , producing a local monoclinic symmetry. The existence of monoclinic regions is also supported by a diffuse scattering experiment,KBD03 from which it can be deduced that they are shaped as platelets one or two cell thick and 20 nm wide.
IV Conclusions
We measured the complex dielectric permittivity and elastic compliance of (NBT)1-x(BT)x with . The anelastic spectra contain anomalies at both the temperatures and of the tetragonal-cubic and tetragonal-rhombohedral transitions, plus a broad maximum at a temperature , which is up to 60 K lower then of the the diffuse dielectric maximum. The line in the phase diagram drops rapidly with and can be followed up to , where the transition becomes so diffuse and weak to be hardly recognizable. At higher Ba substitution, the high temperature structure should be pseudocubic with short range tetragonal distortions. Instead, the elastic anomaly at is extremely sharp in pure NBT and remains distinct up to , demonstrating that there is a well defined onset of the R-type octahedral rotations producing the R structure, in spite of the numerous indications of extremely diffuse transition and structural heterogeneity. The dielectric permittivity in our samples does not have a secondary maximum with frequency dispersion around the ferroelectric transition at , as often reported; instead, we observe steps both at and (which however coincide for ), whose exact temperature and sharpness depend on the sample state and polarization. These features are common to samples prepared under different temperature and time schedules, if precautions are taken in order to avoid Bi loss during sintering; otherwise, the anelastic and dielectric spectra indicate extremely blurred structural transformations and defective material, especially above 800 K, where Na diffusion becomes possible through the vacancy mechanism.
The anelastic and dielectric anomalies should be connected to the non-polar rotational modes of the octahedra and polar cation displacement as follows. The M-type rotations giving rise to the T phase becomes unstable at , but the correlation length of such modes rapidly decreases with Ba substitution, so that at no long range T order exists any more. The R-type rotations giving rise to the R distortion are unstable at , and maintain long range correlations up to , which is the Ba composition of the morphotropic phase boundary. The diffuse dielectric maximum at and elastic maximum at should be due to polar modes, whose correlation length remains short unless an external poling field is applied or aging of the order of several days at room temperature is allowed.
With Ba substitution, the broad peak in the elastic compliance becomes preponderant over the R-T transition and, by analogy with the behavior of PZT with monoclinic structure at the MPB, the possibility is discussed that on the local scale the polarization may have an intermediate direction between R and T.
Acknowledgments
The authors sincerely thank Mr. C. Capiani for the skillful preparation of the samples, P.M. Latino for improvements in the electronics for the anelastic experiments, A. Morbidini and F. Corvasce for improvements in the sample holders for the anelastic experiments. F.C. and F.C. also thank E.K.J. Salje for helpful discussions. Financial support by CNR under the Free Theme Research RSTL “Ferroelectric and relaxor materials”, Grant n. 250 is gratefully acknowledged.
References
- (1) V. Dorcet, G. Trolliard and P. Boullay, Chem. Mater. 20, 5061 (2008).
- (2) G.O. Jones and P.A. Thomas, Acta Cryst. B 58, 168 (2002).
- (3) I.P. Aleksandrova, A.A. Sukhovsky, Yu.N. Ivanov, Yu.E. Yablonskaya and S.B. Vakhrushev, Ferroelectrics 378, 16 (2009).
- (4) A.I. Fedoseev, S.G. Lushnikov, S.N. Gvasaliya, P.P. Syrnikov and S. Kojima, Phys. Sol. State 51, 1399 (2009).
- (5) I.G. Siny, C.-S. Tu and V.H. Schmidt, Phys. Rev. B 51, 5659 (1995).
- (6) J. Suchanicz, J. Mater. Sci. 37, 489 (2002).
- (7) A.S. Nowick and B.S. Berry, Anelastic Relaxation in Crystalline Solids. (Academic Press, New York, 1972).
- (8) C.-S. Tu, I.G. Siny and V.H. Schmidt, Phys. Rev. B 49, 11550 (1994).
- (9) T. Oh and M.-H. Kim, Mater. Sci. Engin. B 132, 239 (2006).
- (10) Y. Hiruma, H. Nagata and T. Takenaka, J. Appl. Phys. 104, 124106 (2008).
- (11) S.B. Vakhrushev, V.A. Isupov, B.E. Kvyatkovsky, N.M. Okuneva, I.P. Pronin, G.A. Smolensky and P.P. Syrnikov, Ferroelectrics 63, 153 (1985).
- (12) J. Suchanicz, Mater. Sci. Engin. B 55, 114 (1998).
- (13) A.M. Balagurov, E.Yu. Koroleva, A.A. Naberezhnov, V.P. Sakhnenko, B.N. Savenko, N.V. Ter-Oganessian and S.B. Vakhrushev, Phase Trans. 79, 163 (2006).
- (14) J. Petzelt, S. Kamba, J. Fábry, D. Noujni, V. Porokhonskyy, A. Pashkin, I. Franke, K. Roleder, J. Suchanicz, R. Klein and G.E. Kugel, J. Phys.: Condens. Matter 16, 2719 (2004).
- (15) I.P. Aleksandrova, Yu.N. Ivanov, A.A. Sukhovskii and S.B. Vakhrushev, Phys. Sol. State 48, 1120 (2006).
- (16) V. Dorcet, G. Trolliard and P. Boullay, J. Magn. Magn. Mater. 321, 1758- 1761 (2009).
- (17) S.G. Lushnikov, S.N. Gvasaliya, I.G. Siny, I.L. Sashin, V.H. Schmidt and Y. Uesu, Science 116, 41 (2000).
- (18) J. Kreisel, P. Bouvier, B. Dkhil, P.A. Thomas, A.M. Glazer, T.R. Welberry, B. Chaabane and M. Mezouar, Phys. Rev. B 68, 014113 (2003).
- (19) J. Hlinka, J. Petzelt, S. Kamba, D. Noujni and T. Ostapchuk, Phase Trans. 79, 41 (2006).
- (20) H.Y. Tian, D.Y. Wang, D.M. Lin, J.T. Zeng, K.W. Kwok and H.L.W. Chan, Science 142, 10 (2007).
- (21) Y. Hiruma, H. Nagata and T. Takenaka, Jpn. J. Appl. Phys. 45, 7409-7412 (2006).
- (22) A.M. Glazer, Acta Cryst.. B 28, 3384 (1972).
- (23) U.J. Nicholls and R.A. Cowley, J. Phys. C: Solid State Phys. 20, 3417- 3437 (1987).
- (24) M.A. Carpenter and E.H.K. Salje, Eur. J. Mineral. 10, 693 (1998).
- (25) J. Suchanicz, J. Phys. C: Solid State Phys. 62, 1271 (2001).
- (26) Y. Qu, D. Shan and J. Song, Mater. Sci. Engin. A 121, 148 (2005).
- (27) I.P. Aleksandrova,, A.A. Sukhovsky, Yu.N. Ivanov, Yu.E. Yablonskaya and S.B. Vakhrushev, Phys. Sol. State 50, 496 (2008).
- (28) N. Setter and L.E. Cross, J. Appl. Phys. 51, 4356 (1980).
- (29) S.-E.Park, S.-J.Chung, I.-T.Kim, K.S. Hong, J. Am. Ceram. Soc. 77, 2641 (1994).
- (30) J.-K. Lee, J.Y. Yi and K.-S. Hong, Jpn. J. Appl. Phys. 40, 6003 (2001).
- (31) J.-K. Lee, K.S. Hong, C.K. Kim and S.-E. Park, J. Appl. Phys. 91, 4538 (2002).
- (32) D.I. Woodward and I.M. Reaney, Acta Cryst. B 61, 387 (2005).
- (33) Y. Hiruma, H. Nagata and T. Takenaka, J. Appl. Phys. 105, 084112 (2009).
- (34) Y. Hiruma, Y. Watanabe, H. Nagata and T. Takenaka, Key Engineering Materials 350, 93 (2007).
- (35) V.A. Isupov, Ferroelectrics 315, 123 (2005).
- (36) S. Said and J.-P. Mercurio, J. Electroceram. 21, 1333 (2001).
- (37) J.-R. Gomah-Pettry, S. Saïd, P. Marchet and J.-P. Mercurio, J. Eur. Ceram. Soc. 24, 1165 (2004).
- (38) J.-K. Lee, J.Y. Yi and K.S. Hong, J. Appl. Phys. 96, 1174 (2004).
- (39) C. Zhou, X. Liu, W. Li, C. Yuan and G. Chen, J. Mater. Sci. 44, 3833 (2009).
- (40) N. Yasuda and J. Konda, Appl. Phys. Lett. 62, 535 (1993).
- (41) J.Y. Yi, J.-K. Lee and K.S. Hong, Ferroelectrics 270, 203 (2002).
- (42) J. Suchanicz, J.P. Mercurio, K. Konieczny and T.V. Kruzina, Ferroelectrics 290, 161 (2003).
- (43) X. Yi, H. Chen, W. Cao, M. Zhao, D. Yang, G. Ma, C. Yang and J. Han, J. Cryst. Growth 281, 364 (2005).
- (44) H. Xie, L. Jin, D. Shen, X. Wang and G. Shen, J. Cryst. Growth 311, 3626 (2009).
- (45) K.S. Hong and S.-E. Park, J. Appl. Phys. 79, 388 (1996).
- (46) S.A. Sheets, A.N. Soukhojak, N. Ohashi and Y.-M. Chiang, J. Appl. Phys. 90, 5287 (2001).
- (47) F. Cordero, F. Craciun and P. Verardi, Ferroelectrics 290, 141 (2003).
- (48) F. Cordero, M. Corti, F. Craciun, C. Galassi, D. Piazza and F. Tabak, Phys. Rev. B 71, 094112 (2005).
- (49) B.E. Vugmeister, Phys. Rev. B 73, 174117 (2006).
- (50) B. Noheda and D.E. Cox, Phase Transitions 79, 5 (2006).
- (51) M. Davis, J. Electroceram. 19, 23 (2007).
- (52) R. Guo, L.E. Cross, S-E. Park, B. Noheda, D.E. Cox and G. Shirane, Phys. Rev. Lett. 84, 5423 (2000).
- (53) J. Frantti, Y. Fujioka and R.M. Nieminen, J. Phys.: Condens. Matter 20, 472203 (2008).
- (54) E.P. Smirnova, A.V. Sotnikov, O.E. Kvyatkovskii, M. Weihnacht and V.V. Lemanov, J. Appl. Phys. 101, 084117 (2007).
- (55) H. Fu and R.E. Cohen, Nature 403, 281 (2000).
- (56) T. Takenaka, K. Maruyama and K. Sakata, Jpn. J. Appl. Phys. 30, 2236 (1991).
- (57) F. Cordero, F. Craciun and C. Galassi, Phys. Rev. Lett. 98, 255701 (2007).