1The George Washington University, 725 21st St,
NW, Washington, D.C. 20052, USA.
2NASA Goddard Space Flight
Center, Astroparticle Physics Laboratory, Code 661, Greenbelt, MD
20771, USA.
3Center for Cosmology and Astro-Particle Physics
(CCAPP) Fellow/Department of Physics, The Ohio State University,
191 West Woodruff Avenue, Columbus, OH 43210, USA.
The lag-luminosity relation in the gamma-ray burst source-frame
Abstract
We have investigated the empirical lag-luminosity relation in the Gamma-ray Burst (GRB) source-frame. We selected two energy bands ( keV and keV) in the GRB source-frame, which after redshift correction, lie in the observer-frame energy range of the Burst Alert Telescope (BAT). The spectral lags between these energy channels are then presented as a function of the isotropic peak luminosity of the GRBs in the sample.
1 Introduction
Spectral lag is a common feature in Gamma-ray Bursts (GRBs). The lag is defined as the difference in time of arrival of high and low energy photons and is considered positive when the high-energy photons arrive earlier than the low energy ones. Norris et al. reported a correlation between spectral lag and the isotropic peak luminosity of GRBs based on a limited sample [1]. Subsequently, various authors have studied the lag-luminosity relation using arbitrary observer-frame energy bands of various instruments [2, 3].
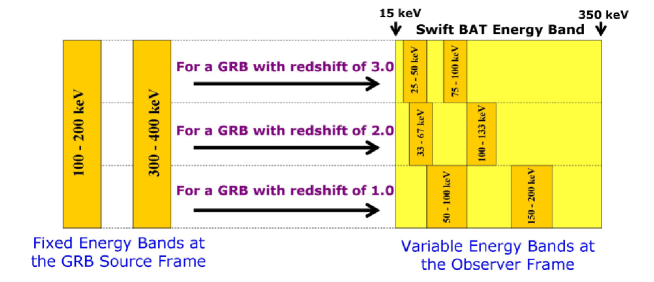
Typically the spectral lag () is extracted in two arbitrary energy bands in the observer-frame. However, because of the redshift (z) dependance of GRBs, the two energy bands can correspond to multiple energy bands in the source-frame thus introducing a variable energy dependant factor, which is difficult to take into account. We avoid this difficulty by defining two energy bands ( keV and keV) in the GRB source-frame and projecting these two bands into the observer-frame using the relation . For our sample of GRBs, after projecting to the observer-frame, the selected energy bands lie in the Burst Alert Telescope (BAT) [4] energy range ( keV; see Fig. 1). Then we extracted the spectral lags between these energy channels, correct them for cosmological time dilations using the relation, and plot them as a function of the isotropic peak luminosity.
2 Methodology
BAT is a highly sensitive coded aperture instrument [5]. BAT uses the modulation pattern resulting from the coded mask to facilitate background subtraction in the light curve and the spectral processing. This process is called mask weighting. We used the mask weighted, background-subtracted light curves, as well as non-mask weighted light curves in our analysis. The non-mask weighted light curves have about 30% better signal-to-noise ratio than the mask weighted light curves. Hence, when the signal-to-noise ratio of mask weighted light curves was too small, non-mask weighted light curves were used to extract spectral lags.
The spectral lags were extracted using improved cross-correlation function (CCF) analysis method described in reference [2]. In this method the spectral lag is extracted by finding the time delay corresponding to the global maximum of the CCF. A Gaussian curve was fitted to the CCF to extract the spectral lag. The uncertainty in the spectral lag is obtained by simulating 1,000 light curves and repeating the aforementioned procedure. The standard deviation of the simulated spectral lag values is taken as the lag uncertainty. The isotropic peak luminosity (), for each GRB, is obtained by calculating the peak flux for the source-frame energy range, 1.0 keV to 10,000 keV, using the observed spectral-fit parameters and the luminosity distance as described in [2].
3 Results
We used the sample of 31 GRBs in reference [2]. However, some of the GRBs in the sample did not have enough signal-to-noise to extract a spectral lag limiting the final sample to 22 GRBs.
In our analysis, we have selected the GRB source-frame energy bands keV and keV due to the energy range of BAT and the redshift range of our sample. For mask weighted light curves, the effective energy range of the BAT reduces to 15-200 keV, which implies a GRB redshift range of 1 to 5.7. However, for the non-mask weighted light curves we don’t have such a restriction and the full BAT energy range ( keV) can be utilized. In this case the redshift lower limit can be as low as 0.2. Our final sample of 22 GRBs have redshift ranging from 0.54 to 5.46.
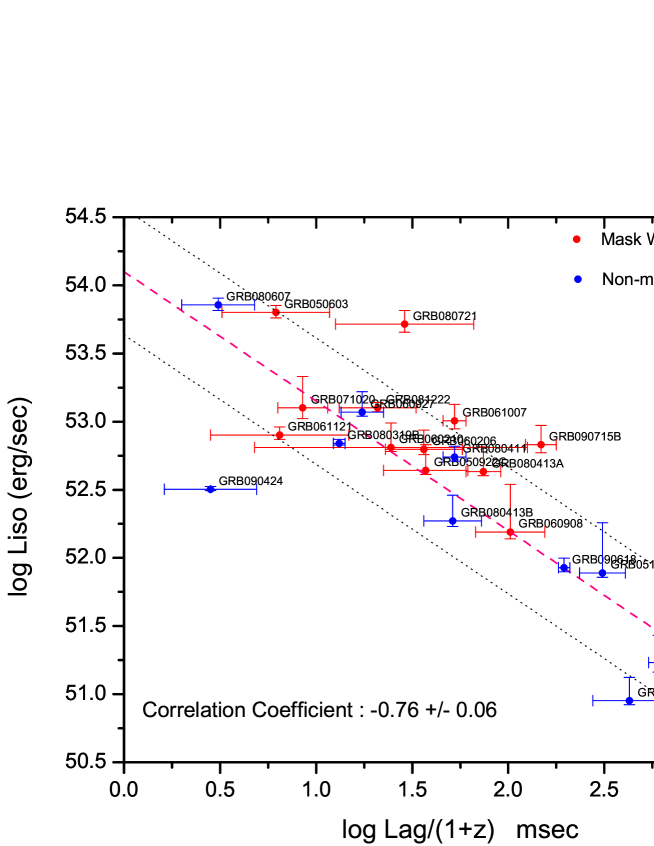
In Fig. 2, is plotted as a function of redshift corrected spectral lag. The spectral lag is anti-correlated with with a correlation coefficient of -0.76 0.06. The index of the best-fit power-law is , which is shallower compared to observer-frame results from Norris et al. 2000 [1] () and Ukwatta et al. 2009 [2] ().
4 Summary and Discussion
We have investigated the spectral lag between keV and keV energy bands at the GRB source-frame by projecting these bands to the observer-frame. This is a step forward in the investigation of lag-luminosity relation since all previous investigations used arbitrary observer-frame energy bands. The correlation coefficient of shows a significant improvement over the average correlation coefficient of reported in the reference [2].
References
- [1] Norris, J. P., Marani, G. F., & Bonnell, J. T. 2000, ApJ., 534, 248
- [2] Ukwatta, T. N., et al. 2010, ApJ., 711, 1073
- [3] Hakkila, J., et al. 2008, ApJ. Lett., 677, L81
- [4] Gehrels, N., et al. 2004, ApJ., 611, 1005
- [5] Barthelmy, S. D., et al. 2005, Space Science Reviews, 120, 143