Sprite discharges on Venus and Jupiter-like planets:
a laboratory investigation
D. Dubrovin1, S. Nijdam2, E.M. van Veldhuizen2,
U. Ebert2,3, Y. Yair4, C. Price1
1 Tel-Aviv University, Tel-Aviv 69978, Israel,
2 Department of Physics, Eindhoven University of Technology,
P.O.Box 513, 5600MB Eindhoven, The Netherlands,
3 Centrum Wiskunde & Informatica (CWI), P.O.Box 94079,
1090GB Amsterdam, The Netherlands,
4 The Open University of Israel, Ra’anana 43107, Israel.
Accepted for publication in
Journal of Geophysical Research - Space Physics,
Special Section related to the Chapman Conference on the
Effects of Thunderstorms and Lightning in the Upper Atmosphere
30 December 2009
Abstract
Large sprite discharges at high atmospheric altitudes have been found to be physically similar to small streamer discharges in air at sea level density. Based on this understanding, we investigate possible sprite discharges on Venus or Jupiter-like planets through laboratory experiments on streamers in appropriate CO2–N2 and H2–He mixtures. First, the scaling laws are experimentally confirmed by varying the density of the planetary gasses. Then streamer diameters, velocities and overall morphology are investigated for sprites on Venus and Jupiter; they are quite similar to those on earth, but light emissions in the visible range are fainter by two orders of magnitude. The discharge spectra are measured; they are dominated by the minority species N2 on Venus, while signatures of both species are found on Jupiter-like planets. The spectrum of a fully developed spark on Venus is measured. We show that this spectrum is significantly different from the expected sprite spectrum.
1 Introduction
1.1 Sprite discharges on earth
Lightning on earth is often accompanied by electric discharges in the upper atmosphere, known as TLE’s (transient luminous events). The various TLE’s observed in the terrestrial atmosphere consist of several distinct phenomena, which are known as sprites, ELVES, blue jets, as well as several other sub-species. Red sprites are an impressive display of light above the thunderclouds which span a vertical range of 50 to 90 km above the surface and take many forms. They are red in color, although their lowermost, tendril-like part can be blue, e.g. see Sentman et al. (1995).
The mechanism of sprite production on earth is now being understood with increasing precision (Pasko et al. (1997), Raizer et al. (1998), Hu et al. (2002), Hu et al. (2007), Pasko (2007), Stenbaek-Nielsen and McHarg (2008), Luque and Ebert (2009)). It is based on the quasi-electrostatic approximation. The charge separation within the thundercloud is slow enough that the conductivity in the mesosphere and the ionosphere can screen the emerging electric fields. However, a lightning stroke changes the charge content of the cloud and the surface so rapidly, that the newly generated electric fields are not screened immediately and appear up to the ionosphere. As the breakdown electric field depends on atmospheric density, it decreases strongly with altitude, and therefore the lightning generated electric field can exceed the breakdown field at a sufficiently high altitude (Wilson (1925)). This is a necessary condition for the emergence of a sprite a few to several tens of milliseconds after the parent lightning (Sao Sabbas et al. (2003); Cummer et al. (2006); Hu et al. (2007)), but sprites do not always appear in the mesosphere even if the quasi-electrostatic field is there (Luque and Ebert (2009)). According to recent triangulations by Stenbaek-Nielsen et al. (2009), sprites emerge at altitudes of 66 to 89 km. High-speed imaging showed that sprites start with downward moving streamer heads (Cummer et al. (2006); Stenbaek-Nielsen et al. (2007); McHarg et al. (2007)), and telescopic imaging shows that single channels have diameters of tens to hundreds of meters (Gerken et al. (2000)). A review of sprite properties on earth can be found in Stenbaek-Nielsen and McHarg (2008).
1.2 Lightning and sprites on other planets
Lightning discharges are the energetic manifestation of the microphysical and thermodynamical processes occurring within clouds that reside in a planetary atmosphere. In the solar system, lightning had been detected by spacecraft via direct optical imaging on Earth and Jupiter, and by electromagnetic remote sensing on Earth, Venus, Jupiter, Saturn, Neptune and Uranus. Recently, Ruf et al. (2009) reported ground-based detection of non-thermal emission from a Martian dust storm, which they attributed to electrical discharges. No signature of lightning activity had been discovered on Titan, Pluto and Mercury. We refer the reader to the recent comprehensive reviews on planetary lightning by Desch et al. (2002) and Yair et al. (2008). We will elaborate here on the findings that concern lightning on Venus and on Jupiter. On Venus, lightning activity had been deduced based on the VLF emission detected by the Soviet landers Venera 11 and 12 (Ksanfomality (1980)). However, the data from top-side observations by various spacecraft have not shown un-equivocal optical or electromagnetic signatures, especially after the fly-byes of the Galileo and Cassini spacecraft (Gurnett et al. (1991, 2001)). Krasnopolsky (2006) reported earth-based measurements of high-resolution spectra of Venus in the NO band at 5.3 µm and found an NO content of ppb below 60 km altitude. Such a concentration cannot be explained by cosmic-ray induced chemistry and the suggested mechanism is production by lightning. Russell et al. (2007) had analyzed the Venus Express magnetometer data and inferred a global flash rate on Venus which is comparable to that on Earth, . It is hard to explain how such a high flash rate can occur in the stratiform clouds on Venus. Based on conventional charge-separation processes which occur in terrestrial thunderclouds, Levin et al. (1983) had shown that the charging rate of the clouds on Venus should be considerably slower than on Earth, and the resulting flash rate should be of the order of few per hour. This does not rule out the possibility that other, unknown charging mechanisms do operate within the clouds, leading to rapid electrification and frequent lightning. On Jupiter, the Voyager, Galileo, Cassini and New-Horizons missions found clear indications that lightning discharges are prevalent (Borucki and Magalhaes (1992); Baines et al. (2007)). They are thought to occur in the deep H2O clouds that exist in the jovian atmosphere and are estimated to be roughly 100 times more energetic than on Earth (Yair et al. (1995)).
Since lightning has been found in planetary atmospheres, it seems reasonable to assume that some form of TLE, like sprites, occur there as well. Yair et al. (2009) estimated the altitude in which breakdown can occur above the cloud deck in various planetary atmospheres, using the quasi-electrostatic approximation first proposed by Wilson (1925). Yair et al. (2009) predict that for sufficiently large charge moments, sprites can form in the atmospheres of Venus and Jupiter.
The Japanese Climate Orbiter, Planet-C, planned to be launched in 2010, will search for lightning on Venus (see Nakamura et al. (2007); Takahashi et al. (2008)). However, the venusian thick cloud layers might inhibit optical observations. Yair et al. (2009) expect that, if lightning exists, sprites may form above the upper most cloud deck, and thus could be easily observed by an orbiting spacecraft, both on Venus and on Jupiter. The altitude, diameter, shape and light emission of the observed sprites could yield valuable information about the charge configuration in the clouds below, as well as about the gas composition of the upper atmosphere of the planet. In this work we investigate the expected spectrum of sprites and their morphology via laboratory experiments. This information can be useful in finding and identifying sprites in upcoming observations.
1.3 Laboratory experiments on sprites
1.3.1 Streamers and Scaling Laws
It is by now well understood that the large sprite discharges at low air density are essentially up-scaled versions of small streamer discharges at high air density that dominate the initial breakdown of large gas volumes in a sufficiently strong electric field. As discussed by Ebert et al. (2006); Pasko (2007); Briels et al. (2008a); Ebert et al. (2009) and supported by observations by Gerken and Inan (2003); Marshall and Inan (2006); McHarg et al. (2007) and by simulations by Liu and Pasko (2004); Pasko (2006); Luque et al. (2007, 2008); Luque and Ebert (2009), streamers and sprites are essentially related through similarity or scaling laws. Similarity laws for discharges in gasses of the same composition, but of different density were probably first formulated by Townsend for the so-called Townsend discharge at the beginning of the 20th century; they are discussed in many textbooks of gas discharge physics. While there are also many deviations from similarity in other discharges, similarity in the propagating heads of streamer discharges holds particularly well because these fast processes are dominated by collisions of single electrons with neutral molecules, while two-step processes and three-particle processes that would be density dependent, are negligible on these short time scales. This implies that the basic length scale of the streamer discharge is the mean free path of the electron which is inversely proportional to the density of the medium, . Similarity at varying density implies that the streamer velocity, as well as velocity and energy distributions of individual electrons are the same at similar places, while length scales as , electric fields as etc. The similarity of the overall morphology including diameters and velocities of streamers and sprites in terrestrial air of varying density were recently confirmed experimentally by Briels et al. (2008a) (see also discussion by Ebert et al. (2009)).
The basic arguments for the similarity laws between streamers at different gas densities do not depend on the gas composition, and indeed the similarity laws were recently confirmed experimentally by Nijdam et al. (2010) for widely varying mixing ratios of N2 and O2 and for argon. This opens a possibility to simulate planetary sprites through laboratory experiments on the corresponding gas mixtures. To the best of our knowledge such simulations were never performed in gas mixtures specifically chosen to simulate planetary atmospheres other than earth. We here investigate sprites on Venus and Jupiter by means of creating streamer discharges in gas mixtures that correspond to the planetary atmospheres of Venus and Jupiter respectively, CO2-N2 (96.5%-3.5%) and H2-He (89.8%-10.2%), respectively. The mixtures’ compositions are based on the NNSDC (compiled by Williams, http://nssdc.gsfc.nasa.gov/planetary/planetfact.html).
It is well known that a minimal voltage is required to start streamer discharges from a needle electrode. This voltage is called the inception voltage; it depends on electrode shape and material as well as on gas composition and density and (up to now) has no direct interpretation in terms of microscopic discharge properties. The streamers that are formed at the inception voltage have a minimal diameter, but if the voltage rises rapidly to a voltage higher than the inception voltage, considerably thicker and faster streamers can emerge, which eventually break up into more and thinner streamers until the thinnest streamers again have the minimal diameter (Briels et al. (2006, 2008b)). Therefore sprite tendrils should also attain a minimal diameter, even though a sprite does not, of course, emerge from a needle electrode (Luque and Ebert (2009)). The minimal diameter at each pressure is a convenient quantity to test the similarity laws as the product of minimal diameter and density (reduced minimal diameter) should not depend on density (Briels et al. (2008a)). In section 3, we confirm the similarity laws for positive streamers in gas mixtures that correspond to the atmospheres of Venus and Jupiter.
1.3.2 Sprite spectrum
In looking for planetary sprites, the expected spectrum of their optical emissions is of major importance. Such knowledge allows identifying sprites and constructing observation devices. Laboratory settings are convenient for performing such measurements. Terrestrial sprites’ spectrum was successfully simulated by Williams et al. (2006), who have created a “sprite in the bottle” in a glow discharge tube. This experiment was repeated by Goto et al. (2007). The spectrum measured by this method agrees with the spectrum of terrestrial sprites, measured by Mende et al. (1995) and Hampton et al. (1996). To our knowledge, the simulation of planetary sprites’ spectra was not attempted yet.
Sprites are transient discharges, believed to be equivalent to streamers at higher pressures, therefore a laboratory streamer discharge should simulate a sprite much better than a glow discharge. Both streamer and glow are so-called low temperature discharges (i.e., the temperature of the neutral gas molecules does not increase much within the plasma). A streamer is a very transient process, where an ionization front moves rapidly within a locally enhanced electric field that well exceeds the breakdown value. At the same time the electric field outside the streamer head can be significantly weaker than the breakdown field. While creating an ionized trail behind it, only the moving streamer head emits light. The glow discharge, on the other hand, is stationary; therefore excitation levels, chemical reactants and ions that can be generated in several steps, are present. The entire glow column is ionized and emits light, and the electric field within it is well below the breakdown field.
In our experiments, the discharges are created by voltage pulses of s duration. The streamers emit more light at lower pressures, where they also easily transit into stationary glow, that is even brighter. These are the conditions where the spectrum can be measured in a reasonable time span. Thus the spectrum we report in section 4 is in fact the spectrum of a discharge that starts as a streamer and quickly transforms into a glow column. Recent experiments with a new electric circuit able to generate much shorter voltage pulses that create streamers that do not turn into glow, have shown that the spectra of streamer discharges and of short pulsed glow discharges are quite similar in pure nitrogen at pressures between 25 and 200 mbar (Nijdam et al., http://arxiv.org/abs/0912.0894v1, version 1). To suppress multi-step processes that do not occur in a streamer head, we use a low frequency repetitive discharge, with a frequency of 1 or 10 Hz, rather than a stationary or high frequency discharge. In a low frequency repetitive discharge, such as the one described here, there is enough time for the gas to return to its original neutral state, or for the reaction products to be flushed away by the gas flow, if present.
We remark that several research groups have measured spectra of hot plasmas to simulate lightning in planetary atmospheres. Borucki et al. (1996) created hot plasma using a laser pulse and measured the emission spectrum. The conditions in that experiment resemble those in the hot plasma lightning channel, where many chemical processes take place due to high temperature rather than due to a high electric field. Goto and Ohba (unpublished report, 2008), simulated the lightning spectrum in pure CO2 using spark discharges. In section 4.4 we report our measurements of the spectrum of sparks in the mixture that represents Venus’ atmosphere. The spectrum of the cold plasma streamer and glow discharge is significantly different from that of the hot plasma spark discharge in this mixture, and the same is probably true in other gas mixtures. Unfortunately we have not been able to produce a spark in the jovian mixture with our set-up. We observed that the glow discharge became stronger, but did not transform into a spark discharge. Due to time limitations, we did not investigate the reason for this.
1.4 Outline
In the following we review our experiments on two planetary gas mixtures, CO2-N2 representing Venus and H2-He representing Jupiter. In section 2.1 we give a description of the experimental setup, and in section 2.2 we give a qualitative description of the discharges observed. We discuss the qualitative similarities and differences between the two planetary gasses and dry air. Dry air was examined in previous experiments by Briels et al. (2008a) and Nijdam et al. (2010). Section 3 deals with scaling laws in the two planetary gasses. We measure the reduced minimal diameter of streamers and their velocity. We are able to confirm that scaling laws apply to our gasses, based on the reduced diameter measurements. In section 4 we present the spectra we measured in streamer and glow discharges in the two gasses at a pressure of 25 mbar, and the spark spectrum in the Venus mixture, that was measured at a pressure of 200 mbar.
2 Experimental set-up and overview of the discharges
2.1 Set-up
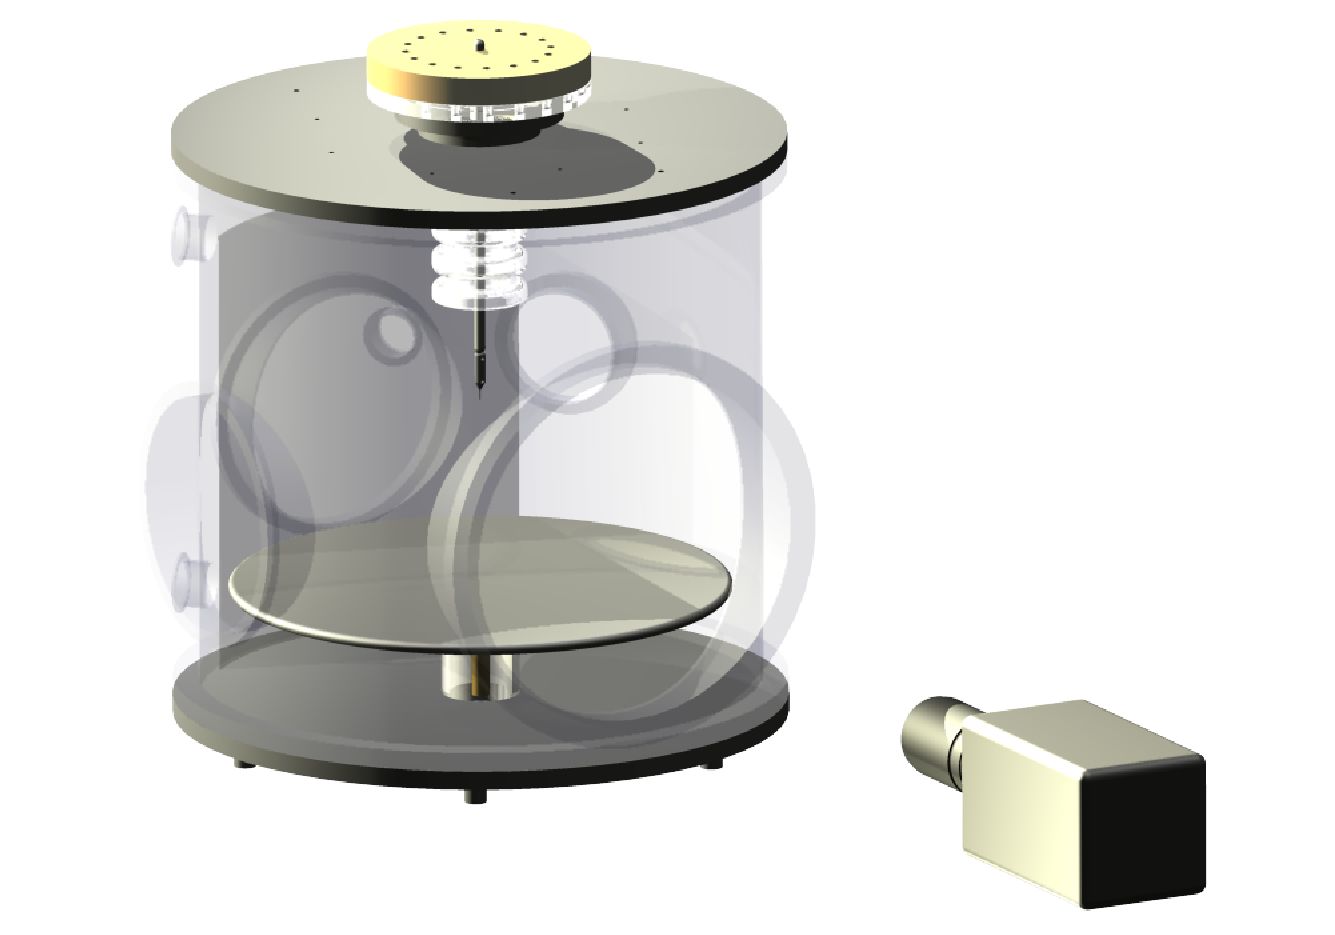
Positive streamers are created in a large cylindrical stainless steel vacuum vessel with an internal diameter of 50 cm and an internal height of 30 cm. The vacuum vessel contains a sharp tungsten tip, placed 16 cm above a grounded plate. The whole vessel is placed inside a Faraday cage. A large quartz window is positioned on the vacuum vessel. The Faraday cage contains a window, covered by a conducting layer of Indium-Tin-Oxide (ITO), through which the discharges can be photographed by a camera outside the Faraday cage. This window is transparent to visible light, but not to UV radiation of wavelengths below 300 nm. The streamer discharge is imaged by a Stanford Computer Optics 4QuickE ICCD camera through a Nikkor UV 105 mm f/4.5 lens. The imaging set-up is sensitive to wavelengths from 300 to 800 nm. A schematic drawing of the vacuum vessel with the camera is given in Figure 1.
We have used a set-up that is specifically designed to ensure the purity of the gasses inside. For this reason, the set-up can be baked to reduce out-gassing, it contains no plastic parts, except for the o-ring seals and it stays closed all the time. When not in use, the set-up is pumped down to a pressure of about mbar.
During the experiments, we have used constant pressures between 25 and 1000 mbar. The gas inside the set-up is flushed constantly. The absolute flow rate is controlled by a mass-flow controller and depends on pressure. The flow rate is chosen so that all the gas is replaced every 25 minutes. This ensures that the contamination caused by out-gassing or leaks is significantly below 1 ppm for all pressures used. We use two different gas mixtures that are pre-mixed by the supplier: a mixture (Venus) that consists of 96.5% CO2 and 3.5% N2 and a mixture (Jupiter) that consists of 89.8% H2 and 10.2% He. According to the specifications, the contamination level is below 1 ppm for both mixtures. As an extra safety measure, we never fill the vessel with more than 800 mbar of the flammable H2-He mixture.
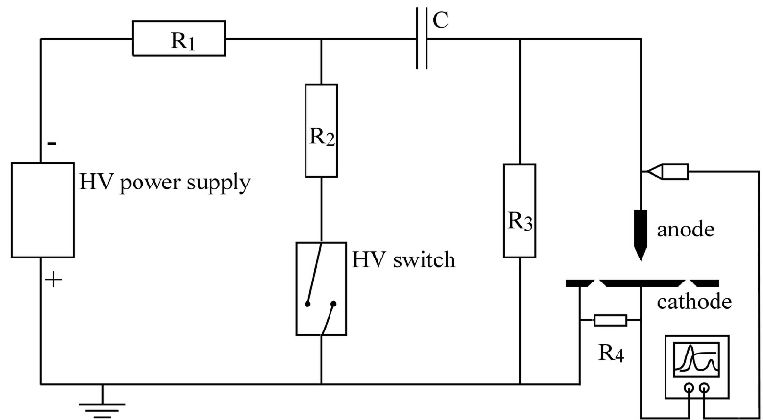
During a measurement, a voltage pulse is applied to the anode tip. A 1 nF capacitor is charged by a high voltage negative DC source. Now a trigger circuit triggers a spark gap, which acts as a fast switch. The capacitor is discharged and applies a positive voltage pulse on the anode tip. Positive streamers are initiated near the anode tip and propagate in the direction of the plate. This pulse has a rise-time of about 15 ns and a fall time of about 10 µs, depending on the choices for the resistors and the streamer discharge itself. See Figure 2 for a simplified drawing of the circuit. In most cases, a repetition rate of 1 Hz is used.
In the images presented in this work, the original brightness is indicated by the multiplication factor MF as in Nijdam et al. (2010). This value is a measure of the gain of the complete system, it includes lens aperture, ICCD gain voltage and maximum pixel count used in the false-colour images. An image with a high MF value, is in reality much dimmer than an image with similar colouring, but with a lower MF value. We have normalized the MF values in such a way that the brightest image presented here has an MF value of 1.
More information about the circuit, discharge vessel, experiment timing, imaging system and measurement techniques can be found in Briels et al. (2008b, a); Nijdam et al. (2009).
2.2 Overall structure of the discharge
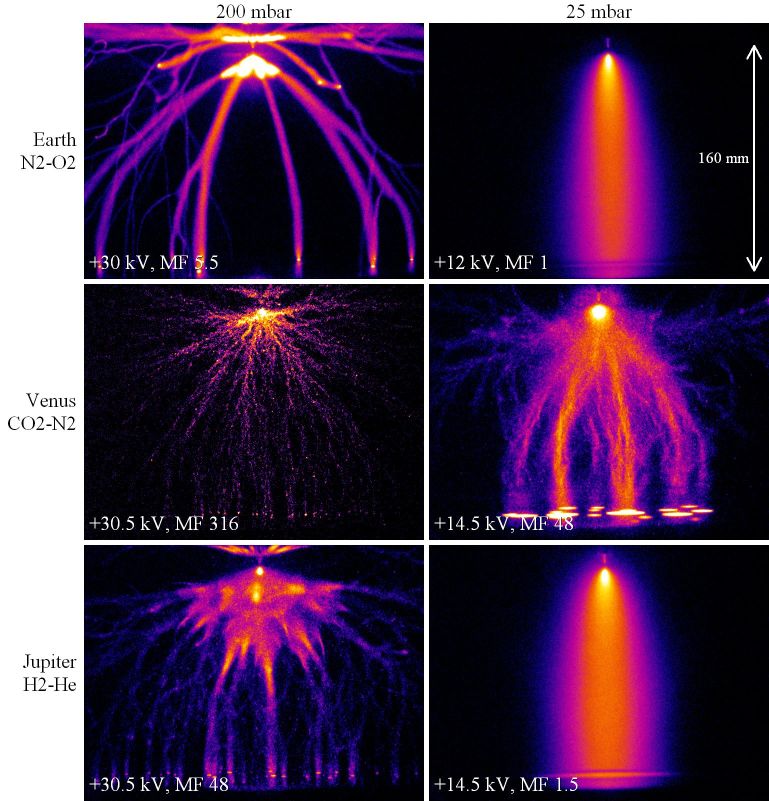
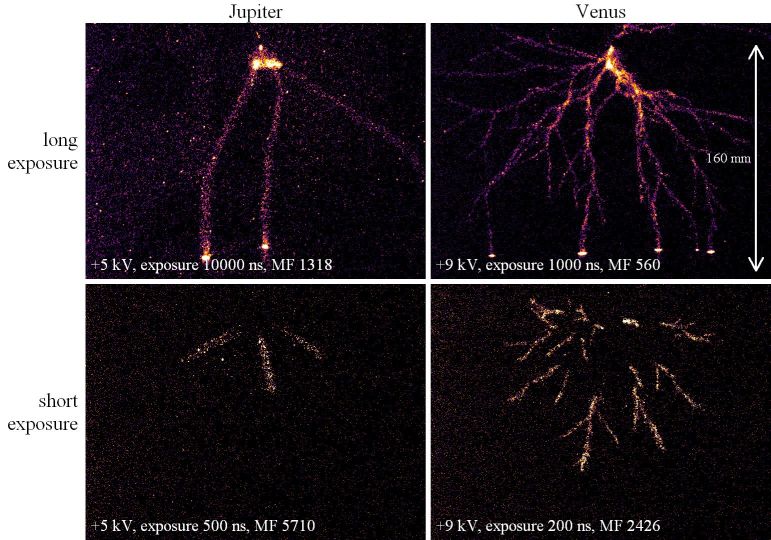
We were able to observe streamers in both gas mixtures. We show examples of the streamers we observed in Figure 3. The voltages in this figure are well above the inception voltage, the minimal applied voltage that is required to create a streamer. Examples of streamers close to the inception voltages are shown in Figures 4 and 5. The images clearly illustrate the fact that a higher voltage is required to create a discharge when the pressure is increased. Increasing voltage, or decreasing pressure causes the discharge to be brighter and less filamentary. When planetary mixtures are compared, we notice that the initiation of streamers in both our gasses requires higher voltages than in dry air at the same pressure. In the venusian mixture streamers are particularly difficult to create. For example, at 800 mbar a minimal voltage of approximately 20 kV is required to initiate a streamer discharge. At this voltage the streamer dies out before it bridges the gap. At the same pressure, streamers in the jovian mixture are created at lower voltages below15 kV. These streamers do not cross the gap either. Likewise, streamers at 1 bar in dry air can form when the applied voltage is as low as 10 kV, as was shown by Briels et al. (2008b) in a similar set-up.
Only the streamer’s head produces light. Therefore an image taken with a long exposure shows the trace left by the streamer head as it passes. With a shorter exposure just a section of the streamer’s path is seen (see Figure 5). At lower pressures, or higher voltages, the streamers develop into glow after reaching the plate electrode, resulting in a more or less uniform light that is emitted from the entire channel. This is seen in the right column of Figure 3. The glow phase lasts longer than the streamer phase, and emits significantly more light. Both in dry-air and in the jovian mixture, H2-He, a single wide channel is formed when the pressure is below 50 mbar. In the venusian mixture, CO2-N2, the filamentary streamer structure persists at the lowest pressures. Several channels conduct most of the current in the glow phase, as indicated by their strong intensity in the images. The light emission is usually too weak to be observed by the naked eye, except at the lowest pressures, below 100 mbar. In the venusian mixture the streamers tend to be bluish-green in color, and in the jovian mixture they seem to be pink.
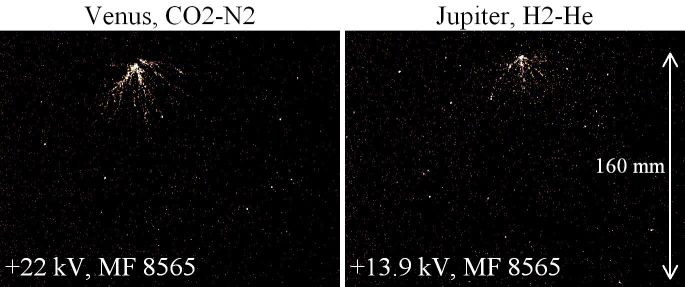
The images in Figure 3 are long exposure images taken at voltages that are relatively high when compared to the minimal inception voltages at the corresponding pressures. Under such conditions the streamers bridge the gap and conduct enough current to create the glow phase. When voltage is set as close as possible to the inception voltage value, the glow phase does not appear. An example is shown in Figure 5, where the top row is a full exposure image, that shows the streamer channels, and no indication of a glow phase. Note the different applied voltages, indicated at the bottom of each image, in the venusian the inception voltage is higher than in the jovian mixture. This difference persists in other pressures as well. We note that the jovian streamers have much less branches than the venusian streamers, under very similar conditions. Together with the high inception voltages required, this may be an indication of lower ionization rates in the venusian gas mixture. Apparently, streamer heads are less stable in this mixture, which causes them to branch more often. In the top right image of Figure 5 we observe many branches that stop in the middle of the gap, never reaching the other side. There are much less such branches in air and in the H2-He mixture. Looking closely at the streamer channels one sees that in the venusian mixture they are much more jagged than in the other gasses, and are almost never straight. More images of streamers in air are available in e.g Briels et al. (2008b) and Nijdam et al. (2010).
The morphological differences between the streamers in the two mixtures are probably due to two properties of the gasses, their atomic or molecular structure, and the photoionization mechanism. We here recall the basic mechanisms, that will have to be elaborated further in future work. A noble gas like He or Ar consists of single atoms, N2 and H2 are molecular gasses consisting of two atoms, and CO2 consists of three atoms. The molecular gasses, and in particular CO2, have many rotational and vibrational states at low energies that can absorb the energy of colliding electrons; therefore the electrons experience more friction than in noble gasses. Furthermore, He and H2 have only two electrons each which results in only few electronic excitation states. For this reason, streamer propagation is much easier in jovian than in venusian or terrestrial atmospheres. Positive streamers as investigated here move approximately with the electron drift velocity, but against the direction of electron drift; therefore they depend on a source of free electrons ahead of the ionization front. These free electrons can be supplied either by a nonlocal photoionization effect or by background ionization. Researchers currently generally agree that photoionization is the dominant effect in nitrogen-oxygen mixtures like terrestrial air (see Zheleznyak et al. (1982); Liu and Pasko (2004); Pancheshnyi (2005); Ebert et al. (2006) and references therein), though Pancheshnyi (2005) argues that high repetition frequencies can shift the balance towards background ionization as well. However, in any other gas the propagation mechanism of positive streamers is not really understood. In pure oxygen or nitrogen or argon, it is presently under investigation experimentally by Nijdam et al. (2010) and theoretically by Wormeester (manuscript in preparation). These investigations suggest that photoionization is able to stabilize wide streamer heads while positive streamers propagating due to background ionization are less straight and branch easier. These considerations may influence both the streamer head velocity and diameter, as well as other factors, as shown by the results described in section 3. Our preliminary investigations on the photoionization mechanism in venusian or jovian atmospheres below support this scenario.
Teich (1967) and later Zheleznyak et al. (1982) attribute the photoionization process in nitrogen-oxygen mixtures to several nitrogen emission lines in the wavelength range 98-102.5 nm. These photons are energetic enough to ionize oxygen molecules at 12 eV. This photoionization takes place after some travel distance that depends on the oxygen concentration; thus it is a nonlocal process. On Venus, CO2 requires a higher ionization energy of 13 eV, however the nitrogen molecule does not have emission lines that are energetic enough to ionize this molecule in a one-step process. Therefore other, less effective processes must account for the streamer propagation in the venusian mixture. With the low photoionization efficiency in the streamer head, it becomes less stable and more likely to branch. The picture in the jovian H2-He mixture is completely different. There is a large gap between the ionization energies of the hydrogen molecule and helium. A photon with a wavelength below 77.5 nm is energetic enough to ionize the hydrogen molecule at 16 eV. The helium atomic spectrum has a group of lines in the range 50.7-58.4 nm that can produce photons with enough energy to ionize the hydrogen molecule in a one step process. Assuming that the photoionization process is effective in the H2-He mixture, one is not surprised to find that the streamer heads are as stable as they are. Ionization and atomic spectral data in this paragraph are taken from the NIST database (Ralchenko et al. (2008) and Linstrom and Mallard (2009)).
The optical brightness of the streamers in both gasses is considerably weaker than in the gasses used in previous experiments (ambient air, nitrogen–oxygen mixtures and argon). Our setup is not calibrated to estimate absolute optical brightness, however a rough estimation of the relative intensity of planetary streamers to streamers in air is possible. The pixel gray level in an image is proportional to the light intensity and depends on the camera settings We can estimate the ratios between average intensities per area in different gasses, with the following method: we record short exposure images using the same equipment and under the same pressure and voltage conditions. We evaluate the averaged gray level per area of the streamer sections in these images. Our estimation shows that the optical brightness of both Jovian and Venusian streamers appears to be about a 100 times weaker than of streamers in air at similar pressures. A similar method is used to estimate the brightness of terrestrial sprites Yaniv et al. (2009) Averaged intensity per area depends on pressure, at lower pressures streamer images are brighter in all mixtures. These findings depend on equipment choice, since they are measured with the specific wavelength sensitivity curve of our equipment. So a very bright line at the edges or outside of this curve is not observed, but could be observed when other equipment is used.
3 Measuring Diameter And Velocity
3.1 Method
We test the similarity laws discussed in section 1.3 by determining the diameter and the velocity of the minimal streamers in planetary mixtures. In search for the minimal streamer diameter and velocity, we use images taken as close as possible to the inception voltage, the minimal voltage that is required to create a discharge (see Briels et al. (2006) for details). We determine this minimal voltage by gradually sweeping up the applied voltage, until streamers begin to appear in the discharge gap. At first streamers appear sporadically once every few pulses. These discharges are very difficult to image. For this reason we often apply a voltage that is slightly higher than the minimal inception voltage, where the discharge appears quite regularly. We note that The discharges are not absolutely independent. If a pulse triggers a discharge, the chances that the next pulse will trigger a discharge as well are increased. This suggests that some residue ionization is left in the gas for at least one second after the discharge. The discharge itself lasts several hundreds nano-seconds.
The streamer diameter is determined from the recorded images with the method described by Briels et al. (2008b): One to five of the thinnest streamers are chosen in each image. In choosing the streamer sections we keep in mind that not all the streamers in a given image are in focus. Those streamers that are not, will appear to be wider than those that are in focus, and will not be selected for diameter determination. Several perpendicular cross sections of each of the chosen streamers are taken. These cross sections are averaged so that they form one single cross section per streamer. The diameter of the streamer is determined as the full width at half maximum (FWHM) of the averaged cross section. The diameters of all the chosen streamers are then averaged. We remark that the streamer images in the planetary gasses have a relatively low signal to noise ratio. This makes the determination of FWHM of a single cross section almost impossible. Averaging over many cross sections, and the extraction of the FWHM of the averaged line, gives quite good results.
We use the following method to measure velocity, as described by Briels et al. (2008b) :We take short exposure images of streamers while they propagate in the middle of the gap, far away from both electrodes, where the effect of the electrodes on the field is minimal. The image shows the path that the streamer heads have crossed within the exposure time, hence their velocity can be determined by dividing the length of the streamer by the exposure time. We choose the longest straight streamer sections in each image, which do not branch. These streamers are most likely to have propagated more or less in the image plane, with approximately constant velocity.
3.2 Results
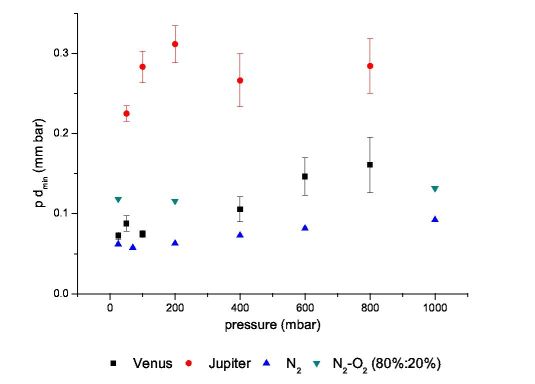
Figure 6 shows the reduced minimal diameter, , as function of pressure in the two gas mixtures. Here is the pressure and is the measured minimal diameter. We can use pressure instead of density because the gas temperature is the same in all experiments, namely room temperature. As expected, the reduced minimal diameter depends very weakly on pressure. In the jovian mixture mmbar and in the venusian mixture mmbar. These values are of the same scale as values measured by Briels et al. (2008a) in air and nitrogen and by Nijdam et al. (2010) in argon and in oxygen–nitrogen mixtures of varying concentration. The average reduced diameter reported by Nijdam et al. in dry air is mmbar. Some of the values reported in that work are shown in Figure 6.
We can summarize that the values of of the streamer head in the CO2-N2 mixture, in air and in pure nitrogen are quite similar. In the H2-He mixture the value of is twice as large. In section 2.2 we discuss some possible reasons for such a difference. It is likely that the jovian mixture is ionized more easily than the mixtures that represent Venus and Earth, as well as pure nitrogen, creating wider and possibly faster streamers.
We made preliminary measurements to estimate the minimal streamer velocity. We recall that theoretically the streamer velocities do not depend on density when similarity laws apply, as discussed by Briels et al. (2008a). In all the pressures, in both mixtures, the measured minimal velocity is of order of m/s. Our best estimation in the venusian mixture is m/sec in 800 mbar, and in the jovian mixture it is m/sec in 50 mbar. Briels et al. (2008a) and Nijdam et al. (2010) report similar values in other gas mixtures, such as air. Velocities of to m/sec were measured in sprite tendrils by means of high temporal resolution observations of terrestrial sprites (Moudry et al. (2002); McHarg et al. (2007); Stenbaek-Nielsen et al. (2007)).
Measurements by Briels et al. (2008b) in air demonstrated that the velocity depends more strongly on the applied voltage, than the diameter and above the inception voltage the velocity has a quite large statistical error. We were not able to measure the minimal velocity in all the pressures, however the lowest values we measured had the narrowest distribution. This is a clear indication that the applied voltage was above the inception voltage.
According to Yair et al. (2009), sprites are expected on Venus at altitudes between 80 and 90 km above the surface, and on Jupiter at 300 km above the 1 bar level. At these altitudes the pressure is 5 to 0.4 mbar on Venus, and of the order of mbar on Jupiter. The streamer minimal diameter at such pressures according to our measurements are expected to be 0.2-0.02 m, and 300 m respectively. The sprite tendrils may in fact be quite wider, as they do not need to be minimal. For example, based on the value of measured by Briels et al. (2008a) in air, minimal sprite tendrils on Earth should be roughly 20 m wide. However observations report tendrils as wide as 150 m (Gerken and Inan (2003)).
4 Spectral Measurements
4.1 Method
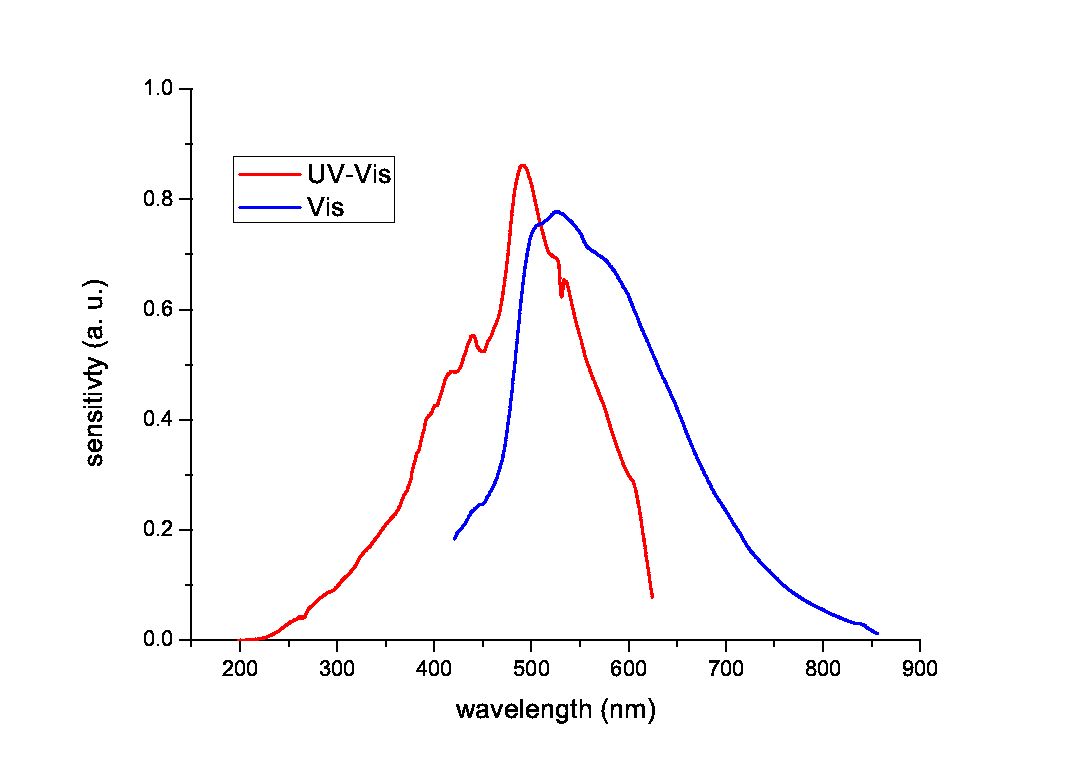
We used two small spectrometers to determine the spectra emitted by the various discharges under investigation. These spectrometers are sensitive in different wavelength regions: an Ocean Optics HR2000 is sensitive between 177 and 622 nm and an Ocean Optics HR2000+ is sensitive between 420 and 820 nm. In the following, we refer to the spectra of these devices as UV-Vis and Vis respectively. The corresponding sensitivity curves are shown in Figure 7. An optical fibre is used to get the light into the spectrometer. The acceptance angle of this fibre is enough to capture light from the entire discharge region, when placed behind the large quartz window (See Figure 1). This includes the electrodes. We believe that their radiation contribution to the spectrum is minor. In these discharges the electrodes hardly heat up, and therefore do not emit planck radiation. The discharge around the electrodes should not be that much different from the bulk. In most cases, the end of the optical fibre was placed perpendicular to the large quartz window, in full view of the discharge region, but outside the ITO window of the Faraday cage. However, in some cases, it was placed within the Faraday cage, parallel to the large quartz window. In these latter cases, a mirror was used to direct the light from the discharge to the fibre. This is needed to measure at wavelengths below 300 nm, which are absorbed by the ITO window. The construction with the mirror was necessary because of the small space between the ITO and the quartz windows. In order to get enough radiation from the discharge to produce a spectrum with an acceptable signal to noise ratio, we needed to use long measurement times, up to 100 minutes, and a high discharge repetition rate of 10 Hz. When the higher repetition rate of 10 Hz is used, we do not use the equipment responsible for constantly renewing the gas in the vessel, due to technical difficulties. It is possible that meta-stable molecules form in the gas and influence the measured spectrum. The measurements shown here are averaged curves of 10 intervals of 60 sec integration time each.
Because of the very low intensity of the streamers in the two gasses, we had to use low pressures and high voltages. The discharges we investigate look like those shown in the right column of Figure 3. Most of the light emission in these discharges comes from the glow phase, which is longer in duration and more intense. Nijdam et al. (http://arxiv.org/abs/0912.0894v1, version 1) show that the spectra of streamers and of pulsed glow in pure nitrogen are practically indistinguishable. We assume it is true for the planetary gasses as well. Nonetheless, one should remember that the spectra discussed in this section are basically those of a pulsed glow discharge that lasts a few micro-seconds.
Two spectra, using both spectrometers, were measured in each gas mixture. The spectra presented in this paper are corrected for the sensitivity of the spectrometers. The intensity scale is equal between the different spectra and spectrometers. Therefore, intensities can be compared between different spectra and wavelengths. However, we have no absolute intensity calibration. We normalise the spectra with the strongest lines in the venusian spectra, and with the Balmer line in the jovian spectrum. In the measured spectra we have excluded some pixels that showed excessive noise levels in the calibration measurements. When more than two neighbouring pixels are excluded, this section of the spectrum is removed from the spectrum. In other cases the excluded pixels are represented by the average of their neighbours. In total about 75 points per spectrometer have been excluded.
In this section we report our observations on the streamer and glow discharge spectra in the two planetary gasses, and the spark spectrum in the mixture that corresponds to Venus. For spectral identification we use the tables of molecular spectra by Pearse and Gaydon (1976), and the NIST database for atomic spectral lines (Ralchenko et al. (2008)).
4.2 Spectrum for sprites on Jupiter
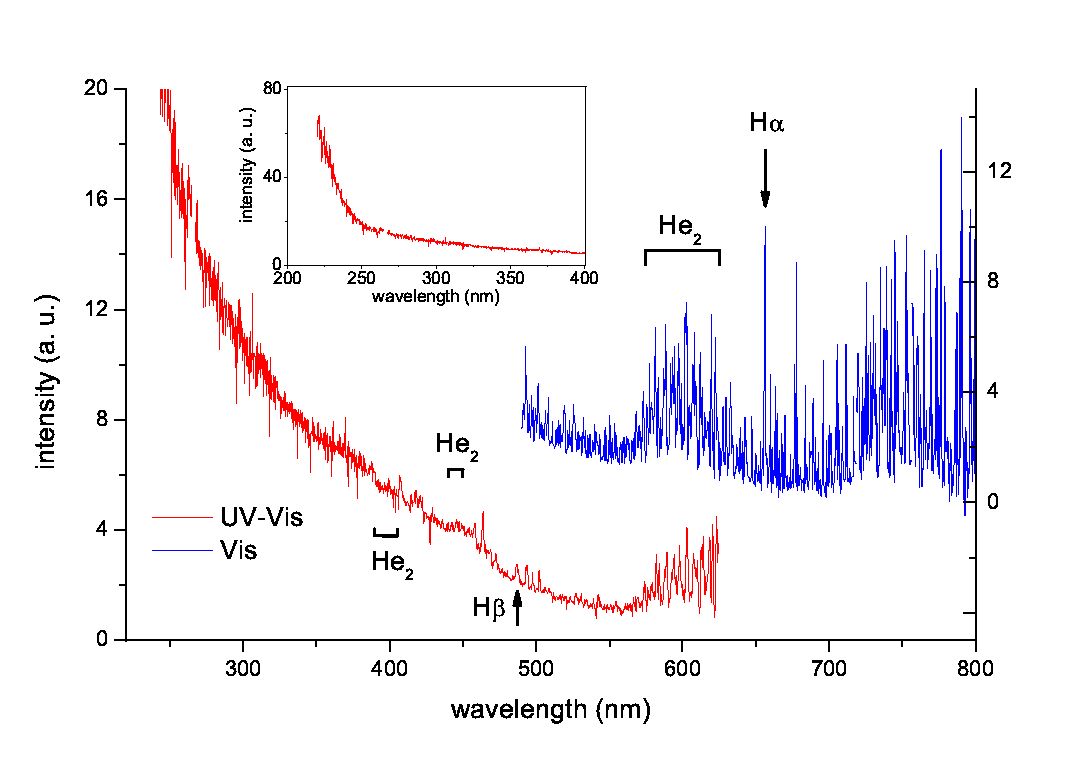
Figure 8 shows the spectrum obtained in the mixture that simulates Jupiter’s atmosphere, at a pressure of 50 mbar and a voltage peak of 25 kV. These measurements were taken with the optic fiber placed between the discharge vessel window and the ITO glass, so radiation below 300 nm was recorded.
The dominant feature of this spectrum is the continuum in the UV-Vis range, with a higher intensity at the lower wavelengths. It is similar in form to the UV continuum emission in H2 reported by Lavrov et al. (1999), and references therein. Continuum in H2-containing mixtures is created in transition from electronically-excited state of H2 to the unstable state , which auto-dissociates instantaneously with a photon emission, i.e. H + H + photon (Sergey Pancheshnyi in personal communication). In addition to this continuum, there are many spectral lines. We focus here on the most distinctive features of the spectrum. The strong and narrow line at 656 nm, is the H line. The second line of the Balmer series, much less intense, is present as well. There are two regions of particularly strong and dense lines, one at the wavelength range of 575-625 nm and another at 700-800 nm. The 575-625 nm band probably belongs to the He2 molecular spectrum. The He2 spectrum has two other such regions at wavelengths below 500 nm (marked in the Figure). These bands are not apparent in our spectrum. The 700-800 nm band, we are currently unable to identify. A possible candidate is the hydrogen molecule, which has a very complex and dense spectrum in the visible range. However while many of the peaks of the H2 spectrum lines coincide with peaks in Figure 8, many others seem to be absent or otherwise they are too weak and difficult to identify, particularly in the 500-550nm range. A higher resolution measurement is required to allow for un-ambiguous identification.
4.3 Spectrum for sprites on Venus
Figure (9) shows the spectrum obtained in the mixture that simulates the venusian atmosphere, at a pressure of 50 mbar and applied voltage of 43 kV. The optic fiber is placed behind the ITO window, so no spectral lines can be observed below the wavelength of 300 nm.
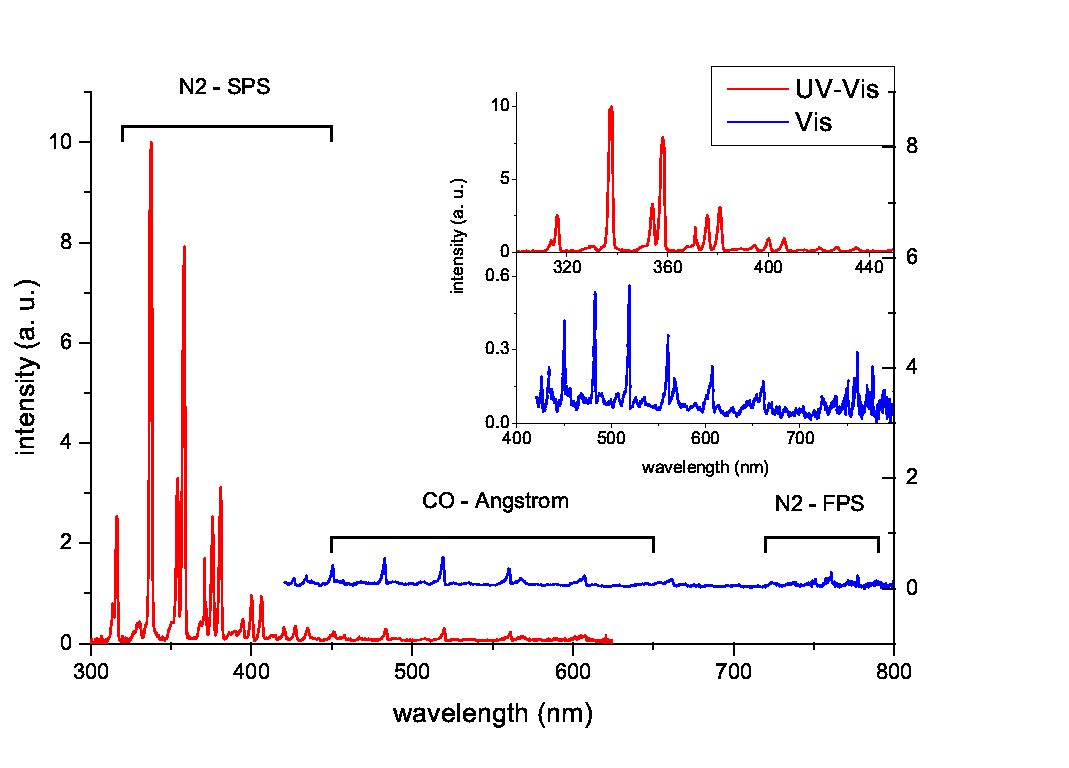
The most dominant feature of this spectrum is the N2 second positive band of triple heads in the range 300 to 450 nm (N2-SPS). The strongest lines of this system are found at 316, 337, 354, 358, 376 and 381 nm. All the lines have widths of 2 nm. The CO Ångstrom system is clearly visible in the Vis spectrum, with lines at 451 nm, 483 nm, 519 nm, 561 nm, 607 nm and 662 nm, all degraded to the violet. This system is considerably weaker that the N2-SPS band. The line at 567 nm is possibly one of the triplets of the CO triplet system. Other triplets of this system might be present as well, but many of them are very close to CO Ångstrom lines, making it difficult to identify them (such as the wide line at 600-607 nm), others are too weak to be un-equivocally identified. Several very weak heads of the N2 first positive band (N2-FPS), are found at the upper edge of the spectrum, at the wavelength range 725-790 nm.
It is somewhat surprising that we observe primarily nitrogen lines in this spectrum. Previous work by Goto and Ohba (unpublished report 2008) in hot plasma, found a significant CO2 signature in the spectrum, while Borucki et al. (1996) found mainly atomic oxygen and carbon lines. However, according to the literature (Pearse and Gaydon (1976)) even a very small amount of nitrogen mixed into a gas can produces strong N2 lines in some circumstances, and these nitrogen lines can be considerably stronger than any other feature of the spectrum. This seems to be the case with the streamer spectrum in the venusian atmosphere examined here. This is an indication that pure CO2 may not the best choice when one wishes to simulate such discharges in the venusian atmosphere, and nitrogen must be taken into account. The hot plasma spectrum is discussed in more detail in the following section.
4.4 Spectrum for lightning on Venus
By a simple modification, the system described in section 2.1 can create sparks in the discharge gap. The resistor R3 in Figure 2, through which most of the current during a voltage pulse, is replaced by a resistor with a higher resistance (a 1 k resistor is replaced by a 6 M resistor). The original resistor is chosen in such away that most of the current flows through the R3 branch of the circuit, rather than through the discharge gap, therefore the high voltage on the discharge gap falls very rapidly, within several micro-seconds. With the stronger resistor in place, the high voltage on the electrodes persists for a time long enough for a spark discharge to occur, if the gas in the vessel is dense enough. The spark discharge is akin to lightning on a small scale.
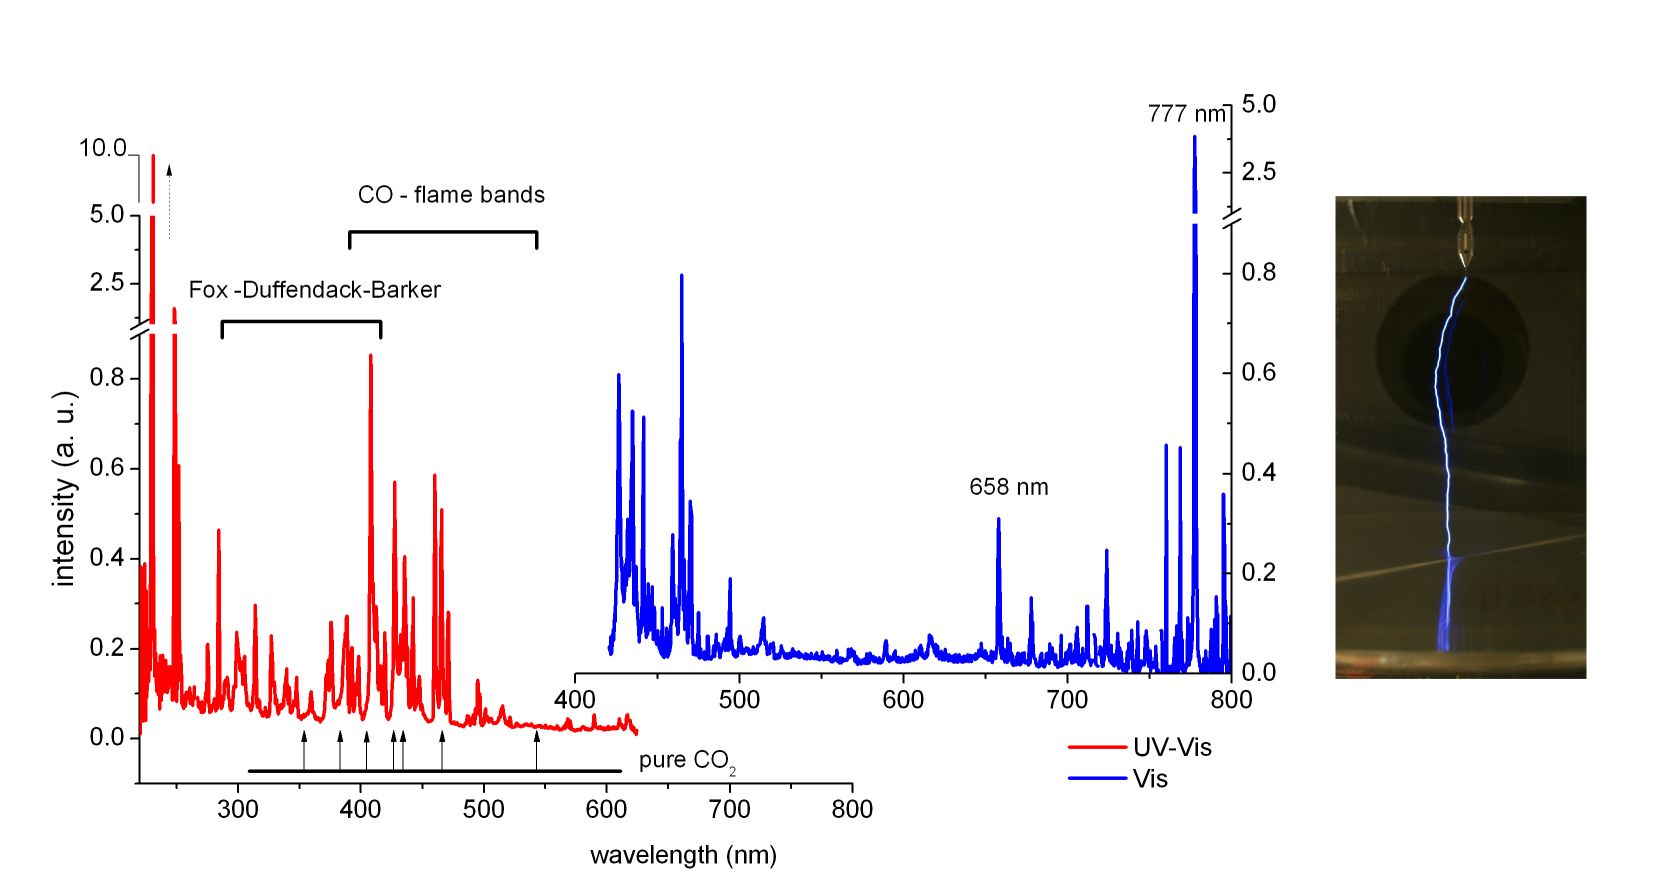
We used this setting to create sparks in the mixture that represents Venus’s atmosphere, CO2-N2, and recorded its spectrum using the equipment and methods described above. The optic fiber was placed between the vessel quartz window and the ITO window, so wavelengths shorter than 300 nm were observed. The pressure in the vessel was 200 mbar, and a voltage of 50 kV was used. The sparks created in this way are significantly brighter than the cold plasma discharges discussed above. As a result we could measure the spectrum with considerable shorter exposure times; 10 seconds for the UV-Vis range, and 30 seconds for the Vis range were used. The curves shown in Figure 10, are the averaged result of 10 measurements.
When one compares the spectra in figures 9 and 10, the difference is apparent. The strongest lines of the cold plasma spectrum are concentrated in the wavelength range 300-400 nm, and these are nitrogen lines. There are no CO2 lines, and the CO lines are very weak. The spark spectrum, on the other hand, has a concentration of lines between 400 and 500 nm, and several strong and narrow lines; the atomic oxygen line at 777 nm, and two lines in the UV, 230 nm and 250 nm, that probably belong to the CO+ first negative system. Many of the other lines in this spectrum correspond with the carbon monoxide flame bands (), which are in fact CO2 emissions, and also with the Fox-Duffendack and Barker’s system (), which are CO emissions.
Goto and Ohba (unpublished report 2008) performed measurements of the hot plasma spectrum in pure CO2 at several pressures. Their results are similar to the spark spectrum shown here. They identified several wide CO2 lines. The spectrum in Figure 10 has a higher resolution, and therefore many more lines are observed. These lines are grouped into several bands that agree well with the wide lines of the 100 Torr (133 mbar) spectrum measured by Goto and Ohba, and which are indicated with arrows in the figure. These bands in our spectrum are located roughly at 375 nm, 390 nm, 415 nm, 440 nm and 470 nm, and all have widths between 10 and 20 nm. We also observe a strong oxygen line at 777 nm which was also reported by Goto and Ohba as well as by Borucki et al. (1996).
It is interesting to note in this respect, that 6 of the 7 flashes reported by Hansell et al. (1995) in their ground observation of Venus’s night-side were found using a 777.4 nm filter and one more flash was observed using a 656.3 nm filter. Our spectrum has a strong OI line at 777 nm, and a clear and narrow line at 658 nm.
5 Conclusions
We have observed streamers in a previously unexplored set of gasses in controlled laboratory settings. These gasses simulate the atmospheres of Venus and Jupiter-like planets. We have demonstrated that streamer discharges are possible in these gasses, which gives firmer ground to our hope of observing sprites on these planets. We have explored some features of these discharges, such as the inception voltages, the minimal diameter and velocity of the streamer heads and their intensity as compared to the optical brightness. of streamers in air. We find that the streamers in these new gasses follow scaling laws as expected. We demonstrate that the reduced minimal diameter, does not depend on pressure. We also find that the streamers in the different gasses are rather similar in their appearance, albeit differences in branching, intensity and the propagation path (straight in air and the jovian mixture but a little jagged in the venusian mixture). The reduced diameter in all the gasses is of the same order of magnitude. In the venusian mixture it is very close to the reduced diameter in air that was reported by Briels et al. (2008a) and by Nijdam et al. (2010), but it is twice as wide in Jupiter. Hence, the diameter is influenced by the composition of the gas. Some considerations on the physical origin of these differences, like electron friction and photoionization versus background ionization, are discussed in section 2.2. Based on our reduced minimal diameter measurements, and the sprite altitudes estimated by Yair et al. (2009), we predict that sprite tendrils on Jupiter will be at least 300 m wide, and of the order of a meter wide on Venus.
Most important in terms of the search for planetary sprites, is the fact that the streamers in both mixtures emit much less light than in air, and that they require higher inception voltages, particularly in the venusian mixture. Therefore, planetary sprites can be expected to have similar morphology to terrestrial sprites, but they might be significantly weaker in optical brightness and require a larger charge moment of the parent lightning. These considerations should be taken into account if a more detailed scheme for predicting sprite altitudes than the one proposed by Yair et al. (2009), is to be employed.
To maximize the chances of discovering planetary sprites by optical observations, one should focus on the specific spectral lines expected in these discharges. We have examined the optical spectra of streamers and glow in the two atmospheres, in the visual and the near UV range. In the venusian atmosphere we find strong N2 lines from the second positive band, as well as considerably weaker CO lines. We find that this spectrum is significantly different from the hot plasma spectrum found by Borucki et al. (1996) in a similar gas mixture, being populated by many more spectral lines. It is also significantly different from the spectrum measured by Goto and Ohba (unpublished report 2008) in pure CO2, and from our own measurements of the spark spectrum in the N2-CO2 mixture. We find that in the case of a cold plasma discharge the presence of nitrogen in the atmospheric gas is important and should not be neglected. In case of a hot plasma discharge, a spark, CO2 and CO lines are dominant. Among the strongest lines in our spark spectrum, it is worth mentioning the lines at 777 nm and 658 nm. These lines are close to the wavelengths proposed by Hansell et al. (1995) for lightning observations on Venus. We observe also two very strong lines at 230 nm and 250 nm, which may be useful as well. However, these two lines are at the edge of our spectrum, where the apparatus sensitivity is low. It is worthwhile to look more closely at this wavelength.
In Jupiter’s atmosphere the spectrum is more complex, consisting both of continuum radiation and very dense spectral lines. The Balmer alpha line, is a common feature of spectra of gasses that contain hydrogen, and can not be considered a characteristic of the cold plasma process spectrum. For example, Borucki et al. (1996) find this line as the strongest feature of the hot plasma spectrum in a similar gas mixture. On the other hand, we see a dominant continuum spectrum, which is not found in Borucki’s work. Moreover, there are several regions of dense band structure, which are characteristic both of Helium molecular and atomic spectra, and of the hydrogen molecular spectrum. Calibrated measurements of the jovian spectrum, may yield information on the electron density and energies in these discharges. Further investigation of the jovian and dry-air spectra is under investigation and some of the results are about to be published by Nijdam et al. (http://arxiv.org/abs/0912.0894v1, version 1).
This research is supported by the Israeli Science Foundation grant 117/09. Support for experiments conducted by the first author was received from COST Action P-18, “Physics of Lightning Flash and its Effects” as part of a Short Term Scientific Mission (STSM). SN acknowledges support by STW-project 06501, part of the Netherlands’ Organization for Scientific Research NWO.
References
- Baines et al. [2007] Baines, K. H., A. A. Simon-Miller, G. S. Orton, et al. (2007) et al., Polar lightning and decadal-scale cloud variability on Jupiter, Science, 318(5848), 226, doi:10.1126/science.1147912.
- Borucki and Magalhaes [1992] Borucki, W. J., and J. A. Magalhaes (1992), Analysis of Voyager 2 images of jovian lightning, Icarus, 96(1), 1, doi:10.1016/0019-1035(92)90002-O.
- Borucki et al. [1996] Borucki, W. J., C. P. McKay, D. Jebens, H. S. Lakkaraju, and C. T. Vanajakshi (1996), Spectral irradiance measurements of simulated lightning in planetary atmospheres, Icarus, 123(2), 336, doi:10.1006/icar.1996.0162.
- Briels [2007] Briels, T. M. P. (2007), Exploring streamer variability in experiments, Ph.D. thesis, Technische Universiteit Eindhoven, Eindhoven, Netherlands.
- Briels et al. [2006] Briels, T. M. P., J. Kos, E. M. van Veldhuizen, and U. Ebert (2006), Circuit dependence of the diameter of pulsed positive streamers in air, Journal of Physics D: Applied Physics, 39, 5201, doi:10.1088/0022-3727/39/24/016.
- Briels et al. [2008a] Briels, T. M. P., E. M. van Veldhuizen, and U. Ebert (2008a), Positive streamers in air and nitrogen of varying density: experiments on similarity laws, Journal of Physics D: Applied Physics, 41, 234008, doi: 10.1088/0022-3727/41/23/234008.
- Briels et al. [2008b] Briels, T. M. P., J. Kos, G. J. J. Winands, E. M. van Veldhuizen, and U. Ebert (2008b), Positive and negative streamers in ambient air: measuring diameter, velocity and dissipated energy, Journal of Physics D: Applied Physics, 41, 234004, doi: 10.1088/0022-3727/41/23/234004
- Cummer et al. [2006] Cummer, S. A., N. Jaugey, J. Li, W. A. Lyons, T. E. Nelson, and E. A. Gerken (2006), Submillisecond imaging of sprite development and structure., Geophys. Res. Lett., 33, 4104.
- Desch et al. [2002] Desch, S. J., W. J. Borucki, C. T. Russell, and A. Bar-Nun (2002), Progress in planetary lightning, Rep. Prog. Phys., 65, 955.
- Ebert et al. [2006] Ebert, U., C. Montijn, T. Briels, W. Hundsdorfer, B. Meulenbroek, A. Rocco, and E. M. van Veldhuizen (2006), The multiscale nature of streamers, Plasma Sources Science and Technology, 15, S118–S129.
- Ebert et al. [2009] Ebert, U. et al. (2009), Recent results on streamer discharges and their relevance for sprites, J. Geophys. Res., submitted to the same special issue as the present manuscript.
- Gerken and Inan [2003] Gerken, E., and U. Inan (2003), Observations of decameter-scale morphologies in sprites, Journal of Atmospheric and Solar-Terrestrial Physics, 65, 567.
- Gerken et al. [2000] Gerken, E., U. Inan, and C. P. Barrington-Leigh (2000), Telescopic imaging of sprites, Geophys. Res. Lett., 27, 2637.
- Goto et al. [2007] Goto, Y., Y. Ohba, and K. Narita (2007), Optical and spectral characteristics of low pressure air discharges as sprite models., J. Atmos. Elec., 27, 105–112.
- Gurnett et al. [1991] Gurnett, D. A., W. S. Kurth, A. Roux, R. Gendrin, C. F. Kennel, and J. F. Bolton (1991), Lightning and plasma wave observations from the Galileo flyby of Venus., Science, 253, 1522–1525.
- Gurnett et al. [2001] Gurnett, D. A., P. Zarka, R. Manning, W. S. Kurth, G. B. Hospodarsky, T. F. Averkamp, M. L. Kaiser, and W. M. Farrell (2001), Non-detection at Venus of high-frequency radio signals characteristic of terrestrial lightning, Nature, 409, 313.
- Hampton et al. [1996] Hampton, D. L.,M. J. Heavner, E. M. Wescott, D. D. Sentman (1996), Optical spectral characteristics of sprites, Geophys. Res. Lett., 23, 89.
- Hansell et al. [1995] Hansell, S. A., W. K. Wells, and D. M. Hunten (1996), Optical detection of lightning on Venus, Geophys. Res. Lett., 23, 89.
- Hu et al. [2002] Hu, W., S. A. Cummer, W. A. Lyons, and T. E. Nelson (2002), Lightning charge moment changes for the initiation of sprites., Geophys. Res. Lett., 29, 1279.
- Hu et al. [2007] Hu, W., S. A. Cummer, and W. A. Lyons (2007), Testing sprite initiation theory using lightning measurements and modeled electromagnetic fields., J. Geophys. Res., 112, 13115.
- Krasnopolsky [2006] Krasnopolsky, V. A. (2006), A sensitive search for nitric oxide in the lower atmospheres of Venus and Mars: detection on Venus and upper limit for Mars., Icarus, 182, 80.
- Ksanfomality [1980] Ksanfomality, L. V. (1980), Venera 9 and 10: thermal radiometry., Icarus, 41, 36.
- Lavrov et al. [1999] Lavrov, Z. P., A. S. Melnikov, M. Kaening, and J. Roepke (1999), UV conntinuum emission and diagnostics of hydrogen-containing nonequilibrium plasmas., Phys. Rev. E, 59, 3526.
- Levin et al. [1983] Levin, Z., W. B. Borucki, and O. B. Toon (1983), Lightning generation in planetary atmospheres., Icarus, 56, 80.
- Linstrom and Mallard [2009] Linstrom, P.J. and W.G. Mallard (2009), Chemistry WebBook, NIST Standard Reference Database Number 69, National Institute of Standards and Technology, Gaithersburg MD, 20899, http://webbook.nist.gov, (retrieved August, 2009).
- Liu and Pasko [2004] Liu, N., and V. P. Pasko (2004), Effects of photoionization on propagation and branching of positive and negative streamers in sprites, Journal of Geophys. Res., 109, A04301.
- Luque and Ebert [2009] Luque, A., and U. Ebert (2009), Emergence of sprite streamers from relaxation-ionization waves in the lower ionosphere, Nature Geosciences, 2, 757.
- Luque et al. [2007] Luque, A., U. Ebert, C. Montijn, and W. Hundsdorfer (2007), Photoionization in negative streamers: Fast computations and two propagation modes, Applied Physics Letters, 90(8), 081501, doi:10.1063/1.2435934.
- Luque et al. [2008] Luque, A., U. Ebert, and W. Hundsdorfer (2008), Interaction of streamers in air and other oxygen-nitrogen mixtures, Phys. Rev. Lett., 101, 075005.
- Marshall and Inan [2006] Marshall, R., and U. Inana (2006), High-speed measurements of small-scale features in sprites: Sizes and lifetimes, Radio Sci., 41, RS6S43, doi:10.1029/2005RS003353.
- McHarg et al. [2007] McHarg, M. G., H. C. Stenbaek-Nielsen, and T. Kammae (2007), Observations of streamer formation in sprites, Geophys. Res. Lett., 34, L06804.
- Mende et al. [1995] Mende, S. B., R. L. Rairden, G. R. Swenson, and W. A. Lyons (1995), Sprite spectra: N2 1 PG band identification, Geophys. Res. Lett., 22, 2633.
- Moudry et al. [2002] Moudry, D. R., H. C. Stenbaek-Nielsen, D. D. Sentman, and E. M. Wescott (2002), Velocities of sprite tendrils, Geophys. Res. Lett., 29, 1992.
- Nakamura et al. [2007] Nakamura, M., et al. (2007), Planet-C: Venus climate orbiter mission of Japan, Planetary and Space Science, 55(12), the Planet Venus and the Venus Express Mission, Part 2, Pages 1831-1842, doi:10.1016/j.pss.2007.01.009.
- Nijdam et al. [2009] Nijdam, S., C. G. C. Geurts, E. M. van Veldhuizen, and U. Ebert (2009), Reconnection and merging of positive streamers in air, Journal of Physics D: Applied Physics, 42(4), 045201.
- Nijdam et al. [2010] Nijdam, S., F. M. J. H van de Wetering, R. Blanc, E. M. van Veldhuizen, and U. Ebert (2010), Probing photo-ionization: Experiments on positive streamers in pure gasses and mixtures, accepted for publication in J. Phys. D: Applied Physics. http://arxiv.org/abs/0912.0894
- Pancheshnyi [2005] Pancheshnyi, S. (2005), Role of electronegative gas admixtures in streamer start, propagation and branching phenomena, Plasma Sources Sci. Technol., 14, 645.
- Pasko et al. [1997] Pasko, V. P., U. S. Inan, and Y. N. Taranenko (1997), Sprites produced by quasi-electrostatic heating and ionization in the lower ionosphere., Journal of Geophys. Res., 102, 4529.
- Pasko [2006] Pasko, V. (2006), Sprites, Elves and Intense Lightning Discharges, NATO Science Series II: Mathematics, Physics and Chemistry, vol. 225, chap. Theoretical modeling of sprites and jets, pp. 253, Springer Netherlands.
- Pasko [2007] Pasko, V. P. (2007), Red sprite discharges in the atmosphere at high altitude: the molecular physics and the similarity with laboratory discharges, Plasma Sources Sci. Technol., 16, S13.
- Pearse and Gaydon [1976] Pearse, R. W. B., and A. G. Gaydon (1976), The identification of molecular spectra, 4-th ed., Chapman & Hall Ltd, London.
- Raizer et al. [1998] Raizer, Y. P., G. M. Milikh, M. N. Shneider, and S. V. Novakovski (1998), Long streamers in the upper atmosphere above thundercloud., J. Phys. D., 31, 3255.
- Ralchenko et al. [2008] Ralchenko, Y., A. E. Kramida, J. Reader, and NIST ASD Team (2008), NIST atomic spectra database, Online version 3.1.5, National Institute of Standards and Technology, Gaithersburg, MD, http://physics.nist.gov/asd3 (retrieved August, 2009).
- Ruf et al. [2009] Ruf, C., N. O. Renno, J. F. Kok, E. Bandelier, M. J. Sander, S. Gross, L. Skjerve, and B. Cantor (2009), Emission of non-thermal microwave radiation by a Martian dust storm, Geophys. Res. Lett., 36, L13202, doi:10.1029/2009GL038715.
- Russell et al. [2007] Russell, C. T., T. L. Zhang, M. Delva, W. Magnes, R. J. Stangeway, and H. Y. Wei (2007), Lightning on Venus inferred from whistler-mode waves in the ionosphere., Nature, 450, 661.
- Sao Sabbas et al. [2003] Sao Sabbas, F. T., D. D. Sentman, E. M. Wescott, O. Pinto, O. Mendes, Jr., and M. J. Taylor (2003), Statistical analysis of space-time relationships between sprites and lightning, Journal of Atmospheric and Solar-Terrestrial Physics, 65, 525.
- Sentman et al. [1995] Sentman, D. D., E. M. Wescott, D. L. Osborne, D. L. Hampton, and M. J. Heavner (1995), Preliminary results from the Sprites94 aircraft campaign: 1. Red sprites, Geophys. Res. Lett., 22, 1205.
- Stenbaek-Nielsen et al. [2009] Stenbaek-Nielsen, H., R. Haaland, M. G. McHarg, B. A. Hensley, and T. Kanmae (2009), Sprite initiation altitude measured by triangulation, J. Geophys. Res. manuscript submitted to the same special issue of J. Geophys. Res. as the present manuscript.
- Stenbaek-Nielsen and McHarg [2008] Stenbaek-Nielsen, H. C., and M. G. McHarg (2008), High time-resolution sprite imaging: observations and implications, J. Phys. D: Appl. Phys., 41, 234009.
- Stenbaek-Nielsen et al. [2007] Stenbaek-Nielsen, H. C., M. G. McHarg, T. Kanmae, and D. D. Sentman (2007), Observed emission rates in sprite streamer heads, Geophys. Res. Lett., 34, L11105, doi:10.1029/2007GL029881.
- Takahashi et al. [2008] Takahashi Y., J. Yoshida, Y. Yair, T. Imamura and M. Nakamura (2008), Planetary Atmospheric Electricity, chap. Lightning Detection by LAC Onboard the Japanese Venus Climate Orbiter, Planet-C, p. 317, Springer New York.
- Teich [1967] Teich, T. H. (1967), Emission gasionisierender Strahlung aus Elektronenlawinen II. Messungen in O2-He-Gemischen, Dämpfen, CO2 und Luft; Datenzusammenstellung, Zeitschrift für Physik, 199(4), 395.
- Williams et al. [2006] Williams, E., M. Valente, E. Gerken, and R. Golka (2006), Sprites, Elves and Intense Lightning Discharges, NATO Science Series II: Mathematics, Physics and Chemistry, vol. 225, chap. Calibrated radiance measurements with an air-filled glow discharge tube: application to sprites in the mesosphere., pp. 237–247, Springer Netherlands.
- Wilson [1925] Wilson, C. T. R. (1925), The electric field of a thundercloud and some of its effects., Proc. Phys. Soc. London, 37, 32D.
- Yair et al. [1995] Yair, Y., Z. Levin, and S. Tzivion (1995), Lightning generation in a jovian thundercloud: Results from an axisymmetric numerical cloud model, Icarus, 115(2), 421, doi:10.1006/icar.1995.1108.
- Yair et al. [2008] Yair, Y., G. Fischer, F. Simoes, N. Renno, and P. Zarka (2008), Updated review of planetary atmospheric electricity, Space Sci. Rev., 137, 29.
- Yair et al. [2009] Yair, Y., Y. Takahashi, R. Yaniv, and Y. Ebert, U. end Goto (2009), A study of the possibility of sprites in the atmospheres of other planets, J. Geophys. Res. 114, E09002.
- Yaniv et al. [2009] Yaniv, R., A. D. Devir, Y. Yair, C. Price, B. Ziv and N. Reicher (2009), Calibration of CCD cameras for measurements of sprites and elves, Amer. Inst. of Phys. Conf. Proc., Vol. 1118, 92.
- Zheleznyak et al. [1982] Zheleznyak, M. B., A. K. Mnatsakanyan, and S. V. Sizykh (1982), Photoionization of nitrogen and oxygen mixtures by radiation from a gas discharge, High Temp., 20, 357.