Measuring individual overpotentials in an operating solid-oxide electrochemical cell
Farid El Gabaly,∗a Michael Grass,b Anthony H. McDaniel,a Roger L. Farrow,a Mark A. Linne,†a Zahid Hussain,b Hendrik Bluhm,c Zhi Liu,∗b and Kevin F. McCartya
Received Xth XXXXXXXXXX 20XX, Accepted Xth XXXXXXXXX 20XX
First published on the web Xth XXXXXXXXXX 200X
DOI: 10.1039/b000000x
We use photo-electrons as a non-contact probe to measure local electrical potentials in a solid-oxide electrochemical cell. We characterize the cell in operando at near-ambient pressure using spatially-resolved X-ray photoemission spectroscopy. The overpotentials at the interfaces between the Ni and Pt electrodes and the yttria-stabilized zirconia (YSZ) electrolyte are directly measured. The method is validated using electrochemical impedance spectroscopy. Using the overpotentials, which characterize the cell’s inefficiencies, we compare without ambiguity the electro-catalytic efficiencies of Ni and Pt, finding that on Ni H2O splitting proceeds more rapidly than H2 oxidation ,while on Pt, H2 oxidation proceeds more rapidly than H2O splitting.
1 Introduction
Electrochemical technologies offer very efficient (40%-95%) routes to convert and store energy while not introducing carbon-containing species into the atmosphere. Thus, it is widely anticipated that electrochemical technologies will be increasingly used to provide energy that does not contribute to climate change, i.e., carbon-neutral storage and conversion. Batteries, ultra-capacitors, fuel cells and electrolyzers are the most important1 electrochemical devices used to inter-convert electrical and chemical energy. Fuel cells2, 3 and electrolyzers4 are closely related: the former converts fuel to electricity and the latter reverses the process. In fact, a single device can accomplish both tasks, depending if it is fed fuel or driven by electricity.
A natural question is why fuel cells and electrolyzers are not widely used even though they were discovered over 150 years ago5, 6? Part of the answer may be that fuel cells and electrolyzers have suffered from a disproportionately high fraction of top-down research compared to other technologies7. That is, the early success at making working devices has led to an emphasis on engineering-based solutions. Innovation resulting from scientific understanding has lagged because essential fundamental knowledge is missing and difficult to obtain. Specifically, which of the basic processes of the charge-transfer reactions8, 9 limit rates and efficiencies in fuel cells and electrolyzers is still incompletely understood.
The fundamental electrochemical phenomenon in both fuel cells and electrolyzers is the formation of electrical double-layers across material interfaces, as illustrated in Fig. 1. Driven by gradients in their chemical and electrical potentials, charged species (electrons and ions) cross through the double-layers from one phase to another. As reviewed in Section 3, every double-layer has an associated potential (difference) that is modified by an “overpotential” when the current is flowing. In fact, the current through a double-layer depends exponentially on its overpotential10. An overpotential always decreases the device’s power output by reducing the useful potential obtained from a fuel cell and increasing the potential needed to drive an electrolyzer. If the overpotential grows relatively fast with increasing current, the device is inefficient and must be run at low current11 to minimize the losses.
Many theoretical works have addressed the origin and contributions to overpotentials12, 13, 14, but experimental approaches to directly measuring overpotentials are scarce because of large challenges. First, overpotentials only exist when the cell is in operando. Second, they cannot be measured by a contact probe, the traditional approach to measuring potentials on metals and semiconductors — contacting a potential probe to a solid-state electrolyte, which must be electrically insulating, introduces another double-layer, confounding the measurement15, 10.

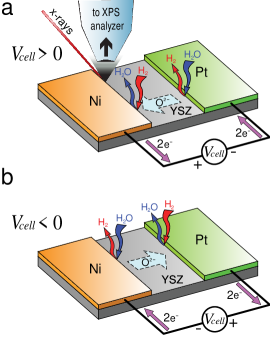
Here we use a new method to measure directly all the overpotentials in a working electrochemical device. Using a newly constructed spatially-resolved ambient-pressure photoemission spectroscopy (APXPS) platform16, 17, 18, we employ photoelectrons as a non-contact probe of local electrical potential19, 20. We use a driven solid-oxide electrochemical cell (SOEC) as a model system to study both fuel cell (H2 oxidation) and electrolyzer (H2O splitting) reactions on Ni and Pt electrodes (Fig. 2). Sections 3 and 4 describe in detail the potentials and overpotentials expected in this model cell. We then describe the measured overpotentials, which we validate with simultaneous electrochemical impedance spectroscopy (EIS). Analysis of the individual spatially-resolved overpotentials reveals direct information about the charge-transfer reactions.
2 Experimental
The solid electrolyte of the SOEC studied was a wafer of single-crystal yttria-stabilized zirconia (YSZ). The Pt (99.99% pure) and Ni (99.995% pure) electrodes were fabricated on the YSZ by evaporation from crucibles heated by an electron beam under high vacuum conditions ( Torr). The electrode shape was controlled using a stainless-steel shadow mask positioned in front of the YSZ substrate. Figures 2 and 3a show a schematic and a photograph, respectively, of the SOEC.
A specially developed holder was used to electrically contact the SOEC while at high temperature in the H2O/H2 ambient. The holder uses spring-loaded probes to provide reliable electrical contact to the thin-film electrodes and is equipped with a ceramic button-heater compatible with oxidizing atmospheres21. A computer-based Gamry potentiostat (model PCI4-750) was used to bias the SOEC and perform standard electrochemical tests.
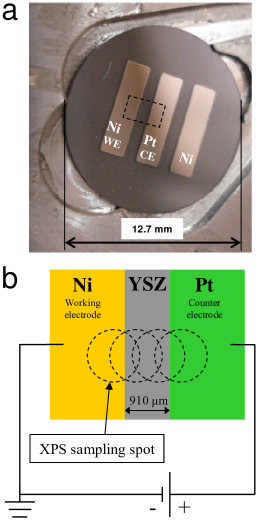
Once the cell was positioned in front of the collection cone of the APXPS spectrometer, 150 mTorr H2O was introduced into the chamber, followed by 150 mTorr H2. After stabilizing the pressure, the sample was heated from room temperature to about 700 C over the course of 1 hour22. These pressures and temperatures were sufficient to produce cell currents up to 200 A. Temperatures were measured by a two-color pyrometer enabled by blocking the radiation from the heater with a Pt film on the backside of the YSZ wafer. Secondary temperature measurements were obtained by measuring the bulk conductance of YSZ between the electrodes using EIS at zero applied bias. The Ni electrode was assigned to be the working electrode (WE) and was electrically connected to the spectrometer ground. This “Fermi-edge coupling” aligns the Fermi edge of the Ni and the spectrometer. The Pt electrode, assigned as the counter electrode (CE), is biased relative to the grounded Ni electrode. The electrochemical measurements were taken in a two probe configuration (Fig. 3b).
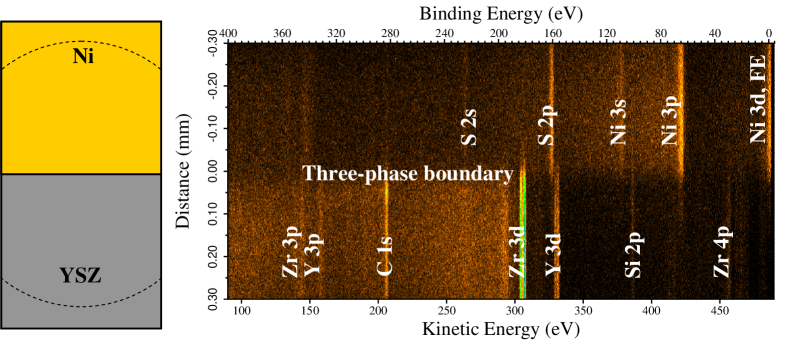
APXPS16, 17 measurements were performed at the Advanced Light Source (LBNL, Berkeley) beamline 9.3.2. The end-station is equipped with a Scienta R4000 HiPP ambient-pressure electron spectrometer. By means of a series of electron lenses and differentially pumped stages, the electron analyzer side is maintained under high vacuum conditions. The spectrometer was optimized in this project to perform 1D spatially-resolved APXPS18. The photo-electrons are dispersed by their kinetic energy along the x-axis of the spectrometer’s two-dimensional detector. Along the detector’s y-axis, the electrons are mapped according to the position that they were emitted from the sample (see Fig. 4). Thus, the spectrometer spectrally resolves the electrons with simultaneous 1D spatial resolution. The field-of-view for the spatial resolution dimension is 0.6 mm and the resolution is 1 m. To analyze larger areas, the sample holder was translated with high precision using a 4-axis manipulator, as illustrated in Fig. 3b. The resulting data was analyzed by dividing each image into 5 or 10 m thick slices along the spatial resolution axis. By integrating the counts of every slice along this axis, a standard XPS spectrum of counts vs. kinetic energy was obtained. The beamline energy resolution, which determines the XPS peak widths, is 160 meV at the photon energy used (490 eV).
For obtaining the local electrical potentials of the cell, APXPS spectra were obtained at several values of applied bias. The potentials from the YSZ electrolyte and the Ni and Pt electrodes were measured using the Ni 3p3/2, Zr 3d5/2 and Pt 4f7/2 XPS core levels, respectively. These element-specific core levels have sharp XPS peaks and have relatively high cross-sections for the exciting x-rays (490 eV). The peaks were background corrected and fitted to determine their kinetic energies. At each discrete analysis location, the peak positions with and without applied bias were subtracted (to obtain , as explained in detail in Appendix A). The 910 m-wide region of YSZ electrolyte (see Fig.3b) between the electrodes was analyzed using 182 Zr 3d5/2 spectra separated by 5 m steps.
3 Double-layer potentials in a driven SOEC
Since driven (electrolyzers) cells are much less discussed than fuel cells in the literature, in this section we review their operation. We then formally define the different types of potentials present in the SOEC. With no applied bias, the SOEC materials are in equilibrium with the gas phase. Furthermore, the gas phase is in equilibrium with itself, so there is no chemical energy that can be extracted. Applying a potential (bias) between the electrodes perturbs this equilibrium. For the Ni/YSZ/Pt cell shown in Fig. 2, the metallic electrodes then charge by accumulating electrons or holes, depending on the polarity, at their surfaces. These charged electrodes induce a layer of net (ionic) charge of opposite sign in the electrolyte region adjacent to the electrode, forming an electrical double-layer there. The mobile charges in YSZ are O2- ions23, so the YSZ under the positive electrode has an O2- excess and the YSZ under the negative electrode has an O2- deficiency, or equivalently, an excess of oxygen vacancies (V). The electrolyte charge layer is expected to be only a few nanometers thick24. Thus, the double-layer is the response of the electrolyte to the electric field created between the electrodes. The charge at the electrolyte interfaces effectively screens the penetrating electric field and maintains the bulk electrolyte at an almost constant potential, reducing its overall electrostatic energy.
The potential of the charged layer is called the outer (Volta) potential and is of coulombic nature25, 26. The total (inner or Galvani) potential is the sum of the outer potential and the surface potential , which is of dipolar nature25, 26. The difference between the inner potentials of the electrode/electrolyte adjacent to their interface is defined as the total double-layer potential and is written for the Ni/YSZ interface as:
| (1) |
where is the difference operator and the / superscripts represent the Ni-electrode and the YSZ-electrolyte sides of the electrical double-layer, respectively.
The total interface overpotential is defined10 as the change of the inner potential difference between equilibrium (zero external bias) and non-equilibrium (non-zero bias):
| (2) |
or equivalently,
| (3) |
for the Ni/YSZ interface, where and are the biased and the equilibrium inner potentials of the interface, respectively, and and are the inner potentials at the Ni and YSZ sides of the double-layer, respectively. These total double-layer overpotentials of a driven SOEC have several contributions15:
| (4) |
where and are the portions of the externally applied bias that creates the double-layers at the electrode/YSZ interfaces, and are the reaction activation overpotentials and and are the mass-transfer limitation overpotentials, also called the concentration overpotentials. We note that all the contributions to the overpotential are interrelated15 and it is not possible to obtain the total overpotentials from independently calculated contributions. As we next review, only the contributions favor the electrochemical reactions.
4 Electrochemical reactions in a driven SOEC
When the driven SOEC is exposed to gas-phase H2 and H2O, charge-transfer reactions start (Fig. 2). The electrical and chemical driving forces for the charge-transfer reactions arise from the double-layers at the electrode/electrolyte interfaces, which scale as and . The O2- and V excess under the electrodes at the opposite sides of the YSZ electrolyte will drive the adjacent bare YSZ surface out of chemical equilibrium with the gas-phase species. Gas/surface reactions then act to return the surface to equilibrium. In addition, the strong electric field produced by the double-layers creates a gradient in the electrochemical free energy of electrons and ionic species involved in the charge-transfer reactions. This gradient causes electrons to cross the electrode/gas interface and the ions to cross the electrolyte/gas interface (in the most general case27).
Since charge-transfer reactions involve gas-phase species, electrons, and O2- ions, they will occur at or close to the three-phase boundary (TPB), where the gas phase, electrolyte and electrode meet, and only where a double-layer exists. The overall charge-transfer reaction,
| (5) |
proceeds at the same net rates in the forward and reverse directions at the TPB of the positive and negative electrodes, respectively (see Fig. 2).
In response to the charge-transfer reactions, the electrolyte produces a net flux of O2- from the negative to the positive electrode, closing the circuit with the external, fixed-potential power supply. The potential drop arising from the O2- flux across the YSZ electrolyte is a different type of overpotential, since it does not occur at an interface, but though the electrolyte. It has the form , where is the total cell current and is the electrolyte resistance.
The Butler-Volmer kinetic relationship,
| (6) |
in its simplest form (the high-field approximation10, 28), relates the current density and the total double-layer overpotentials . is the exchange-current density flowing back and forth across the interface when the cell is in equilibrium, and is proportional to the charge-transfer reaction rate. The applied potential difference is distributed across the three overpotentials of the cell:
| (7) |
However, the Butler-Volmer relationship tells us that the total overpotentials of the two electrode/electrolyte interfaces, not , directly controls the current across the interface. Thus, to balance all the currents through the cell at steady state requires a unique, non-trivial set of overpotentials (Eq. 7). By directly measuring these fundamental and highly correlated values, that is, by determining the “potential landscape,” SOEC performance can be understood and improved. We next quantify the potential landscape.
5 Results and discussion
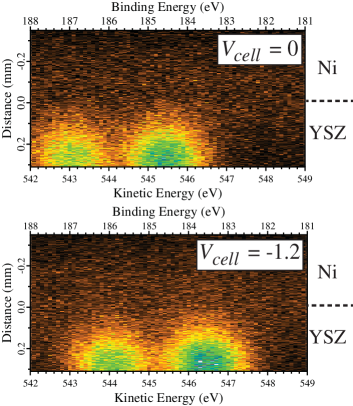
In this section we will describe how we have directly measured the three SOEC overpotentials , and of Eq. 7 using APXPS. We then discuss the information contained in the overpotentials. Figure 5 illustrates how the kinetic energy of a Zr XPS peak changes with cell bias. During the SOEC operation, the Pt, Ni, and YSZ surfaces underwent no chemical changes, as revealed through the XPS spectra. That is, the peak shifts with cell bias have no contributions from chemical shifts. Then the kinetic energy changes only arise from changes in the material’s inner potential, as shown in Eq. 12 of the Appendix A. Figure 6a plots the element-specific absolute values of from the Ni electrode, across the YSZ electrolyte, to the Pt electrode for V. The potentials are constant across the two metal electrodes29. The standard deviations of the kinetic energy differences with and without -1.2 V bias are Ni 3p eV, and Pt 4f eV for Ni and Pt, respectively. These results show the high precision, roughly 10 meV, at which potentials and potential differences can be measured by the APXPS approach. Since the precision depends mainly on the signal-to-noise ratio of the XPS peak, it can be easily improved using greater time averaging, for example. Across the YSZ the potential changes linearly, as documented by the goodness of the least-squares fit to a line =a+b: a eV and b eV/m where is distance.
| Potentiostat | XPS | ||||
|---|---|---|---|---|---|
| (V) | A) | (V) | (V) | (V) | ) |
| -1.2 | 202 | 0.81 | 0.30 | 0.045 | 223 |
| -0.6 | 86 | 0.32 | 0.20 | 0.017 | 198 |
| 0.6 | 48 | 0.37 | 0.17 | 0.010 | 208 |
| 1.2 | 32 | 1.02 | 0.15 | 0.006 | 187 |
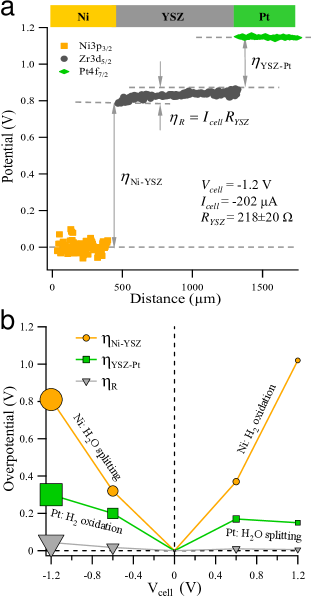
In Figure 6a the discontinuities in the potentials (i.e., the values) at the electrode/electrolyte boundaries are the overpotentials, as established by Eq. 3. Because the electrodes are metals, their electrical potential is constant. Thus, the metal has the same potential at the point probed by XPS (point A in Fig. 1) and at its buried interface with the YSZ. We use the 1D spatial resolution to measure the inner potential of the bare YSZ at point B in Fig. 1, which is about 10 m from the electrode. The YSZ potential at this point and the potential of the YSZ under the electrode differ only by the small ohmic drop through the short YSZ segment. For the operating conditions of our cell, we estimate that this difference introduces an error of less than 1% of in the double-layer overpotentials.
Table 1 contains all the measured overpotentials and other relevant quantities obtained from the potentiostat and from the XPS data. The sum of all three total overpotentials is mV lower than , likely due to the resistance of the cables and the contact resistance between the spring-loaded probes and the electrodes. The closeness of the overpotential sum to shows that the measured overpotentials have internal consistency. An additional validity test comes from EIS measurements taken concurrently with the XPS data. Figure 7b shows a potentiostatic Bode plot. As the phase angle goes to zero at high-frequency, the impedance measures the global electrolyte resistance of the SOEC30, giving . Dividing the APXPS-derived overpotential by is an alternative way of calculating the electrolyte resistance. As shown in Table 1 the agreement between the two methods is excellent. In addition, this comparison shows that the current in the SOEC is spatially uniform because the value probed by XPS in a localized region agrees with the average full-cell (global) value. These two independent tests validate the methodology of using APXPS as a non-contact method of measuring overpotentials in operando.
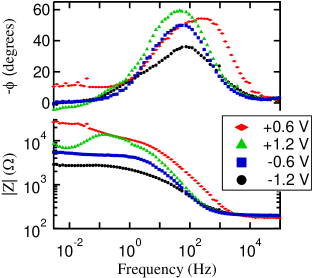
Figure 6b plots the measured overpotentials for several values. The marker size is proportional to (see Table 1). We next discuss what information can be learned from how the individual overpotentials change with . At a given value, both electrodes experience the same current (), have the same geometry and, thus, the same TPB length. is therefore proportional to both current densities, and . In addition, the electrodes experience the same temperature and the same gas composition and pressure. However, the electrodes have different steady-state overpotentials when current flows, as can be seen in Fig. 6b. The Butler-Volmer relationship (Eq. 6) tells us that electrodes experiencing the same current densities () with different overpotentials must have different exchange-current densities (). That is, the electrodes differ in their efficiency in performing the corresponding charge-transfer reaction. We next explore how the exchange-current densities of Pt and Ni compare for the two different cell reactions, H2O splitting and H2 oxidation (Eq. 5).
The Ni overpotentials are always larger than the Pt overpotentials, whether Ni is splitting H2O or oxidizing H2, i.e., for 0 and 0, respectively (Fig. 6b). With the same steady-state current flowing through both electrodes, Eq. 6 then informs us that the larger overpotential of Ni occurs because its exchange-current density is smaller than that of Pt. This must be the case for both electrochemical reactions:
| (8) |
where the superscripts and refer to H2O splitting and H2 oxidation reactions, respectively. In other words, Ni needs a bigger fraction of than Pt to compensate for its poor charge-transfer reaction rate. The higher exchange-current density of Pt is indicative of its superior electro-catalytic activity, i.e., it is more efficient for catalytic promotion of the charge-transfer reaction. Other contributions might include differences in the micro-structural quality of the electrodes and the accumulation of impurities at the TPB. While the performance difference between Ni and Pt is not at all surprising31, 32, we emphasize the directness of our approach to make such determinations.
Comparing the velocities of the H2O splitting and H2 oxidation reactions on the same electrode but at different values of requires accounting for the cell current. We do this by considering the ratio between the overpotential and the current, the faradaic resistance =/, which represents the total reaction resistance. Lower faradaic resistance indicates a faster reaction velocity. When = V and = 0.6 V, Ni is performing and , respectively, and and . This comparison shows that H2O splitting on Ni is faster than H2 oxidation. At the same cell voltages, Pt is performing and , respectively, and and . Therefore, H2 oxidation proceeds more rapidly than H2O splitting on Pt.
The cell behaviour at = and 0.6 V directly illustrates the importance of the electro-catalyst in the overall SOEC performance – the Ni and Pt electrodes have similar overpotentials but the current is two times greater when hydrogen oxidation occurs on Pt ( = V).
At =1.2 V, =1.02 V and =32 A. At the same time, is smaller than at =0.6 V. These observations are explained by the known33, 34 interfacial oxidation of Ni, which occurs when . The oxide layer at the interface and the TPB greatly decreases the electro-catalytic activity of the Ni electrode, reducing and consequently increasing and the total Ni overpotential, . Commercial fuel-cells avoid the oxidation of Ni by using porous Ni-YSZ cermets that increase the extent of the Ni electrode TPB and reduce the local current densities, also reducing . Because the current is smaller at 1.2 V than at 0.6 V, is also smaller. The overpotential at the Ni/YSZ interface at =0.6 (=0.37 V) indicates that the Ni interface was not oxidized during these conditions.
6 Conclusions
We have demonstrated that photo-electron spectroscopy performed in operando at near ambient pressure can measure directly the individual overpotentials in solid-state electrochemical devices. In our simple electrically driven SOEC, the Ni and Pt electrodes are at the same temperature, see the same gas, and have the same symmetric geometry on the YSZ electrolyte. We can then interpret the origins of the changes in the individual overpotentials (, and ) with applied bias in terms of the different electro-catalytic activities of Ni and Pt for the H2O splitting and H2 oxidation reactions. We find without ambiguity that H2O splitting is faster than H2 oxidation on Ni, while on Pt oxidation reaction proceeds more rapidly than O splitting. In addition, by measuring the portion of the applied bias that is consumed at the Ni/YSZ interface, , we can determine if the Ni at that interface is oxidized under different conditions.
Using photo-electrons as non-contact potential probes in operando allows direct access to all the individual overpotentials of an electrochemical cell. Knowing the “potential landscape,” along with the “composition/chemical state landscape,” should provide a deeper understanding of the basic mechanisms of fuel-cell and electrolyzer operation and enable improved performance.
7 Acknowledgments
We thank C. Zhang, S. C. DeCaluwe, and B. W. Eichhorn for stimulating discussions, and G. S. Jackson (U. of Maryland) for comments on this manuscript. This research was supported by the U. S. Department of Energy through the Sandia Laboratory Directed Research and Development program under Contract DE-AC04-94AL85000. The Advanced Light Source is supported by the Director, Office of Science, Office of Basic Energy Sciences, of the U.S. Department of Energy under Contract No. DE-AC02-05CH11231.
Appendix
Appendix A SOEC potentials probed by photo-electrons
In this appendix, we provide a formal description of how XPS can directly measure the difference between biased and non-biased (equilibrium) states in a material’s inner potential, . The fundamental XPS process is the emission of a photo-electron from an atomic energy level (core or valence band) excited by monochromatic x-rays35, 36. The emitted photo-electron will leave the surface if the kinetic energy it acquired from the incident x-ray photon, , can overcome all the potentials that bind it to the solid.
The electron kinetic energy measured at the spectrometer can be considered as the sum of discrete contributions. First, the electron has to overcome the atomic binding energy (referenced to the material’s Fermi level), E, to escape from the atom. E is defined as the energy difference between the initial, unperturbed N electron atom and the final-state N-1 electron atom. After escaping the atom, the electron has to travel through the solid toward the surface. Since we are only interested in the elastic electrons present in XPS peaks and not the broad inelastic backgrounds, we have to consider the electron mean free path in the solid. For the kinetic energies used in this work, the mean free path is 1 nm, i.e., electrons created within 1 nm of the surface will escape elastically out of the solid.
The second term to consider is the chemical potential of the electron, , which is the negative of the energy cost of removing one electron at the Fermi energy from the solid. ( is defined as introducing one electron into the material.) This energy is characteristic of a material. The third contribution arises if the sample and the spectrometer are not Fermi-edge coupled37, 38, 39, 36. Then the difference between their Fermi levels will contribute to the measured kinetic energy. We will call this term the Fermi-level difference, FE. The fourth contribution is the energy cost of crossing the surface potential , which results in an energy of , where is the charge of the electron. The combination of the electron chemical potential with negative sign and the energy change in crossing the surface potential dipole is the electron work function40, 41, 25: . The fifth (last) contribution comes from the spectrometer — the electron has to overcome the spectrometer work function () to enter and be counted.
When a driven cell is measured under bias, double-layers will form and overpotentials will develop at both electrode/electrolyte interfaces (see Section 3). Since all the other contributions to the photo-electron kinetic energy just described (E, , 42 and ) are independent of the bias, the difference in the kinetic energies of photo-electrons from the same region with applied bias and with no external bias measures the change in the Fermi level difference43, 44:
| (9) |
Only the Ni electrode is Fermi-edge coupled to the XPS spectrometer, so for all bias conditions. When bias is applied between Ni and Pt electrodes, the Fermi level of the YSZ and Pt will change with respect to the XPS spectrometer (). To relate the Fermi energy and the inner potential, we recall that the Fermi level of a particular phase, , corresponds45, 24 to the electrochemical potential of its electrons, :
| (10) |
Since does not depend on bias, the bias-induced change in corresponds to:
| (11) |
If the kinetic energy is measured in eV, eV/V and:
| (12) |
That is, by measuring how the kinetic energies of the XPS peaks shift rigidly with bias, the change in inner potential can be measured46. In Section 5 we show how this relationship can be combined with the equations in Section 3 to directly measure the total overpotential of a double-layer. We emphasize the key point that the photo-electrons have finite escape depth, 1 nm in our experiment. Thus, we are measuring the inner potential changes in the material’s near-surface region. In contrast, the surface potential arises from the atomically-sharp discontinuity in the material at its surface.
Notes and references
- Winter and Brodd 2004 M. Winter and R. J. Brodd, Chemical Reviews, 2004, 104, 4245–4270.
- Haile 2003 S. M. Haile, Acta Materialia, 2003, 51, 5981–6000.
- Kirubakaran et al. 2009 A. Kirubakaran, S. Jain and R. Nema, Renewable and Sustainable Energy Reviews, 2009, 13, 2430–2440.
- Ni et al. 2008 M. Ni, M. K. Leung and D. Y. Leung, International Journal of Hydrogen Energy, 2008, 33, 2337–2354.
- Grove 1839 W. R. Grove, Philosophical Magazine Series 3, 1839, 14, 127.
- Appleby 1990 A. J. Appleby, Journal of Power Sources, 1990, 29, 3–11.
- Andújar and Segura 2009 J. Andújar and F. Segura, Renewable and Sustainable Energy Reviews, 2009, 13, 2309–2322.
- Vogler et al. 2009 M. Vogler, A. Bieberle-Hutter, L. Gauckler, J. Warnatz and W. G. Bessler, Journal of The Electrochemical Society, 2009, 156, B663–B672.
- Goodwin et al. 2009 D. G. Goodwin, H. Zhu, A. M. Colclasure and R. J. Kee, Journal of The Electrochemical Society, 2009, 156, B1004–B1021.
- Bockris et al. 2000 J. O. Bockris, A. K. N. Reddy and M. Gamboa-Aldeco, Modern Electrochemistry 2A, Springer, Berlin, 2000.
- 11 For example, the charge time of a Li-ion battery is much slower than the discharge because of large overpotentials when the current is flowing in the charging direction.
- Nörskov et al. 2004 J. K. Nörskov, J. Rossmeisl, A. Logadottir, L. Lindqvist, J. R. Kitchin, T. Bligaard and H. Jónsson, The Journal of Physical Chemistry B, 2004, 108, 17886–17892.
- Mann et al. 2006 R. Mann, J. Amphlett, B. Peppley and C. Thurgood, Journal of Power Sources, 2006, 161, 775–781.
- Bessler et al. 2007 W. G. Bessler, J. Warnatz and D. G. Goodwin, Solid State Ionics, 2007, 177, 3371–3383.
- Gileadi 1993 E. Gileadi, Electrode Kinetics for Chemists, Chemical Engineers and Materials Scientists, John Wiley and Sons, New York, 1993.
- Ogletree et al. 2002 D. F. Ogletree, H. Bluhm, G. Lebedev, C. S. Fadley, Z. Hussain and M. Salmeron, Review of Scientific Instruments, 2002, 73, 3872–3877.
- Salmeron and Schlögl 2008 M. Salmeron and R. Schlögl, Surface Science Reports, 2008, 63, 169–199.
- Grass et al. 2010 M. E. Grass, P. G. Karlsson, F. Aksoy, B. W. M. Lundqvist, B. S. Mun, Z. Hussain and Z. Liu., Review of Scientific Instruments, submitted.
- Fahlman et al. 1966 A. Fahlman, K. Hamrin, J. Hedman, R. Nordberg, C. Nordling and K. Siegbahn, Nature, 1966, 210, 4–8.
- Siegbahn and Lundholm 1982 H. Siegbahn and M. Lundholm, Journal of Electron Spectroscopy and Related Phenomena, 1982, 28, 135–138.
- Whaley 2010 J. Whaley, Manuscript in preparation.
- 22 The total pressure increases from 300 mTorr at room temperature to 380 mTorr at 700 C.
- Chiang 1997 Y. Chiang, Physical ceramics, J. Wiley, New York, 1997.
- Bard 2001 A. Bard, Electrochemical methods : fundamentals and applications, Wiley, New York, 2nd edn, 2001.
- Trasatti and Parsons 1986 S. Trasatti and R. Parsons, Pure and Applied Chemistry, 1986, 58, 437–454.
- Trasatti 1986 S. Trasatti, Pure and Applied Chemistry, 1986, 58, 955–966.
- Adler 2004 S. B. Adler, Chemical Reviews, 2004, 104, 4791–4844.
- Noren and Hoffman 2005 D. Noren and M. Hoffman, Journal of Power Sources, 2005, 152, 175–181.
- 29 A critical advantage of our spectral imaging approach is that we can distinguish electrode material that becomes electrically disconnected from the electrode. Such material can occur at the metal/electrolyte boundary where the metal de-wets the substrate, forming isolated metal islands. Using the element-specific and spatially resolved PES peaks, we can directly distinguish metal islands that are not at the electrode potential but at the same potential as the surrounding YSZ.
- Orazem 2008 M. Orazem, Electrochemical impedance spectroscopy, Wiley, Hoboken N.J., 2008.
- Rossmeisl and Bessler 2008 J. Rossmeisl and W. G. Bessler, Solid State Ionics, 2008, 178, 1694–1700.
- Li et al. 2008 H. Li, K. Lee and J. Zhang, PEM Fuel Cell Electrocatalysts and Catalyst Layers, 2008, pp. 135–164.
- Chigane and Ishikawa 1998 M. Chigane and M. Ishikawa, Journal of the Chemical Society, Faraday Transactions, 1998, 94, 3665–3670.
- Garcia-Miquel et al. 2003 J. L. Garcia-Miquel, Q. Zhang, S. J. Allen, A. Rougier, A. Blyr, H. O. Davies, A. C. Jones, T. J. Leedham, P. A. Williams and S. A. Impey, Thin Solid Films, 2003, 424, 165–170.
- Hüfner 2003 S. Hüfner, Photoelectron spectroscopy: principles and applications, Springer, Berlin, 3rd edn, 2003.
- Siegbahn 2008 K. Siegbahn, Nishina Memorial Lectures, Springer Japan, Tokyo, 2008, vol. 746, pp. 137–228.
- Ebel 1976 M. F. Ebel, Journal of Electron Spectroscopy and Related Phenomena, 1976, 8, 213–224.
- Lewis and Kelly 1980 R. T. Lewis and M. A. Kelly, Journal of Electron Spectroscopy and Related Phenomena, 1980, 20, 105–115.
- Barr 1994 T. L. Barr, Modern ESCA, CRC Press, Boca Raton, FL, 1994.
- Rysselberghe 1953 P. V. Rysselberghe, The Journal of Chemical Physics, 1953, 21, 1550–1551.
- Hölzl and Schulte 1979 J. Hölzl and F. K. Schulte, Solid Surface Physics, Springer-Verlag, Berlin, 1979, vol. 85, pp. 1–150.
- 42 Although the surface potential, , will change if the surface adsorbates change with external bias, we should note that the surfaces probed by PES in this experiment (electrode-gas and electrolyte-gas, A and B in Fig. 1, respectively) do not have double-layers and consequently, do not change their near-surface electric field. As a consequence we do not expect adsorbates and to change significantly with the bias.
- Edgell et al. 1986 M. Edgell, D. Baer and J. Castle, Applied Surface Science, 1986, 26, 129–149.
- Ahn et al. 2006 H. Ahn, M. Zharnikov and J. E. Whitten, Chemical Physics Letters, 2006, 428, 283–287.
- Bockris and Khan 1983 J. O. Bockris and S. U. M. Khan, Applied Physics Letters, 1983, 42, 124–125.
- Ladas et al. 1993 S. Ladas, S. Kennou, S. Bebelis and C. G. Vayenas, The Journal of Physical Chemistry, 1993, 97, 8845–8848.