Ionization near-zones associated with quasars at
Abstract
We analyze the size evolution of HII regions around 27 quasars between to 6.4 (’quasar near-zones’ or NZ). We include more sources than previous studies, and we use more accurate redshifts for the host galaxies, with 8 CO molecular line redshifts and 9 MgII redshifts. We confirm the trend for an increase in NZ size with decreasing redshift, with the luminosity normalized proper size evolving as: Mpc. While derivation of the absolute neutral fraction remains difficult with this technique, the evolution of the NZ sizes suggests a decrease in the neutral fraction of intergalactic hydrogen by a factor from to 5.7, in its simplest interpretation. Alternatively, recent numerical simulations suggest that this rapid increase in near-zone size from to 5.7 is due to the rapid increase in the background photo-ionization rate at the end of the percolation or overlap phase, when the average mean free path of ionizing photons increases dramatically. In either case, the results are consistent with the idea that to 7 corresponds to the tail end of cosmic reionization. The scatter in the normalized NZ sizes is larger than expected simply from measurement errors, and likely reflects intrinsic differences in the quasars or their environments. We find that the near-zone sizes increase with quasar UV luminosity, as expected for photo-ionization dominated by quasar radiation.
1 Introduction
Observations have set the first constraints on the epoch of reionization (EoR), corresponding to the formation epoch of the first luminous objects (see the review by Fan, Carilli, & Keating 2006a). Studies of Gunn-Peterson (GP) absorption in quasar spectra (Gunn & Peterson 1965), and related phenomena, suggest a qualitative change in the state of the intergalactic medium (IGM) at , indicating a rapid increase in the neutral fraction of the IGM, from at , to (by volume) at . Conversely, the large scale polarization of the cosmic microwave background (CMB) is consistent with instantaneous reionization at (Komatsu et al. 2010). These data suggest that reionization is less an event than a process, beginning at , and with the ‘percolation’, or ’bubble overlap’ phase ending at to 7. Unfortunately, current methods for measuring the neutral fraction of the IGM have fundamental limitations, as GP absorption saturates at low neutral fractions (), and CMB polarization measurements are an integral measure of the Thompson scattering optical depth back to . Indeed, Mesinger (2010) has pointed out that there is no definitive evidence for (or against) a largely ionized IGM, even as late as , while recent measurements of the temperature of the high Ly forest suggest fairly late reionization (; Bolton et al. 2010).
Luminous quasars at the end of cosmic reionization will generate the largest ionized regions in the Universe during this epoch. These have been alternatively called Cosmological Strömgren Spheres or quasar near-zones (NZ), and we adopt the latter to be consistent with the recent literature. The near-zone behavior has been described by numerous authors (Shapiro & Giroux 1987; Madau & Rees 2000; Cen & Haiman 2000). A straight-forward calculation (Haiman 2002) shows that, when recombination is not important, and when the quasar lifetime is much less than the age of the Universe, the physical size of the expected NZ behaves as:
where is the NZ proper radius, is the rate of ionizing photons from the quasar, is the quasar host galaxy redshift111Note that we make the reasonable assumption that the quasar is at rest relative to its host galaxy., and is the quasar age. This calculation ignores clumping, and assumes the mean cosmic density over the large scales being considered.
Spectra of quasars show evidence for large ionized regions around bright quasars on proper scales Mpc. The evidence comes in the form of excess transmission on the blue wing of the Ly emission line, prior to the onset of full GP absorption. This excess emission has been interpreted as being due to the local ionizing effect of the quasar. A number of studies have attempted to use these NZ to derive constraints on the IGM neutral fraction, using the equation above and assuming mean quasar lifetimes derived from demographics (White et al. 2003, 2005; Mesinger & Haiman 2004; Wyithe, Loeb, & Carilli 2005; Yu & Lu 2005; Gnedin & Prada 2004; Furlanetto, Hernquist & Zaldariaga 2004; Wyithe & Loeb 2004; Walter et al. 2003).
The most detailed treatment of quasar near-zones associated with quasars to date is that by Fan et al. (2006b). They point out numerous factors that make the absolute measurement of the neutral fraction using NZ radii difficult, including: (i) uncertainties in the mean quasar lifetimes and ionizing photon rates, (ii) large scale structure in biased regions and pre-ionization by local galaxies, and (iii) clumpiness in the IGM (see also Lidz et al. 2007; Maselli et al. 2007; Bolton & Heahnelt 2007a,b). However, Fan et al. also point out that over the narrow redshift range being considered, the systematics are likely to be comparable for all sources, and hence, ‘if there is an order of magnitude evolution in the IGM ionization, the size of the HII regions should show strong evolution, providing a reliable relative measurement of the neutral fraction (with redshift).’
More recently, Wyithe et al. (2008) and Bolton et al. (2010) have argued, based on numerical simulations, that the dominant effect on quasar near-zones during the end of reionization, or the percolation stage, when the overall neutral fraction is low, may be a rapidly increasing contribution to photo-ionization from the cosmic ionizing background with cosmic time, acting in concert with the quasar photons to lift the GP trough near the edge of the near-zone.
Fan et al. (2006b) emphasize that the measurements of the NZ sizes are uncertain due to a number of factors, including the determination of where the transmission drops to zero, ie. the on-set of the GP effect (), and the redshift of the host galaxy (). To mitigate the former, they define the ionization zone, , as the region in which the transmitted flux ratio (relative to the extrapolated continuum) is above 0.1 when smoothed to a resolution of 20 . This is well above the average GP transmission for quasars at this redshift (), and hence mitigates affects of a fluctuating IGM, while still providing a good relative measurement of NZ sizes over the narrow redshift range considered. Willott et al. (2008) have considered this technique for two quasars, and point out that the transmission can rise above 0.1 just one or two resolution elements further from the quasar, raising the question of where to draw the line for ? In this paper, we use the strict and quantifiable definition of Fan et al. (2006b), namely, the first redshift below the quasar redshift at which the transmission drops under 0.1, in order to be consistent with previous literature. We refer the reader to the extensive discussion in Fan et al. 2006b and Willott et al. (2008) for details.
One major uncertainty in the Fan et al. (2006b) analysis was the host galaxy redshift, . In particular, most of the host galaxy redshifts in the Fan et al. sample were based on a combination of Ly+NV and high-ionization lines such as CIV and Si IV. It is well documented that broad Ly emission is a poor indicator of the host galaxy redshift due to absorption on the blue-side of the emission line, while the high ionization lines can have large velocity offsets, of order 1000 km s-1 ( at ), with respect to low ionization lines such as MgII (Richards et al. 2002).
We have undertaken an extensive study of the radio through submm properties of quasars to probe the dust, molecular gas, and star formation properties of the host galaxies (Wang et al. 2010; Wang et al. 2008; Wang et al. 2007; Carilli et al. 2007; Walter et al. 2009; Walter et al. 2004; Bertoldi et al. 2003; Bertoldi et al. 2003). One key result from our program is the detection of CO emission from the host galaxies of 8 quasars (Wang et al. 2010). High resolution imaging shows that the CO is centered within 0.2” of the quasar, at least in one source (Walter et al. 2004; Riechers et al. 2009), and CO almost certainly provides the host galaxy redshift to very high accuracy (). In parallel, we have been using near-IR spectra to detect MgII emission from quasars (Kurk et al. 2007; Jiang et al. 2007), which also provides much more accurate host galaxy redshifts ().
2 The quasars and redshifts
We have assembled a sample of 27 quasars, all of which have reasonable signal-to-noise rest-frame UV spectra required for this analysis, mostly from the Keck telescope. Most of these (24) are from the Sloan Digital Sky Survey from Fan et al. (2006c) and Jiang et al. (2008). J1425+3254 was discovered in the AGN and Galaxy Evolution Survey of Cool et al. (2006). J2329-0301 and J1509-1749 are from the Canada-France High-z Quasar Survey of Willott et al. (2007). Eight of this sample are detected in CO, from which an accurate is derived (see Wang et al. 2010 and references therein). Nine of the sources have measured from the MgII emission line (Kurk et al. 2007; Jiang et al. 2007). The other ten objects have redshifts determined from the Ly+NV lines.
We summarize all the parameters in Table 1, including the quasar 1450 absolute magnitude (), redshifts, and comoving radial distances222Ned Wright’s cosmological code is used in the calculation (Wright 2006) with the standard WMAP cosmology (Spergel et al. 2007)..
We adopt the definition of the NZ radius () used in Fan et al. (2006b), i.e. the physical distance implied by the Hubble flow, derived from the difference between the quasar host galaxy redshift () to the point () where the transmitted flux first drops by a statistically significant amount to below 10% of the quasar extrapolated continuum emission: , after the spectrum is smoothed to a resolution of . and are the co-moving distances implied by the redshifts. Following Fan et al. (2006b), we fit a double Gaussian + power-law profile to the quasar spectrum redward of Ly as the quasar intrinsic continuum and then calculate transmitted flux as a function of wavelength.
Spectra of the SDSS quasars are from Fan et al. 2006 and Jiang et al. 2008. The spectrum of the AGES quasar (J1425+3254) is from Cool et al. (2006). For the two Willott et al. quasars, J2329-0301 and J1509-1749, we have not re-fit the spectra, but use the values quoted in Willott et al. (2007). Again, to be consistent with the sample in Table 1, we adopt the strict definition of Fan et al. (2006) of defined by the first redshift (below the quasar redshift) at which the transmission drops below 0.1.
To properly compare NZ sizes, we normalize all the values to a fixed UV absolute magnitude , using the relation: . The values are listed in the last column of Table 1.
Three sources in Table 1, J0353+0104, J1044-0125, and J1048+4637, are broad absorption line (BAL) quasars (Fan et al. 2006c; Jiang et al. 2008), and the source J1335+3533 has a lineless UV spectrum discovered in Fan et al. (2006c). For completeness, we calculate the values for these quasars in Table 1. However, as with Fan et al. (2006b), we exclude these quasars from our subsequent analysis due to the fundamentally different nature of their intrinsic spectra, in particular around the Ly emission redshift. The different intrinsic spectra imply that using the same spectral fitting analysis technique described above to derive could lead to erroneous results. Keeping this cautionary note in mind, it is interesting that these sources are all among the smallest near-zones in the sample, and three of the four have been detected in CO. The presence of a BAL, and of CO in the host galaxy, implies relatively dense local environments for these quasars, and hence larger UV attenuation, which could lead to small values.
3 Redshift errors
The Ly+NV redshifts have large uncertainties of , due to emission broad line widths, Gunn-Peterson absorption, and offsets between different ionization lines in quasar spectra (Richards et al. 2002, 2003; Fan et al. 2006c). This implies an uncertainty of Mpc. There is also a systematic offset of similar magnitude between the MgII and higher ionization broad line redshifts (Richards et al. 2002). We have corrected the redshifts in the bottom section of Table 1 (’other redshifts’) using this mean offset ( in ; note that J2315-0023 was already corrected in the literature).
Richards et al. (2002) compare MgII broad line redshifts with [OIII] narrow line redshifts in lower quasars and find: km s-1. We add to this the uncertainties in spectral fitting (; Jiang et al. 2007; Kurk et al. 2007), and estimate a typical uncertainties in the MgII redshifts of , implying Mpc. The CO observations significantly improve the redshift measurements, with an uncertainty of , implying .
Considering the errors on , Fan et al. (2006b) estimate that at resolution, they can measure the onset of the Gunn-Peterson trough to an accuracy of at least , or . This is certainly a conservative estimate of the error, and implies Mpc due to errors in . We add this error in quadrature to the errors on . The implied total errors are then: (i) Mpc (physical) for sources with Ly redshifts, (ii) Mpc for sources with MgII redshifts, and (iii)Mpc for sources with CO redshifts.
4 Analysis
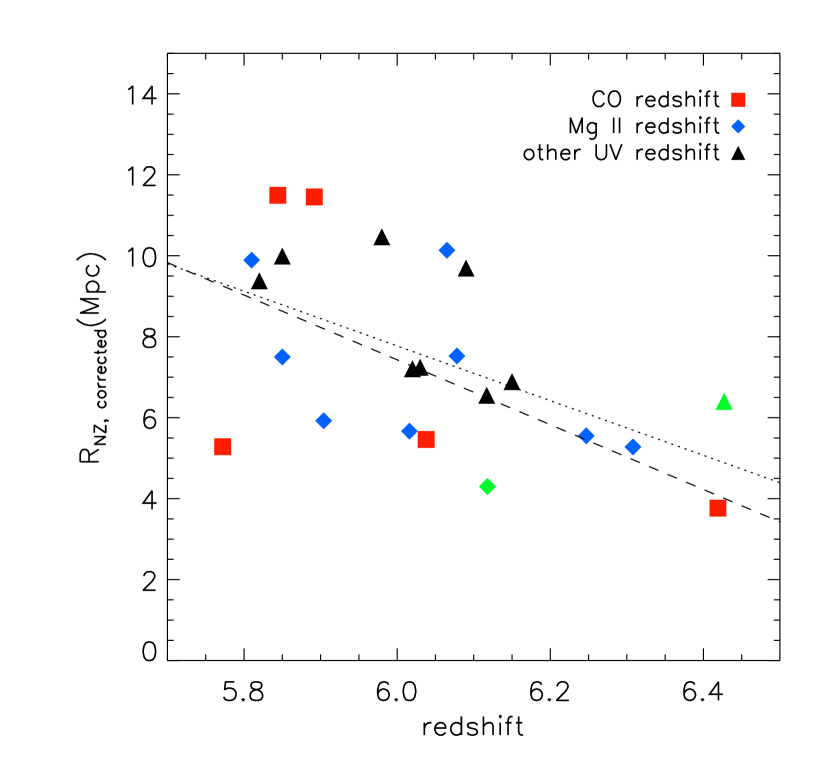
We plot the values versus quasar redshift in Figure 1. Again, we omit the three BAL sources and the lineless quasar from this analysis for reasons given in Section 2. The figure shows a decrease in with increasing redshift. A weighted linear fit to the data points gives , while an unweighted fit yields a similar result of . The errors were computed both from the formal fitting process, as well as by computing the scatter in the fitted parameters after fitting realizations removing one data point at time. To be conservative, we adopt the larger errors from the latter process in the analysis below.
For the weighted fit, the mean NZ radius changes from Mpc at , to Mpc at . The Spearman rank correlation coefficient for the distribution is , implying a probability that there is no correlation between redshift and of just 1%. Further, a Student’s t-test gives a probability of 1% for the hypothesis that the slope is zero (ie. no change in mean NZ size over this redshift range). In the simplest physical picture, f(HI), implying an increase in the volume averaged neutral fraction by a factor from to 6.4.
After removing the linear slope in redshift, we calculate an rms for the scatter in the normalized NZ sizes of Mpc. Fan et al. (2006b) see a similar scatter, but could not say whether this was due to errors in or physical differences between quasars. In our sample, the measurement errors are all below this rms value, and hence there must be intrinsic physical differences between quasars, either in terms of their environments, or AGN properties (eg. quasar age, SED).
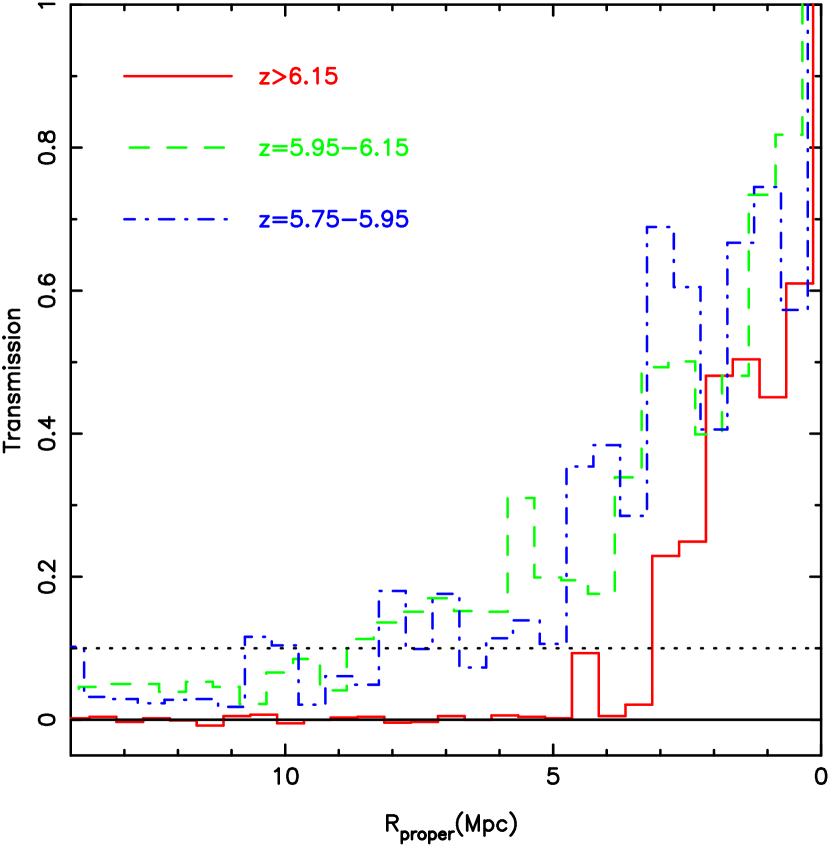
Figure 2 shows the mean absorption profiles in the quasar NZ for three different redshift bins. This is the updated version of Fig. 13 in Fan et al. (2006b), and as with Fan et al., we do not scale the profile according to the quasar luminosity in this case. There is a clear evolution in profiles. The lowest redshift bin first drops below 10% transimission by a statistically significant amount at 8.5 Mpc radius, while this occurs for the highest redshift bin at 3.5 Mpc. Fan et al. (2006b) point out that this marked difference in absorption profiles from to is a graphic illustration of the change in the mean neutral state of the IGM at .
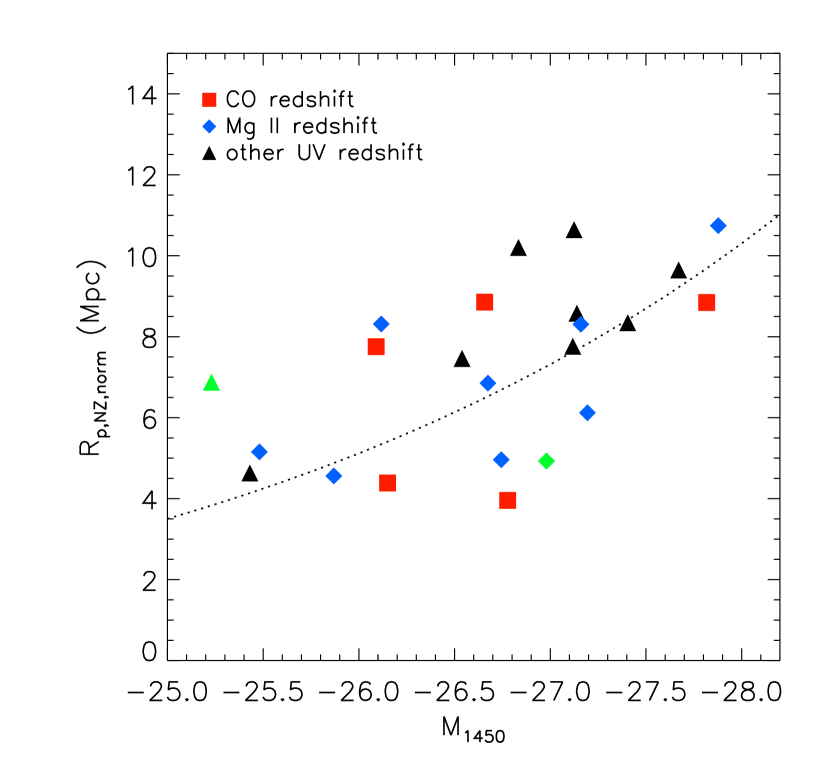
Figure 3 shows the relationship between and . Figure 3a shows values taken directly from Table 1, and Figure 3b shows the values after normalizing-out the linear regression relationship between NZ size and redshift derived from Figure 1, which we designate as . A correlation is found between NZ sizes and . The Spearman rank correlation coefficient for the distribution in Figure 3b is , implying a probability that there is no correlation between M1450 and of just 0.4%. Included in Figure 3 is a dotted line that follows the relationship: , as naively expected for photo-ionization dominated by quasar radiation. This line has not been fit to the data, but is shown for reference. The overall trend of increasing with the quasar luminosity is consistent with this very simple model, although the scatter is such that this is by no means proof of the model.
As a final comparison, Figure 4 shows the relationship between and redshift. We find no correlation between quasar absolute magnitude and redshift over the narrow redshift range of this sample. Formally, the Spearman rank correlation coefficient for the distribution is , implying a high probability that there is no correlation between redshift and M1450 of 62%.
5 Discussion
Using a larger sample and improved quasar host redshifts, we have confirmed a statistically significant increase in luminosity normalized NZ sizes from to 5.7, first noted by Fan et al. (2006b). In the simplest physical model, the factor 2.3 change in mean NZ radius is consistent with a factor of 9.4 decrease in mean neutral fraction from to 5.7. Fan et al. (2006b) derive a volume averaged neutral fraction of at from their analysis of GP absorption troughs and gaps. The NZ measurements then suggest that the neutral fraction has increased to at .
Wyithe et al. (2008) and Bolton et al. (2010) have proposed an alternative interpretation for this evolution in NZ sizes. Based on numerical simulations, they argue that the dominant effect on quasar near-zones during the end of reionization, or the percolation stage, may be a rapidly increasing contribution to photo-ionization from the cosmic ionizing background with cosmic time. The increasing mean free path allows the background photons to contribute substantially to the ionization around the edge of the NZ, thereby effectively increasing the observed sizes of the NZ. In either case, the results are consistent with the idea that to 7 corresponds to the tail end of cosmic reionization.
Our improved measurements imply that the intrinsic scatter in the NZ sizes is large at any given redshift: Mpc. This large scatter must reflect real physical differences between quasars, perhaps some combination of differences in SEDs, UV escape fractions, ages, and/or local environments. Bolton & Haehnelt (2007b) have argued that the quasar age is less a factor when f(HI) , since the size is then most likely dictated by absorption (and recombination) in denser regions of residual neutral gas within the sphere itself. The small NZ sizes seen for the BAL quasars in Table 1 suggest a dependence on the immediate local environment, although see the cautionary note in Section 2 concerning these sources.
We also find an increase in with quasar UV luminosity. This correlation is qualitatively consistent with photo-ionization dominated by quasar radiation. Lastly, we find no correlation between and redshift over the relatively narrow redshift range explored in this sample.
We re-emphasize that the use of the near-zone technique has major pit-falls when trying to estimate the absolute neutral fraction at a given redshift, as detailed in Fan et al. (2006b) and Bolton & Heahnelt (2007a,b). In this paper, we have improved substantially one of the observational uncertainties in the calculation, namely, the quasar host galaxy redshifts, and we have focused on the evolution of the NZ sizes and neutral fraction, not the absolute neutral fraction. Still, as Bolton & Heahnelt point out, a larger sample with accurate measurements of the spectral regions around both Ly and Ly is necessary to set meaningful constraints on the absolute neutral fraction of the IGM using the NZ technique.
| CO redshiftsa | |||||||
|---|---|---|---|---|---|---|---|
| Name | |||||||
| Mpc | Mpc | Mpc | Mpc | ||||
| J084035.0+562419 | -26.66 | 5.8441 | 8352.6 | 5.69 | 8281.8 | 10.4 | 11.5 |
| J092721.8+200123 | -26.78 | 5.7722 | 8319.9 | 5.70 | 8286.5 | 4.9 | 5.3 |
| J104433.0012502d | -27.47 | 5.7824 | 8324.5 | 5.70 | 8286.5 | 5.7 | 4.9 |
| J104845.0+463718d | -27.55 | 6.2284 | 8519.2 | 6.16 | 8490.5 | 4.0 | 3.4 |
| J114816.6+525150 | -27.82 | 6.4189 | 8596.9 | 6.33 | 8561.0 | 4.9 | 3.8 |
| J133550.8+353315d | -26.82 | 5.9012 | 8378.2 | 5.89 | 8373.2 | 0.76 | 0.8 |
| J142516.3+325409 | -26.09 | 5.8918 | 8374.0 | 5.76 | 8314.3 | 8.8 | 11.6 |
| J205406.4000514 | -26.15 | 6.0379 | 8438.3 | 5.97 | 8408.7 | 4.2 | 5.5 |
| Mg II redshiftse | |||||||
| J000552.3000655 | -25.87 | 5.850 | 8355.2 | 5.77 | 8318.9 | 5.3 | 7.5 |
| J030331.4001912 | -25.48 | 6.078 | 8455.6 | 6.00 | 8422.2 | 4.7 | 7.5 |
| J083643.8+005453 | -27.88 | 5.810 | 8337.1 | 5.62 | 8248.9 | 13.0 | 9.9 |
| J103027.1+052455 | -27.16 | 6.308 | 8552.0 | 6.21 | 8511.5 | 5.6 | 5.3 |
| J130608.2+035626 | -27.19 | 6.016 | 8428.8 | 5.92 | 8386.6 | 6.0 | 5.7 |
| J141111.2+121737 | -26.74 | 5.904 | 8379.5 | 5.82 | 8341.7 | 5.4 | 5.9 |
| J150941.7174926 | -26.98 | 6.118 | – | – | – | 4.3 | 4.3 |
| J162331.8+311200 | -26.67 | 6.247 | 8526.9 | 6.16 | 8490.5 | 5.1 | 5.6 |
| J163033.9+401209 | -26.12 | 6.065 | 8450.0 | 5.94 | 8395.4 | 7.7 | 10.1 |
| Other Redshiftsf | |||||||
| J000239.3+255034 | -27.67 | 5.82 | 8341.7 | 5.65 | 8263.1 | 11.5 | 9.4 |
| J035349.7+010404d | -26.53 | 6.049 | 8443.1 | 6.02 | 8430.5 | 1.8 | 2.1 |
| J081827.4+172251 | -27.40 | 6.02 | 8430.5 | 5.89 | 8373.2 | 8.1 | 7.2 |
| J084119.5+290504 | -27.12 | 5.98 | 8413.0 | 5.81 | 8337.1 | 10.9 | 10.5 |
| J113717.7+354956 | -27.12 | 6.03 | 8434.9 | 5.91 | 8382.1 | 7.5 | 7.2 |
| J125051.9+313021 | -27.14 | 6.15 | 8486.3 | 6.03 | 8434.9 | 7.2 | 6.9 |
| J143611.7+500706 | -26.54 | 5.85 | 8355.2 | 5.72 | 8295.8 | 8.7 | 10.0 |
| J160253.9+422824 | -26.83 | 6.09 | 8460.7 | 5.94 | 8395.4 | 9.2 | 9.7 |
| J231546.5002358 | -25.43 | 6.117 | 8472.3 | 6.05 | 8443.5 | 4.1 | 6.6 |
| J232908.2030158 | -25.23 | 6.427 | – | – | – | 3.7 | 6.4 |
aErrors on based on CO redshifts are .
bErrors on at 20 resolution
estimated by Fan et al. (2006b) are .
cIn section 3, we estimate errors in as:
1.34 Mpc for sources with Ly redshifts,
0.72 Mpc for sources with MgII redshifts, and 0.60 Mpc for sources with CO redshifts.
dBAL or lineless quarsar, see Section 2.
eErrors on based on MgII redshifts are .
fErrors on based on Ly+NV redshifts are .