Pulsation Models for Ultra-Low () Metallicity Classical Cepheids
Abstract
Classical Cepheids are primary distance indicators playing a fundamental role in the calibration of the extragalactic distance scale. The possible dependence of their characteristic Period-Luminosity (PL) relation on chemical composition is still debated in the literature, and the behaviour of these pulsators at very low metallicity regimes is almost unexplored. In order to derive constraints on the application of the Period-Luminosity relation at low metal abundances, we investigate the properties of the few ultra-low metallicity () Cepheids recently discovered in the Blue Compact Dwarf galaxy IZw18. To this purpose we have computed an updated and extended set of nonlinear convective models for and , spanning a wide range of stellar masses, and taking into account the evolutionary constraints for selected luminosity levels. As a result we are able to predict the topology of the instability strip, the variations of all the relevant quantities along the pulsation cycle, including the morphology of the light curves, the theoretical Period-Luminosity-Color, Period-Wesenheit and Period-Luminosity relations at such a low metallicity. For each of these relations we provide the appropriate coefficients for fundamental mode pulsators with Z=0.0004. By comparing these results with the properties of more metal rich Cepheids we find that the synthetic PL relations for are steeper than at higher Z, but similar to the ones, thus suggesting a leveling off of the metallicity effect towards the lowest Zs.
1 Introduction
With their characteristic Period-Luminosity (PL) and Period-Luminosity-Color (PLC) relations, Classical Cepheids play a relevant role as distance indicators for the definition of the extragalactic distance scale. The application of a Large Magellanic Cloud (LMC)-based PL relation to external galaxies observed with the Hubble Space Telescope (HST), has led to the calibration of secondary distance indicators and in turn to an estimate of the Hubble constant (, see e.g. Freedman et al. 2001; Saha et al. 2001).
The theoretical explanation for the observational evidence of a PL relation for Classical Cepheids relies on the assumption that intermediate mass stars undergoing central Helium burning are characterized by a Mass-Luminosity (ML) relation, as predicted by stellar evolution models.
The ML relation is significantly dependent on several physical and numerical assumptions adopted in stellar evolution models, thus the comparison between observations and Cepheid evolutionary/pulsation models provides a unique insight into the stellar evolution and pulsation physics.
An important issue still under debate is the universality of the Cepheid PL relations, and, in turn, the possibility of applying LMC-calibrated Cepheid PL relations to infer the distance of any galaxy containing Cepheids, independently of its chemical composition. In the last decade many efforts were devoted to investigate the dependence of the Cepheid properties on metallicity, since a metallicity effect could produce significant systematic errors in the evaluation of the extragalactic distance scale and in turn on . However, no general consensus has been reached yet.
On the theoretical side, linear non adiabatic models mostly suggest that a variation in chemical composition produces negligible effects on the PL relations (see e.g. Chiosi, Wood, & Capitanio 1993; Alibert et al. 1999; Saio & Gautschy 1998; Sandage, Bell, & Tripicco 1999), while nonlinear convective pulsation models (Bono, Marconi, & Stellingwerf 1999; Fiorentino et al. 2002; Marconi, Musella, & Fiorentino 2005) predict a significant metallicity effect on the Cepheid instability strip (hereinafter IS) topology and on the PL relations. For instance, Caputo, Marconi, & Musella (2000) and Fiorentino et al. (2002) find that the synthetic PL relations become shallower as the metallicity increases, and the size of the effect depends also on the photometric band, with a decreasing sensitivity as wavelength increases from optical to near infrared (NIR) bands. Consequently, metal-rich pulsators with periods longer than five days have fainter optical magnitudes than metal-poor pulsators. This scenario is further complicated by the theoretical finding that the helium mass fraction also plays a role at the highest metallicities (), with the slope of the linear PLs increasing as increases at fixed (Fiorentino et al. 2002; Marconi, Musella, & Fiorentino 2005). In turn, the metallicity correction to the predicted distance moduli varies with the assumed , showing a sort of turnover around solar metallicity. In particular, for P 20 days and [O/H] 0.2 dex, as measured in several spiral galaxies observed by the HST Key Project (Freedman et al. 2001), the average predicted metallicity correction varies from 0.2 mag to +0.25 mag, as increases from 2.0 to 3.5.
On the empirical side, several authors suggest that metal-rich Cepheids are, at fixed period, brighter than metal-poor ones, either over the entire period range (Kennicutt et al. 1998; Kanbur et al. 2003; Storm et al. 2004; Groenewegen et al. 2004; Sakai et al. 2004; Macri et al. 2006), or at least for periods shorter than 25 days (Sasselov et al. 1997; Sandage, Tammann, & Reindl 2004). Sakai et al. (2004) by comparing distances based on Cepheids and on the Tip of the Red Giant Branch (TRGB) method for a selected sample of spiral galaxies, found that the metallicity effect, usually expressed in the form , is equal to 0.25 mag dex-1. However, the revised TRGB distances by Rizzi et al. (2007) no longer support a value of 0.25 mag dex-1 and are in better agreement with the theoretical results (see Bono et al. 2008, for details). Other empirical results that seem to support the nonlinear theoretical scenario were obtained by Romaniello et al. (2005, 2008), on the basis of spectroscopic [Fe/H] measurements for Galactic and Magellanic Cloud Cepheids. Using only their spectroscopic abundances for Galactic Cepheids with published distances, Romaniello et al. (2005) found that the metallicity correction is in qualitative agreement with the model results, and shows the same kind of turnover around solar metallicity as predicted by nonlinear pulsation theory. More recently, using direct high resolution metallicity measurements for a total of 68 Galactic and Magellanic Cepheids, Romaniello et al. (2008) found that metallicity affects the -band Cepheid PL relation, with metal-rich Cepheids appearing to be systematically fainter than metal-poor ones, in agreement with the theoretical predictions by Bono et al. (1999) and Caputo, Marconi, & Musella (2000), and independently of the adopted distance scale for Galactic and LMC Cepheids.
On the other hand, direct empirical tests of the metallicity effect based on the observation of Cepheids in the outer and inner fields of M101 (Kennicutt et al. 1998), in NGC4258 (Macri et al. 2006), and, recently, in M33 (Scowcroft et al. 2009), should be taken with caution. Indeed, in M101 the presence of blended Cepheids could have affected the results of the test (see Macri et al. 2006), while in the case of NGC4258 there is evidence against the assumed metallicity gradient, as both the comparison with pulsation models and the most recent HII abundance measurements (Díaz et al. 2000) suggest a rather constant LMC-like metal-content for the Cepheids observed in the two selected fields (see Bono et al. 2008, for details). In M33, Scowcroft et al. (2009) adopted the [O/H] gradient by Magrini et al. (2007) and conclude that blending cannot account for the difference in distance modulus between the two fields. However, as also pointed out by Romaniello et al. (2008), these results are always based on indirect measurements of the metallicity, assumed to be that corresponding to the oxygen nebular abundances of HII regions at the same Galactocentric distance of the Cepheids.
Finally, there are also recent empirical results in favour of the universality of the PL slope: distance estimates based on the “near-infrared surface brightness” (ISB) technique (Fouqué et al. 2007, and references therein) and the HST parallaxes (Benedict et al. 2007) for ten Galactic Cepheids seem to indicate a vanishing metallicity effect between Galactic and Magellanic Cepheids. Similar suggestions have been put forward by several authors (see e.g. Pietrzynski et al. 2006, 2007; Gieren et al. 2008) for Cepheids in galaxies with metallicities significantly lower than the LMC, but no theoretical predictions are available in the literature for the metallicity effect on the properties of Cepheids in this range of abundances or at lower Z.
The identification and study of Cepheids in very metal-poor galaxies, is a challenging perspective. These galaxies represent the closest analog to primordial galaxies in the early universe and, as such, offer the best place where to study star formation and stellar evolution in a (almost) pristine environment. Some of these galaxies have also been claimed to be primordial systems just forming in the local Universe due to lack of detection of faint red stars on the red giant branch tip (TRGB, stars older than 1 Gyr). However, the lack of these stars may also be due to a much larger distance of these systems that does not allow to resolve the faint TRGB stars. A precise determination of the distance of these galaxies through Cepheids allows us to verify or confute their nature of young nearby galaxies. In the context of the HST ACS GO program 10586 (PI: A. Aloisi) we have identified three Classical Cepheids in the Blue Compact Dwarf galaxy IZw18, having respectively periods of 8.71, 125 and 130.3 days. A new estimate of the distance, and, in turn, of the age of the galaxy stellar populations were obtained both from the Classical Cepheids and from the galaxy’s TRGB, which allowed us to rule out the possibility that IZw18 is a truly primordial galaxy of recent formation in the local universe (Aloisi et al. 2007). At the same time this project also provided a first sample of ultra-low metallicity () Classical Cepheids (Fiorentino et al. 2010), thus representing an important benchmark for the pulsation models.
In this paper we investigate theoretically the pulsation properties of Cepheids at this very low metallicity (Z=0.0004), in order to probe the metallicity effect at Z 0.004, and to provide a theoretical scenario for the Classical Cepheids recently detected in IZw18 (Aloisi et al. 2007; Fiorentino et al. 2010). The organization of the paper is as follows: in Sect. 2 we present the new set of pulsation models; in Sections 3 and 4 we show our results for the topology of the IS and the behaviour of the light curves, while the multi-filter PLC, Period-Wesenheit and PL relations are presented and discussed in Sect. 5. Finally, in Sect. 6 we discuss the comparison with the Cepheids observed in IZw18 and the implications for the Cepheid distance scale. Conclusions are summarized in Sect. 7.
2 Pulsation models for ultra-low metallicity Cepheids
Using the same pulsation code (see Bono, Marconi, & Stellingwerf 1999, for details) adopted in our previous investigations of more metallic Cepheids (Bono, Marconi, & Stellingwerf 1999; Fiorentino et al. 2002; Marconi, Musella, & Fiorentino 2005), we investigated for the first time the full amplitude behaviour of metal-poor Cepheid models. To this purpose we fixed the metal and helium abundances at , and selected model stellar masses in the range from 4 to 13 . Two luminosity levels (see Table 1) were assumed for most of the selected stellar masses corresponding to canonical and mild overshooting (noncanonical) evolutionary predictions, respectively. The canonical scenario is provided by the Pisa Evolutionary Library (PEL) for and discussed in Castellani et al. (2003); Cariulo, Degl’Innocenti, & Castellani (2004)111 For models at 13 we extrapolated the ML relation obtained for lower masses taking into account the evidence that, for higher metal content, models with 13 follow the same ML relation as lower mass models., while the noncanonical luminosity level is obtained by adding 0.25 dex (in ) to the canonical value, according to the prescriptions by Chiosi, Wood, & Capitanio (1993). For each mass and luminosity, an extensive range of effective temperatures was explored for pulsation instability, in order to derive the location of the blue and red edges of the IS in the Hertzsprung-Russell (HR) diagram. For canonical models, we also explored the effect of varying the mixing length parameter , adopted in the code to close the nonlinear system of dynamical and convective equations (see Bono & Stellingwerf 1994; Bono, Marconi, & Stellingwerf 1999, for details), in the range from the standard value of 1.5 to 2.0. In the following two sections we discuss the results obtained for the topology of the IS, and for the morphological properties of the bolometric light curves, respectively.
3 Predicted IS for Cepheids with Z=0.0004
For each selected mass and luminosity, the effective temperatures of the hottest pulsating fundamental model, increased by 50 K (fundamental blue edge, hereafter FBE), and of the coolest pulsating fundamental model, decreased by 50 K (fundamental red edge, hereafter FRE) are reported in the third and fourth columns of Table 1, respectively. The adopted uncertainty of 50 K in the location of the IS boundaries stems from our adopted effective temperature step of 100 K in the model selection. This is the procedure we adopted in our previous theoretical papers on Cepheids (Bono, Marconi, & Stellingwerf 1999; Fiorentino et al. 2002; Marconi, Musella, & Fiorentino 2005; Fiorentino et al. 2007, e.g.) and RR Lyrae stars (Bono et al. 1997; Marconi, Caputo, Di Criscienzo, & Castellani 2003; Di Criscienzo, Marconi, & Caputo 2004).
For the first overtone mode, canonical pulsators show a stable oscillation only for stellar masses smaller than or equal to 7 , while we verified that the first overtone IS disappears increasing the mass by only 0.1 . Noncanonical first overtone models present a stable limit cycle only for masses . The first overtone IS boundaries are reported in Table 2.
Our theoretical results confirm that the longest period for first overtone pulsators () increases as the metal content decreases, being of about 9 days at Z=0.0004 and of about 6 days at Z=0.004 (Bono et al. 2001, 2002). As already discussed by Bono et al. (2002), this behaviour is in marginal agreement with observational evidence in the Milky Way and in the Magellanic Clouds, and at variance with results from linear pulsation models that predict the opposite trend.
The location in the HR diagram of fundamental and first overtone IS boundaries is shown in Figure 1, as obtained from canonical (middle panel) and noncanonical (upper panel) pulsation models, respectively. In this plot the solid lines represent the FBE and FRE, while the dashed lines are the boundaries of the first overtone instability strip. We notice that at fixed luminosity level, there is no significant difference in the effective temperature of the IS boundaries, as we move from a canonical to a noncanonical mass-to-luminosity (ML) relation. For canonical fundamental models, the bottom panel of Figure 1 shows the effect of a different assumption on the efficiency of convection, namely (dotted lines) instead of . We notice that increasing the mixing-length parameter, the instability strip becomes narrower, as already found in our previous investigations of more metallic Cepheid models (Fiorentino et al. 2007) and for RR Lyrae stars (Di Criscienzo, Marconi, & Caputo 2004).
3.1 Comparison with the predictions at higher metallicities
Figure 2 shows the comparison between the IS obtained in the present paper for fundamental canonical models with , and those obtained by Bono, Marconi, & Stellingwerf (1999) at metallicities traditionally assumed for the Magellanic Clouds and the Galactic Cepheids, namely , , and . We notice that the location of the new boundaries confirms the trend already found at higher metal content up to (see Fiorentino et al. 2002; Marconi, Musella, & Fiorentino 2005) that the predicted IS moves toward lower effective temperatures as the metallicity increases. In fact, the FBE for is bluer than the one for because of the increased abundance of Hydrogen that produces an higher efficiency of the Hydrogen ionization region in driving pulsation. For the same reason, the FRE for is cooler than the one for for masses lower than about 9. At higher masses and luminosities (lower densities), the simultaneous effect of the lower metallicity, combined with the high efficiency of convection (that reduces the driving role of both Hydrogen and Helium ionization regions), prevails and produces a hotter red edge.
However, the effect seems to be relatively small, so that no relevant implication on the zero point and on the slope of the theoretical PL relations are expected when moving from the typical metal contents of the Magellanic Clouds to the significantly lower abundance of IZw18 (see below).
4 An atlas of theoretical light curves for ultra-low metallicity Cepheids
The bolometric light curves we have obtained for canonical fundamental pulsation models are shown in Figs. 3-8 for stellar masses ranging from 4 to 13 . The light curve data for the complete set of models are available upon request from the authors. For stellar masses ranging from 5 to 11 the predicted light curves for are also shown for comparison. Confirming our previous results on the effect of the convective efficiency on the pulsation properties (Fiorentino et al. 2007; Di Criscienzo, Marconi, & Caputo 2004), the amplitude of the theoretical light curves decreases as increases from 1.5 to 2.0. An interesting feature shown by these models is the behaviour of the bump-Cepheids. As well known, Classical Cepheids in the period range 6 P 16 days show a secondary maximum (bump) along both light and radial velocity curves. The Hertzsprung progression (HP; Hertzsprung 1926; Ledoux & Walraven 1958; Bono, Marconi, & Stellingwerf 2000) is the relationship linking the phase of the bump and the pulsation period. Inspection of Figure 5 suggests that at Z=0.0004 the transition from light curves with the bump on the decreasing branch to light curves with the bump on the increasing branch occurs at a pulsation period of 13 days. This value is significantly longer than the observed (Moskalik, Buchler, & Marom 1992; Moskalik et al. 2000; Beaulieu 1998) and predicted periods (Bono, Marconi, & Stellingwerf 2000) at the center of the HP () for Galactic ( 10 d), LMC ( 10.5 d) and SMC ( 11 d) bump Cepheids. This theoretical result thus confirms the predicted and observed trend of with metallicity (see also Marconi, Musella, & Fiorentino 2005).
5 Fundamental relations for Z=0.0004 Cepheids
The combination of the period-density relation for pulsating stars and the Stephan-Boltzmann law provides a strict relation between the pulsation period, the luminosity, the effective temperature and the mass. In Tables 3 and 4, we report the stellar masses, the luminosities, the effective temperatures, the periods and the predicted intensity-averaged mean magnitudes and colors (see below) for fundamental and first overtone models, respectively. A linear regression fit to the data reported in the first four columns of these tables allows us to derive the following theoretical pulsation relations:
for fundamental models, and
for first overtone models, both showing an intrinsic dispersion of 0.01 mag. The bolometric light curves of the new models were transformed into the observational Johnson-Cousins bands (UBVRIJK) by means of the atmosphere models by Castelli, Gratton, & Kurucz (1997a, b) to derive the intensity-averaged mean magnitudes and colors reported in Tables 3 and 4. Magnitude-averaged values were also computed and are available upon request from the authors. Static magnitude values have been derived and used to obtain the boundaries of the instability strip, at each chemical composition, in the various period-magnitude planes and, in turn, to construct synthetic multi band PL relations for fundamental canonical models (see Table 7).
Linear regressions through the periods, magnitudes and colors reported in Table 3 allow us to derive theoretical PLC and Wesenheit relations for fundamental Cepheids, both in the canonical case and in the noncanonical one. Since the two cases differ only by a luminosity offset (0.25 dex), the relations are the same in the two cases except for the value of the term , where is the ratio between the luminosity and the canonical luminosity level for the corresponding chemical composition. The PLC has the form:
= +log+(color)+,
where , , and have the values listed in Table 5 for each color. The Wesenheit relation has the form:
– (color) = +log+,
where , , and have the values listed in Table 6.
The coefficients for the corresponding relations for first overtone pulsators are available upon request. Figures 9 and 10 show the comparison between models at Z=0.0004 (IZw18) and Z=0.008 (LMC) in the PLC and Wesenheit planes, respectively, when the canonical ML relation is assumed. The magnitude differences at fixed period are mainly due to the effect of the different chemical composition on the predicted luminosity of each stellar mass. No relevant dependence on the assumed parameter is expected. The PLC does not depend on the instability strip topology and the Wesenheit relation has only a weak dependence, thanks to the inclusion of a color term with a coefficient given by the ratio between the total and the relative extinction and thus generally different from that of the PLC (see also Fiorentino et al. 2007).
Following the same procedure adopted in our previous papers (Caputo, Marconi, & Musella 2000; Fiorentino et al. 2002; Marconi, Musella, & Fiorentino 2005), we have used the information on the boundaries of the IS and the pulsation relation for fundamental models to derive synthetic PL relations in the BVRIJK filters (see Caputo, Marconi, & Musella 2000, for details):
,
where is the photometric band. The coefficients and of the linear relations are reported in Tables 7 and 8 for canonical models with and 2.0, respectively, and in Table 9 for noncanonical models with ( and ). Quadratic relations are also available, upon request from the authors. However, as discussed in the text, the nonlinear effect is very small at the chemical composition of IZw18’s Cepheids.
Figure 11 shows the - distribution of canonical fundamental pulsators for the two different assumptions on (left and right panels) and for the noncanonical models with (middle panel). The solid lines represent the linear fits from Table 7. As already found for higher metal contents, the distribution of the pulsators becomes narrower when moving towards the infrared. We also find that the coefficients of the PL relations depend on both the ML relation and the value of the mixing length parameter (as also found from the comparison of Table 7 with Tables 8 and 9), but with an effect on the inferred distance lower than 10 %.
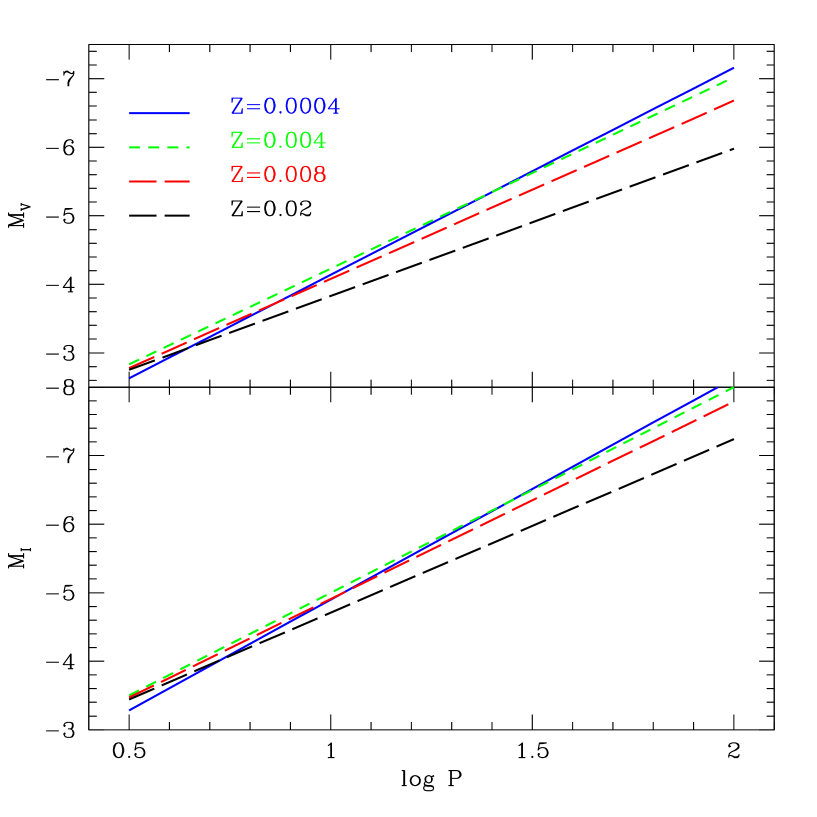
The PL relations at Z=0.0004 are remarkably more linear than those obtained at higher Z with no clear evidence of a break at 10 days (see Ngeow, Kanbur & Nanthakumar 2008, Sandage, Tammann, & Reindl 2009 and references therein). In Figure 12 we show the comparison between the synthetic PL relations described here and those corresponding to the chemical compositions of Cepheids in the Magellanic Clouds (Z=0.004, Z=0.008 Y=0.25), and in the Milky Way (Z=0.02 Y=0.28). The PL relations for Z=0.0004 are steeper than those at higher metallicities, confirming the trend with metallicity predicted by our previous pulsation models (see Bono et al. 2008; Caputo, Marconi, & Musella 2000), but are very similar to those at Z=0.004 for periods longer than about 10 days. The difference in absolute magnitude between the predicted PL at Z=0.0004 and Z=0.004 is lower than 0.1 mag for periods between about 8 and 70 days.
6 Theory versus observations
In this section we compare the theoretical relations derived in the previous sections with the properties of the three Classical Cepheids we have identified in IZw18 (Fiorentino et al. 2010). It should be noted that the PL is a statistical relation, and it is not safe to apply it to a very small sample of Cepheids as that of IZw18. For this reason, in the following we will focus only on the Wesenheit relations, that have much lower intrinsic scatter caused by the finite width of the instability strip, and on the light curve model fitting technique. In particular, due to the unusually long periods of two of the 3 Cepheids found in IZw18 (namely, =125 for V15, and 130.3 days for V1, see Fiorentino et al. 2010, for the identification of the variables), we will apply these two theoretical methods only to the bona fide classical Cepheid in IZw18, namely star V6 (=8.71 days, Fiorentino et al. 2010).
In the two panels of Figure 13 we show the comparison between models and observations in the Wesenheit versus period plane for two different assumptions on the ML relation. As these relations are reddening free, the shift required to superimpose the observed distributions to the theoretical relations directly gives the intrinsic distance modulus. By applying to V6 the canonical and noncanonical Period-Wesenheit relations in the bands, we obtain two estimates of the distance modulus of the galaxy and the associated uncertainties, as labelled in each panel of Fig. 13. The two inferred values are consistent with each other within the errors and in agreement with our previous estimates of the distance to IZw18 obtained in Aloisi et al. (2007), and in particular with the distance based on the TRGB ( mag).
An independent constraint on the distance to IZw18 can also be obtained by applying the light curve model fitting technique to V6. This is a powerful tool to derive a direct estimate of the intrinsic stellar parameters, that has already been applied with success to both Galactic (Natale, Marconi, & Bono 2008) and Magellanic (Wood, Arnold, & Sebo 1997; Bono, Castellani, & Marconi 2002; Keller & Wood 2002, 2006) Cepheids. Results from the application of the method to the observed light curves of V6 are shown in Figs. 14 and 15, for isoperiodic sequences of models at fixed luminosity and at fixed mass, respectively. These models reproduce the observed curves within 0.13 mag simultaneously in and . In turn, we find that V6 is expected to have a stellar mass ranging from to , in the range from 3.64 to 3.69 dex and varying from 5800 K to 6000 K. The corresponding average apparent distance moduli in and are mag, where the uncertainties take into account both the observational error and the intrinsic dispersion of the moduli obtained from the models shown in Figs. 14 and 15. By correcting the obtained apparent moduli for the extinction in the two bands (adopting for IZw18 a foreground Galactic extinction =0.032 mag, consistent with Aloisi et al. 2007 and Fiorentino et al. 2010), we find mag, again in very good agreement with the distance modulus derived from the TRGB method ( mag).
As for the intrinsic stellar parameters inferred from the model fitting technique, we note that the mass and luminosity estimated for V6 are consistent with the evolutionary values obtained in Fiorentino et al. (2010). According to the canonical ML relation adopted in this paper for a stellar luminosity dex, we expect a stellar mass in the range from 6.0 to 6.5 . Slightly smaller masses (down to 5.8 ) can also been accepted, when invoking a moderate overshooting (0.25 dex). On the other hand, stellar masses larger than 6.5 seem to be excluded for the quoted luminosity level, at least on the basis of current stellar evolution models. Taking into account that the pulsation best fit model which minimizes the residuals between predicted and observed light curves both in and in bands, corresponds to a 6.5 with dex, that is very close to the canonical ML relation, we may conclude that the light-curve model fitting of V6 favours the canonical evolutionary scenario.
7 Conclusions
We updated our theoretical scenario for Classical Cepheids extending it to the ultra-low metallicity composition of the blue compact galaxy IZw18, i.e. Z=0.0004. On the basis of these new models, we have derived and listed the coefficients for the key Cepheid relations (namely PLC, Wesenheit and synthetic PL relations) at Z=0.0004.
In addition, we find that:
-
1.
The predicted IS topology confirms our previous results on its dependence on the ML relation and assumed mixing-length parameter.
-
2.
The IS at Z=0.0004 is marginally bluer than that at Z=0.004. The small sensitivity to metallicity in this low Z regime leads to a leveling off of the metallicity effect on the synthetic PL relations.
-
3.
The predicted bolometric light curves show the already known dependence on effective temperature and mixing-length parameter. For bump Cepheid models the transition from light curves with the bump on the decreasing branch to light curves with the bump on the increasing branch occurs at a pulsation period of about 13 days. This value is significantly longer than both observed (Moskalik, Buchler, & Marom 1992; Moskalik et al. 2000; Beaulieu 1998) and predicted periods (Bono, Marconi, & Stellingwerf 2000) at the center of the HP () for Galactic, LMC and SMC bump Cepheids. This occurrence confirms the predicted and observed trend of with metallicity (see also Marconi, Musella, & Fiorentino 2005).
-
4.
The synthetic PL relations for Z=0.0004 are more linear and steeper than those obtained at higher Z, but very similar to the Z=0.004 ones, at periods longer than about 10 days. The difference in absolute magnitude between the predicted PL at Z=0.0004 and Z=0.004 is lower than 0.1 mag for periods between about 8 and 70 days. This result indicates a significant reduction of the metallicity effect on the Cepheid PL relations for , thus supporting recent observational evidence of the universality of the PL slope in galaxies with metallicities significantly lower than in the LMC (see e.g. Pietrzynski et al. 2006, 2007).
-
5.
The application to the IZw18 Cepheid V6 of the Wesenheit relations derived with both canonical and noncanonical assumptions, provides two distance moduli consistent within the uncertainties with each other and with the distance to the galaxy inferred from the TRGB method.
-
6.
Also the model fitting of the light curves of V6 provides a distance modulus in good agreement with the TRGB distance.
-
7.
The intrinsic stellar properties obtained from the model fitting of V6 are consistent with the evolutionary estimates based on current sets of stellar models slightly favouring the canonical scenario.
Finally, we notice that, further observations of Cepheids in very metal poor galaxies are needed in order to clarify the nature of the very long period candidates discovered in IZw18. If they were confirmed to be the extension of Classical Cepheids to higher masses, they would provide key constraints on pulsation models of massive stars.
References
- Alibert et al. (1999) Alibert, Y., Baraffe, I., Hauschildt, P., Allard, F. 1999, A&A, 344, 551
- Aloisi et al. (2007) Aloisi, A., et al. 2007, ApJ, 667, 151
- Beaulieu (1998) Beaulieu J.P., 1998, Mem. Soc. Astron. Italiana 69, 21
- Benedict et al. (2007) Benedict, G. F. et al., 2007, AJ, 133, 1810
- Bono et al. (1997) Bono, G., Caputo, F., Castellani, V., Marconi, M. 1997, A&AS, 121, 327
- Bono et al. (1999) Bono, G., Caputo, F., Castellani, V., Marconi, M. 1999, ApJ, 512, 711
- Bono et al. (2008) Bono, G., Caputo, F., Fiorentino, G., Marconi, M., Musella, I. 2008, ApJ, 684, 102
- Bono et al. (2001) Bono, G., Gieren, W.P., Marconi, M., Fouqu/’e, P. 2001, ApJL, 552, 141
- Bono, Castellani, & Marconi (2002) Bono, G., Castellani, V., & Marconi, M. 2002, ApJ Letters, 565, 83
- Bono et al. (2002) Bono, G., Groenewegen, M.A.T., Marconi, M., Caputo, F., 2002, ApJL, 574, 33
- Bono, Marconi, & Stellingwerf (1999) Bono, G., Marconi, M., Stellingwerf, R.F. 1999, ApJS, 122, 167
- Bono, Marconi, & Stellingwerf (2000) Bono, G., Marconi, M., Stellingwerf, R.F. 2000, A&A, 360, 245
- Bono & Stellingwerf (1994) Bono, G., Stellingwerf, R.F. 1994, ApJS, 93, 233
- Caputo et al. (2004) Caputo, F., Castellani, V., Degl’Innocenti, S., Fiorentino, G., Marconi, M. 2004, A&A, 424, 927
- Caputo, Marconi, & Musella (2000) Caputo, F., Marconi, M., Musella, I. 2000, A&A, 354, 610
- Castelli, Gratton, & Kurucz (1997a) Castelli, F., Gratton, R. G., & Kurucz, R. L. 1997a, A&A, 318, 841
- Castelli, Gratton, & Kurucz (1997b) Castelli, F., Gratton, R. G., & Kurucz, R. L. 1997b, A&A, 324, 432
- Castellani et al. (2003) Castellani, V., Degl’Innocenti, S., Marconi, M., Prada Moroni, P.G., Sestito, P. 2003, A&A, 404, 645
- Cariulo, Degl’Innocenti, & Castellani (2004) Cariulo, P., Degl’Innocenti, S., Castellani, V. 2004, A&A, 421, 1121
- Chiosi, Wood, & Capitanio (1993) Chiosi, C., Wood, P. R., Capitanio, N. 1993, ApJS, 86, 541
- Díaz et al. (2000) Díaz, A. I., Castellanos, M., Terlevich, E., Luisa García-Vargas, M. 2000, MNRAS, 318, 462
- Di Criscienzo, Marconi, & Caputo (2004) Di Criscienzo, M., Marconi, M., Caputo, F. 2004, ApJ, 612, 1092
- Fiorentino et al. (2002) Fiorentino, G., Caputo, F., Marconi, M., Musella, I. 2002, ApJ, 576, 402
- Fiorentino et al. (2010) Fiorentino, G., et al. 2010, ApJ, accepted
- Fiorentino et al. (2007) Fiorentino, G., Marconi, M., Musella, I., Caputo, F. 2007, A&A, 476, 863
- Fouqué et al. (2007) Fouqué, P. et al. 2007, A&A, 476, 73
- Freedman et al. (2001) Freedman, W. L. et al. 2001, ApJ, 553, 4
- Gieren et al. (2008) Gieren, W. et al. 2008, ApJ, 683, 611
- Groenewegen et al. (2004) Groenewegen, M. A. T., Romaniello, M., Primas, F., Mottini, M. 2004, A&A, 420, 655
- Hertzsprung (1926) Hertzsprung E., 1926, Bull. astronom. Inst. Netherl. 3, 115
- Kanbur et al. (2003) Kanbur, S. M., Ngeow, C., Nikolaev, S., Tanvir, N. R., Hendry, M. A. 2003, A&A, 411, 361
- Keller & Wood (2002) Keller, S.C., & Wood, P.R. 2002, ApJ, 642, 834
- Keller & Wood (2006) Keller, S.C., & Wood, P.R. 2006, ApJ, 578, 144
- Kennicutt et al. (1998) Kennicutt, R. C. Jr, et al. 1998, ApJ, 498, 181
- Ledoux & Walraven (1958) Ledoux P., Walraven Th., 1958, in: Handbuch der Physik 51, 353
- Macri et al. (2006) Macri, L. M., Stanek, K. Z., Bersier, D., Greenhill, L. J., Reid, M. J. 2006, ApJ, 652, 1133
- Magrini et al. (2007) Magrini, L., Corbelli, E., Galli, D. 2007, A&A, 470, 843
- Marconi, Caputo, Di Criscienzo, & Castellani (2003) Marconi, M., Caputo, F., Di Criscienzo, M., Castellani, M. 2003, ApJ, 596, 299
- Marconi, Fiorentino, & Caputo (2004) Marconi, M., Fiorentino, G., Caputo, F. 2004, A&A, 417, 1101
- Marconi, Musella, & Fiorentino (2005) Marconi, M., Musella, I., Fiorentino, G. 2005, ApJ, 632, 590
- Moskalik, Buchler, & Marom (1992) Moskalik P., Buchler R., Marom A., 1992, ApJ 385, 685
- Moskalik et al. (2000) Moskalik P., Krzyt T., Gorynya N.A., Samus N.N., 2000, in: Szabados L., Kurtz D. (eds.), The Impact of Large-Scale Surveys on Pulsating Star Research, IAU Coll. 176, San Francisco: ASPC, 203, 233
- Natale, Marconi, & Bono (2008) Natale, G., Marconi, M., Bono, G., 2008, ApJ Letters 674, 93
- Ngeow, Kanbur & Nanthakumar (2008) Ngeow, C., Kanbur, S. M., Nanthakumar, A., 2008, A&A, 477, 621
- Pietrzynski et al. (2006) Pietrzynski, G. et al. 2006, ApJ, 642, 216
- Pietrzynski et al. (2007) Pietrzynski, G. et al. 2007,
- Riess et al. (2009) Riess, A.G., et al. 2009, ApJS, 183, 109
- Rizzi et al. (2007) Rizzi, L. et al. 2007, ApJ, 661, 815
- Romaniello et al. (2005) Romaniello, M., Primas, F., Mottini, M., Groenewegen, M.A.T., Bono, G., François, P. 2005, A&A, 429, 37
- Romaniello et al. (2008) Romaniello, M., Primas, F., Mottini, M., Pedicelli, S., Lemasle, B., Bono, G., François, P., Groenewegen, M.A.T., Laney, C.D. 2008, A&A, 488, 731
- Saha et al. (2001) Saha, A. et al. 2001, ApJ, 562, 314
- Saio & Gautschy (1998) Saio, H., Gautschy, A. 1998, ApJ, 498, 360
- Sakai et al. (2004) Sakai, S., Ferrarese, L., Kennicutt, R. C., Jr., Saha, A. 2004, ApJ, 608, 42
- Sandage, Bell, & Tripicco (1999) Sandage, A., Bell, R. A., Tripicco, M. J. 1999, ApJ, 522, 250
- Sandage, Tammann, & Reindl (2004) Sandage, A., Tammann, G. A., Reindl, B. 2004, A&A, 424, 43
- Sandage, Tammann, & Reindl (2009) Sandage, A., Tammann, G. A., Reindl, B. 2009, A&A, 493, 471
- Scowcroft et al. (2009) Scowcroft, V., Bersier D., Mould J. R., Wood P.R., 2009, MNRAS, in press.
- Storm et al. (2004) Storm, J., Carney, B. W., Gieren, W. P. et al., 2004, A&A, 415, 531
- Sasselov et al. (1997) Sasselov, D. D., et al., 1997, A&A, 324, 471
- Wood, Arnold, & Sebo (1997) Wood, P. R., Arnold, A., Sebo, K. M., 1997, ApJ, 485, 25
| 4.0 | 3.07 | 6250 | 5450 |
|---|---|---|---|
| 4.0 | 3.32 | 6150 | 5250 |
| 5.0 | 3.37 | 6050 | 5250 |
| 5.0 | 3.62 | 6050 | 5050 |
| 7.0 | 3.84 | 5950 | 4950 |
| 7.0 | 4.09 | 5850 | 4650 |
| 9.0 | 4.16 | 5850 | 4750 |
| 9.0 | 4.41 | 5850 | 4650 |
| 11.0 | 4.42 | 5750 | 4750 |
| 11.0 | 4.67 | 5750 | 4900 |
| 13.0 | 4.65 | 5650 | 4550 |
| 4.0 | 3.07 | 6450 | 6050 |
|---|---|---|---|
| 4.0 | 3.32 | 6250 | 5650 |
| 4.5 | 3.50 | 6050 | 5750 |
| 5.0 | 3.37 | 6250 | 6050 |
| 7.0 | 3.84 | 5850 | 5650 |
| 4.0 | 3.07 | 6200 | 0.4758 | 2.8917 | 0.3132 | 0.2372 | 0.5276 | 0.8947 | 1.2327 |
| 4.0 | 3.07 | 6100 | 0.5001 | 2.8826 | 0.3465 | 0.2553 | 0.5615 | 0.9466 | 1.3010 |
| 4.0 | 3.07 | 6000 | 0.5244 | 2.8713 | 0.3855 | 0.2751 | 0.5975 | 0.9998 | 1.3699 |
| 4.0 | 3.07 | 5900 | 0.5494 | 2.8559 | 0.4273 | 0.2954 | 0.6343 | 1.0539 | 1.4405 |
| 4.0 | 3.07 | 5800 | 0.5752 | 2.8389 | 0.4631 | 0.3142 | 0.6691 | 1.1060 | 1.5096 |
| 4.0 | 3.07 | 5700 | 0.6010 | 2.8224 | 0.4935 | 0.3303 | 0.6992 | 1.1527 | 1.5735 |
| 4.0 | 3.07 | 5600 | 0.6268 | 2.8071 | 0.5213 | 0.3446 | 0.7260 | 1.1951 | 1.6318 |
| 4.0 | 3.07 | 5500 | 0.6529 | 2.7928 | 0.5472 | 0.3577 | 0.7504 | 1.2337 | 1.6847 |
| 4.0 | 3.32 | 6100 | 0.7133 | 3.5142 | 0.3498 | 0.2550 | 0.5593 | 0.9389 | 1.2845 |
| 4.0 | 3.32 | 6000 | 0.7386 | 3.4995 | 0.3887 | 0.2749 | 0.5959 | 0.9939 | 1.3579 |
| 4.0 | 3.32 | 5900 | 0.7650 | 3.4831 | 0.4286 | 0.2952 | 0.6332 | 1.0497 | 1.4321 |
| 4.0 | 3.32 | 5800 | 0.7916 | 3.4650 | 0.4644 | 0.3144 | 0.6691 | 1.1042 | 1.5053 |
| 4.0 | 3.32 | 5700 | 0.8184 | 3.4467 | 0.4979 | 0.3321 | 0.7022 | 1.1561 | 1.5764 |
| 4.0 | 3.32 | 5600 | 0.8460 | 3.4285 | 0.5289 | 0.3482 | 0.7328 | 1.2056 | 1.6455 |
| 4.0 | 3.32 | 5500 | 0.8750 | 3.4122 | 0.5565 | 0.3623 | 0.7593 | 1.2484 | 1.7055 |
| 4.0 | 3.32 | 5400 | 0.9050 | 3.3901 | 0.5908 | 0.3792 | 0.7919 | 1.3036 | 1.7860 |
| 4.0 | 3.32 | 5300 | 0.9302 | 3.3703 | 0.6199 | 0.3931 | 0.8192 | 1.3508 | 1.8556 |
| 5.0 | 3.37 | 5900 | 0.7413 | 3.6163 | 0.4183 | 0.2918 | 0.6283 | 1.0460 | 1.4316 |
A portion of Table 3 is shown here for guidance regarding its form and content. The entire catalog is available in the electronic edition of the journal.
| 4.0 | 3.07 | 6400 | 0.2975 | 2.9293 | 0.2826 | 0.2123 | 0.4747 | 0.7993 | 1.0811 |
|---|---|---|---|---|---|---|---|---|---|
| 4.0 | 3.07 | 6300 | 0.3194 | 2.9170 | 0.3092 | 0.2282 | 0.5053 | 0.8478 | 1.1494 |
| 4.0 | 3.07 | 6200 | 0.3424 | 2.9049 | 0.3440 | 0.2463 | 0.5389 | 0.8982 | 1.2171 |
| 4.0 | 3.07 | 6100 | 0.3667 | 2.8907 | 0.3774 | 0.2644 | 0.5728 | 0.9492 | 1.2856 |
| 4.0 | 3.32 | 6200 | 0.5470 | 3.5317 | 0.3553 | 0.2504 | 0.5448 | 0.9005 | 1.2123 |
| 4.0 | 3.32 | 6100 | 0.5712 | 3.5150 | 0.3670 | 0.2614 | 0.5688 | 0.9473 | 1.2879 |
| 4.0 | 3.32 | 6000 | 0.5971 | 3.4979 | 0.4000 | 0.2798 | 0.6038 | 1.0025 | 1.3651 |
| 4.0 | 3.32 | 5900 | 0.6203 | 3.4808 | 0.4359 | 0.2988 | 0.6394 | 1.0573 | 1.4399 |
| 4.0 | 3.32 | 5800 | 0.6449 | 3.4629 | 0.4685 | 0.3166 | 0.6730 | 1.1097 | 1.5121 |
| 4.0 | 3.32 | 5700 | 0.6695 | 3.4453 | 0.4992 | 0.3330 | 0.7038 | 1.1590 | 1.5807 |
| 4.5 | 3.50 | 6000 | 0.7110 | 3.9494 | 0.4022 | 0.2801 | 0.6038 | 1.0010 | 1.3611 |
| 4.5 | 3.50 | 5800 | 0.7585 | 3.9127 | 0.4683 | 0.3167 | 0.6733 | 1.1109 | 1.5147 |
| 5.0 | 3.37 | 6200 | 0.5305 | 3.6643 | 0.3470 | 0.2466 | 0.5385 | 0.8953 | 1.2104 |
| 5.0 | 3.37 | 6100 | 0.5538 | 3.6490 | 0.3732 | 0.2625 | 0.5697 | 0.9463 | 1.2837 |
| 7.0 | 3.84 | 5800 | 0.9198 | 4.7600 | 0.4640 | 0.3148 | 0.6703 | 1.1083 | 1.5134 |
| 7.0 | 3.84 | 5700 | 0.9439 | 4.7437 | 0.4986 | 0.3331 | 0.7048 | 1.1628 | 1.5889 |
| B-V | 2.28 | 3.78 | 3.47 | 0.90 | 0.03 |
|---|---|---|---|---|---|
| 0.01 | 0.01 | 0.04 | 0.03 | ||
| V-R | 3.03 | 3.79 | 7.50 | 0.92 | 0.05 |
| 0.05 | 0.02 | 0.12 | 0.04 | ||
| V-I | 3.35 | 3.81 | 4.00 | 0.93 | 0.05 |
| 0.05 | 0.02 | 0.06 | 0.04 | ||
| V-J | 3.42 | 3.82 | 2.49 | 0.95 | 0.04 |
| 0.04 | 0.02 | 0.04 | 0.04 | ||
| V-K | 3.36 | 3.84 | 1.79 | 0.97 | 0.05 |
| 0.05 | 0.02 | 0.03 | 0.04 |
| Wesenheit function | ||||
|---|---|---|---|---|
| 2.17 | 3.69 | 0.88 | 0.05 | |
| 0.01 | 0.04 | |||
| 2.74 | 3.66 | 0.88 | 0.07 | |
| 0.02 | 0.06 | |||
| 2.58 | 3.49 | 0.84 | 0.12 | |
| 0.12 | 0.03 | 0.10 | ||
| 2.46 | 3.43 | 0.84 | 0.14 | |
| 0.14 | 0.03 | 0.12 | ||
| 2.58 | 3.51 | 0.87 | 0.12 | |
| 0.12 | 0.03 | 0.10 |
| Magnitude | |||
|---|---|---|---|
| 0.76 | 2.81 | 0.28 | |
| 0.02 | 0.02 | ||
| 1.10 | 3.04 | 0.22 | |
| 0.02 | 0.02 | ||
| 1.36 | 3.14 | 0.18 | |
| 0.01 | 0.01 | ||
| 1.67 | 3.24 | 0.16 | |
| 0.01 | 0.01 | ||
| 2.03 | 3.37 | 0.12 | |
| 0.01 | 0.01 | ||
| 2.36 | 3.50 | 0.07 | |
| 0.01 | 0.01 |
| Magnitude | |||
|---|---|---|---|
| 0.97 | 2.80 | 0.19 | |
| 0.02 | 0.02 | ||
| 1.27 | 3.03 | 0.16 | |
| 0.02 | 0.02 | ||
| 1.51 | 3.13 | 0.15 | |
| 0.02 | 0.02 | ||
| 1.79 | 3.23 | 0.14 | |
| 0.01 | 0.01 | ||
| 2.12 | 3.36 | 0.12 | |
| 0.01 | 0.01 | ||
| 2.43 | 3.48 | 0.10 | |
| 0.01 | 0.01 |
| Magnitude | |||
|---|---|---|---|
| 1.01 | 2.54 | 0.36 | |
| 0.04 | 0.04 | ||
| 1.22 | 2.85 | 0.27 | |
| 0.02 | 0.02 | ||
| 1.42 | 2.98 | 0.23 | |
| 0.02 | 0.02 | ||
| 1.68 | 3.10 | 0.20 | |
| 0.02 | 0.02 | ||
| 1.98 | 3.25 | 0.14 | |
| 0.02 | 0.02 | ||
| 2.26 | 3.40 | 0.09 | |
| 0.01 | 0.01 |