Signatures of pressure induced superconductivity in insulating Bi2212
Abstract
We have performed several high pressure electrical resistance experiments on Bi1.98Sr2.06Y0.68Cu2O8+δ, an insulating parent compound of the high-Tc Bi2212 family of copper oxide superconductors. We find a resistive anomaly, a downturn at low temperature, that onsets with applied pressure in the 20-40 kbar range. Through both resistance and magnetoresistance measurements, we identify this anomaly as a signature of induced superconductivity. Resistance to higher pressures decreases Tc, giving a maximum of 10 K. The higher pressure measurements exhibit a strong sensitivity to the hydrostaticity of the pressure environment. We make comparisons to the pressure induced superconductivity now ubiquitous in the iron arsenides.
pacs:
I Introduction
The recently discovered class of iron arsenide superconductors have been compared to the high-Tc copper-oxide superconductors based on the proximity of the superconducting dome to an antiferromagnetic phase in the doping phase diagram and the planar-like sheets in which the superconductivity lies.Rotter In both classes of high-Tc families, the phase diagram exhibits a large range of structural, charge, and magnetic instabilities that manifest themselves more strongly in one specific compound or at a particular doping than another. Given the complexities of understanding how physical parameters are changed by chemical doping, pressure has been sought as a laboratory controlled variable to tune a single parent compound accross the phase diagram. In the iron arsenide compounds, pressure induced superconductivity has already been found in CaFe2As2,CaFeAs BaFe2As2,Alireza SrFe2As2,Alireza and LaFeAsO.LaFeAsO The pressure induced superconductivity appears as the tetragonal to orthorhombic structural transition temperature is lowered and the associated spin and charge density wave transitions weaken.SrFeAs In the cuprates, by contrast, pressure induced superconductivity of the parent, or weakly doped, compounds has not been found.
Similar to the iron arsenide compounds, there are several mechanisms by which pressure could induce metallicity in the cuprate parent insulators. By decreasing the Cu-O bond distance, the Cud-Op hybridization increases and the Cud-band further delocalizes. Secondly, the relatively higher c-axis compressibility facilitates electron or hole doping by bringing the chemically substituted charge resevoir layers closer to the Cu-O plane.Murayama Preferred compression along the layered c-axis also increases the interlayer tunneling matrix element (t).Forro ; Crommie Finally, contraction of the lattice changes electron-electron and electron-phonon interactions by varying both electron screening and crystal fields.Chen
Past pressure experiments on superconducting Bi2Sr2CaCu2O8 have indeed shown significant increase of Tc on the underdoped side of the superconducting dome,Chen attributed to a pressure-induced doping as inferred from Hall effect measurements.Murayama However, pressure leads to higher Tc’s for even overdoped Bi2212 compounds, which suggests that the strength of the Cooper-pair coupling also changes.Chen Similar results are found for YBa2Cu3O7.Jorgensen ; Schilling ; Murayama ; Tozer The sensitivity of the c-axis resistivity in Bi2Sr2(Ca,Y)Cu2O8 and YBa2Cu3O7 to uniaxial pressure has been attributed to increased interlayer tunneling t.Forro ; Crommie
Recently, pressure has tuned insulating Bi2212 accross an electronic transition seen by Raman spectroscopy at high (200 kbar) pressures.Cuk The electronic transition coincides with a change in the behavior of the magnons, the phonons, and the c/a lattice constant ratio. So far, however, pressure induced superconductivity has not been reported in a parent cuprate compound. In this work, we study the effect of pressure on insulating Bi2212 in resistance measurements using two different Bridgman anvil cell setups and a diamond anvil cell. We identify a broad downturn at 8-10 K occuring at 30 kbar, as a signature of induced superconductivity. In all three experiments, the resistive downturn indicative of superconductivity is observed to have an onset in the 20-40 kbar range. However, the high pressure range (above 40 kbar) differs due to the variations in hydrostaticity. A higher c-axis stress is correlated with a more extended range of induced superconductivity and an enhanced metallic behavior. Finally, we compare these results to the pressure induced superconductivity seen in the iron arsenides.
II Experimental Details
Single crystals of Bi1.98Sr2.06Y0.68Cu2O8+δ (Bi2212) were grown by the floating zone method, and have a doping dependence of Tc described by Maeda Maeda and Terasaki.Terasaki Given the sensitivity of these samples to the hydrostaticity of the pressure environment, we report results using three different pressure configurations. In the first, a sample of 10.250.025 mm3 was loaded in a beryllium-copper Bridgman-anvil clamped cell (BAC1) using solid steatite as the quasihydrostatic pressure transmitting medium. The pressure was determined from the superconducting transition of a strip of Pb foil placed adjacent to the sample. Electrical resistivity was measured with a standard four point technique and a LR-700 AC resistance bridge, using four flattened 50 micron platinum wires for each the sample and the Pb. Silver pads of DuPont 7095 silver paste were made in order to achieve better electrical contacts. This was the most hydrostatic configuration achieved. In the second configuration, a sample of 0.80.20.02 mm3 (LWH) was also loaded into a Bridgman anvil cell (BAC2) next to a Pb manometer. Calcium sulphate powder served as a transparent pressure medium instead. The electrical contacts for the sample and Pb manometer were obtained as in the BAC1 experiment. The magnetoresistance measurements reported for BAC2 were preformed with a Quantum Design Physical Property Measurement System (PPMS) instrument. In BAC2, we report results from the two point measurements alone due to complications with a non-homogeneous pressure environment. The width of the Pb transition is a measure of pressure inhomogeneity along the Pb manometer: 2 kbar in BAC1 and 5 kbar in BAC2. In the third configuration, the samples were loaded into a Diamond Anvil Cell (DAC) with argon gas as the pressure transmitting medium. The 0.030.030.005 mm3 Bi2212 samples were glued onto one of the diamond anvils and Pt leads were, with a Focus Ion Beam, milled directly onto the top and side surfaces of the sample in a four-point configuration and then extended along the diamond to meet the gasket leads. The gasket was made of a boron nitride/epoxy mixture and ruby chips served as pressure markers. In the DAC, measurements of ruby chips placed at opposite ends of the sample estimate the degree of non-hydrostaticity/ c-axis uniaxial pressure to be 20 kbar at the highest pressures. In all experimental configurations, pressure was increased at room temperature; pressure values were recorded at low temperature since the pressure remains almost constant below 100K.
From BAC1 to BAC2 to the DAC experiments, the degree of non-hydrostaticity/ c-axis uniaxial stress, increases. The contact configuation and pressure medium determine the level of hydrostaticity.Lee In BAC1, steatite and thin Pt wires are used as opposed to the less hydrostatic calcium sulphate and thicker Pt wires in BAC2. In the DAC experiments, while argon can be more hydrostatic than a solid powder medium in the lower pressure ranges, it solidifies at the measured temperatures and pressures (below 80 K at ambient pressure). revsciinst ; jappcryst Moreover, in the DAC experiments, the sample is glued to the diamond surface on which the Pt leads are milled; only one side of the sample sees the quasi-hydrostatic medium. The pressure gradients measured via Ruby fluorescence measurements in the DAC (20 kbar), and the width of the Pb superconduting transtion in BAC1 (2 kbar) and BAC2 (5 kbar) corroborate these assessments.
III Results
Figure 1 shows the temperature dependent resistance of the sample loaded in BAC1 at different pressures. By 15 kbar, the insulating characteristic of the unpressurized sample has become a downturn below 8 K of 50 . With increasing pressure, the Tc of the downturn lowers and the magnitude decreases (see inset). By 36 kbar, the Tc decreases to 2 K, and by 40 kbar, the sample is completely insulating to 1.8 K. Above 8 K, the insulating rise initially decreases with pressure, indicating a more metallic sample, but increases significantly beyond 30 kbar along with the overall resistance.
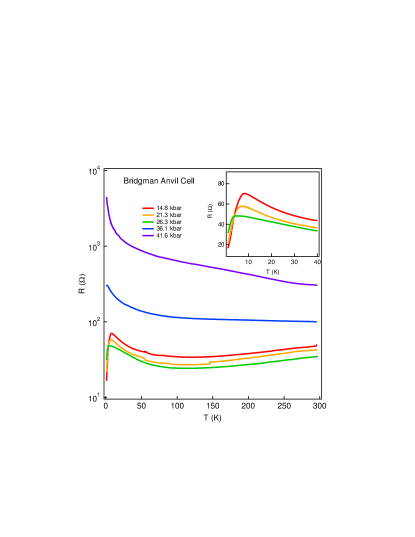
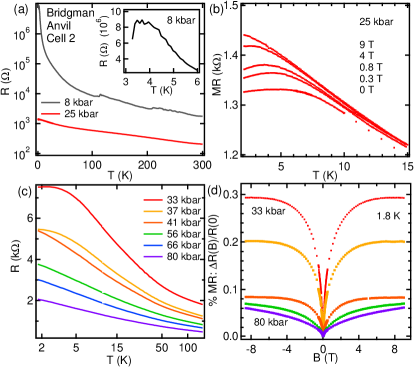
Figure 2 shows the temperature dependent resistance and magnetoresistance of the sample loaded in BAC2 at different pressures. In Fig. 2a, the resistance decreases by four orders of magnitude between 8 kbar and 25 kbar. Though not as pronounced as in BAC1, the insulating characteristic becomes a downturn at low temperatures—most pronounced at 25 kbar (Fig. 2b) but also apparent at 8 kbar (see inset to Fig. 2a). In these experiments, we applied a magnetic field and found that the resistive anomaly was almost totally suppressed with an applied field of 9 T (Fig. 2b). We use this positive magnetoresistance (increasing resistance with applied magnetic field) as another measure of the induced superconductivity. Since the magnon peak is not suppressed in this pressure range, as seen earlier by pressure dependent Raman studies,Cuk the positive magnetoresistance cannot be attributed to a suppression of short range antiferromagnetic order.LongAF We show sweeps in magnetic field for several pressures at 1.8 K in Fig. 2d. The largest magnetoresistance is observed in the range of 30 kbar and decreases significantly beyond 40 kbar. Like in BAC1, then, the induced signatures of superconductivity disappear with continued increase in pressure. The high magnetoresistance occurs for those pressures that show either a flattening or a downturn of the resistance at low temperatures (Fig. 2c). Further increase in pressure continues to make the sample more metallic (Fig. 2c) and in contrast to BAC1, continues to become increasingly more metallic up to 80 kbar. Beyond 50 kbar, we find a - ln T(K) dependence over two decades in temperature. This same characteristic is prominent in Bi2201 samples near the dome Ong1 and when superconductivity is suppressed by the application of a magnetic field in Bi2201.Ono

In both BAC1 and BAC2, the strongest signatures of superconductivity occur below 40 kbar. In Fig. 3a, we graph Tc vs pressure for both cells. Tc is determined by the temperature at which the high temperature slope diverges from the low temperature behavior. Even at 8 kbar we find a downturn at 4 K, which suggests that as with the pressure induced superconductivity in the iron pnictides, Tc traces a dome with pressure.Lee ; Takahashi ; Diego2 ; Hamlin In the region beyond 40 kbar, the results in BAC1 and BAC2 differ substantially: in BAC1, we observe the return of an insulating state, whereas in BAC2, we find resistance curves similar to those of doped samples near the dome.
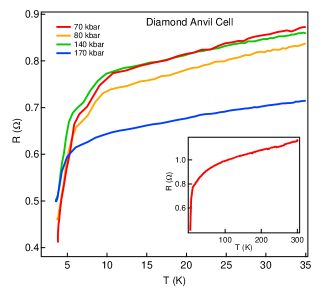
Finally, in Figure 4, we show the results from the DAC experiments. In the DAC we were unable to reach pressures lower than 70 kbar without releasing the gas medium. From 70 to 140 kbar, we find a downturn again indicating induced superconductivity. With pressure, the downturn moves from 10 K to lower temperatures, reaching 5 K by 170 kbar. Similar to the BAC results, beyond a certain pressure, the superconducting signature diminishes. However, in strong contrast to the BAC results, the superconducting signature extends to 170 kbar where in the BAC it ends at 50 kbar. In further contrast to the BAC results, above 10 K, the sample is purely metallic up to 300 K (see inset) and through the highest measured pressures. We attribute this metallic behaviour and extended superconductivity to the higher c-axis stress in the DAC: greater than in the BAC due to both the solid Argon pressure medium at low temperatures and the milled Pt wires (see experimental section). As discussed in the introduction, a higher c-axis stress can lead to enhanced metallic behaviour by bringing the charge resevoir layers closer to the Cu-O plane, enhancing interlayer tunneling, and changing electron-electron and electron-phonon interactions through the crystal field along the c-axis.
IV Discussion and Summary
We find a signature of superconductivity occuring in insulating Bi2212 between 20-40 kbar in the BAC experiments, extending to 170 kbar in the DAC. If one considers the parent copper oxide insulators as Mott insulators, such a low pressure onset of superconductivity is not expected. A classic Mott insulator such as MnO only reaches metallization at 100 GPa.MnO Therefore, these superconducting signatures are not likely the result of a Mott gap collapsing through simple hybridization of orbitals.
Even though superconductivity seems to onset at much lower pressures, Tc reaches at most 10 K. In the iron arsenide compounds, the Tc under pressure has been shown to reach 30 K,Alireza ; LaFeAsO ; SrFeAs2 approximately the Tc of the optimally doped parent compound at ambient pressure. In our experiments with Bi2212, Tc under pressure only reaches a fraction of the optimally doped value of 100 K. On the other hand, it is somewhat surprising that in both classes of high Tc superconductors, signatures of superconductivity can be seen in the form of broad resistance curves SrFeAs2 ; LaFeAsO by the same pressure of 30 kbar. One possible outlook is that the superconductivity taking place in the copper oxides with doping are of two forms: one that can be traced to lower pressures, and bearing similarity to the pressure induced superconductivity of the iron arsenides, and another higher Tc superconductivity that has only been accessed by doping so far. In the recent Raman spectroscopy experiments carried out in Bi2212 samples under pressure, it was possible to identify an electronic transition at 200 kbar with an anomaly occurring in the lattice constant ratio c/a.Cuk It is worth mentioning that a similar, though more dramatic, decrease occurs in c/a when CaFe2As2 enters the collapsed tetragonal state CaFeAs2 at much lower pressures.
It is unlikely that a more hydrostatic enviroment will induce a higher Tc in the cuprates. For the largest downturn and highest Tc measured in BAC1, the pressure gradients at 14 kbar approached 5 kbar (see Fig. 3) and only decreased at higher pressures where the superconductivity weakened. Moreover, we attempted the same experiments in hydrostatic piston cylinder cells and little change is observed up to 24 kbar. Such an observation is not unexpected: clear differences are observed for CePd2Si2 in which anvil cells report strong enhancement of Tc and a doubled pressure range in which the superconductivity occurs compared to piston-cylinder cells. Demuer Furthermore, comparisons with the iron arsenides also suggest that a more hydrostatic environment may not enhance Tc. CaFe2As2 does not become superconducting under ideal hydrostatic pressure conditions Lee and internal strain coming from c-axis orientated planar defects in SrFe2As2 promotes superconductivity. Saha
Instead, one option for future experiments is to apply a purely c-axis stress to see if a more robust superconductivity can be induced. In particular, since the c-axis has the highest compressibility and also has the highest applied stress in the current experimental setup, one can think of the distance between the Cu-O planes and the intervening charge resevoir layers as tuning four separate microscopic quantities: charge transfer and disorder (by bringing the dopants closer to the plane), interlayer tunnelling (decreasing t⊥), and increasing the crystal field across the Cu-O plane. Some of these effects, such as charge transfer and disorder or the crystal field and charge transfer, will compete to determine the induced superconductivity. It is an open question whether or not these competing effects can be controlled with a parameter other than doping to achieve the optimal Tc of the copper oxide family.
References
- (1) M. Rotter, M. Tegel, and D. Johrendt Phys. Rev. Lett. 101, 107006 (2008)
- (2) M.S. Torikachvili, S.L. Bud’ko, N. Ni, and P. C. Canfield Phys. Rev. Lett. 101, 057006 (2008)
- (3) P. L. Alireza et al. J. Phys.: Condens. Matter 21, 012208 (2009)
- (4) H. Okada et al. J. Phys. Soc. Japan, 77, 113712 (2008)
- (5) M.S. Torikachvili, S.L. Bud’ko, N. Ni, and P. C. Canfield Phys. Rev. B 78, 104527 (2008)
- (6) L. Forro, V. Ilakovac, and B. Keszei Phys. Rev. B 41, 9551 (1990)
- (7) M. F. Crommie et al. Phys. Rev. B 39, 4231(1989)
- (8) Xiao-Jia Chen, V. Struzhkin, R. J. Hemley, H. K. Mao, and C. Kendziora Phys. Rev. B 70, 214502 (2004)
- (9) C. Murayama et al. Physica C 183, 277 (1991)
- (10) J.D. Jorgensen et al. Physica C 171, 93 (1990)
- (11) S. Klotz, Reith, and J.S. Schilling Physica C 172, 423 (1991)
- (12) S.W. Tozer, J.L. Koston, and E. M. McCarron, III Phys. Rev. B 47, 8089 (1993)
- (13) T. Cuk et al. Phys. Rev. Lett. 100, 217003(2008)
- (14) A. Maeda et al. Phys. Rev. B 41, 6418 (1990)
- (15) I. Terasaki et al. Proceedings of the 12th Conference on Superconductivity cond-mat9911153v1 (1999)
- (16) H. Lee et al., Phys. Rev. B 80, 024519 (2009)
- (17) N. Tateiwa et al., Rev. Sci. Inst. 80, 123901 (2009)
- (18) R. J. Angel et al., J. Appl. Cryst. 40, 26 (2007)
- (19) Long range anti-ferromagnetic order has not yet been established in Bi2212 through neutron scattering.
- (20) T.W. Jing, N.P. Ong, R.V. Ramakrishnan, J.M. Tarascon, and K. Remschnig Phys. Rev. Lett 67, 761 (1991)
- (21) S. Ono et al. Phys. Rev. Lett. 85, 638 (2000)
- (22) H. Takahashi et. al Nature 453, 376 (2008)
- (23) D. A. Zocco et al. Physica C 468, 2229 (2008)
- (24) J. J. Hamlin et al. J. Phys: Condens. Matter 20, 365220 (2008)
- (25) C.S. Yoo et al. Phys. Rev. Lett. 94, 115502 (2005)
- (26) M. Kumar et al. Phys. Rev. B 78, 184516 (2008)
- (27) A.I. Goldman et al. Phys. Rev. B 79, 024513 (2009)
- (28) A. Demuer, A.T. Holmes, and D. Jaccard J. Phys: Condens. Matter 14, L529 (2002)
- (29) S. R. Saha et al., Phys. Rev. Lett. 103, 037005 (2009)
- (30) We would like to acknowledge helpful discussions with A. Kapitulnik, E. Gregoryanz, and A. Mackenzie. T. Cuk would like to thank the Royal Holloway, University of London for the use of facilities and access to pressure cells. T. Cuk would also like to thank the Carnegie Insitution of Washington for the use of facilities, and partial support of this work. The Stanford work was supported by DOE Office of Science, Division of Materials Science, with contract DE-FG03-01ER45929-A001 and NSF grant DMR-0304981. Research at University of California, San Diego was supported by the National Nuclear Security Administration under the Stewardship Science Academic Alliance Program through the U. S. Department of Energy Grant No. DEFG52-06NA26205.