The Multicolor “Lyra” Photometric System for Variable stars and Halo Studies
Abstract
The space photometric project ”Lyra” is developed now in Russia. The project purpose is determination of the photometric information and coordinates of the natural and artificial space objects, from the brightest ones to 16m in visual lights. It is supposed to obtain the data for about 40-400 million objects from board of International Space Station, using an astronomical telescope with diameter of the main mirror of 0.5 m. The observations will be carried out in a scanning mode. Photometry will be obtained in 10 spectral bands. The expected uncertainty of magnitudes for objects of 16m in the V-band is 0.001m.
The main results of experiment should become:
1) creation of spatial model of the Galaxy on distances to 3 kps
from the Sun;
2) specification of physical parametres of stars and models of star
evolution;
3) discovering of a huge number (to several millions) of variable stars
and determination of their variability parameters.
The Sternberg Astronomical Institute of the Moscow University is the director of experiment and the head scientific organisation. Launch of the apparatus into an orbit is planning for 2013.
The central wavelengths of the 10 bands of ”Lyra” photometric system will be at 195, 218, 270, 350, 440, 550, 700, 825, 930 and 1000 nm. It is shown that combinations of various colour indices will allow to determine confidently both effective temperature and metallicity of stars. The presence of a 218 nm band allows to determine confidently interstellar extinction on stars of O F spectral classes. The photometric system will make it possible to separate galo stars from disk stars and to define physical parameters of their atmospheres
The scanning law is that objects will be observed on the average on 100 times each. It will give the chance to discover variables and to determine their characteristics.
autadxandAuthor Index
1Sternberg Astronomical Institute, Moscow, Russia
1. Introduction
The space experiment Lyra is now being prepared in Russia. The main goal of the experiment is to perform multicolor photometry for all stars. The telescope will be mounted on the Russian segment of the International Space Station.
We are planning:
-
•
to make multicolor photometric catalogs for 100-400 million objects of ;
-
•
to scan repeatedly all sky during 3 5 years (usually 20 times per year);
-
•
to use 10 bands from 190 to 1000 nm;
-
•
to reach high precision and high accuracy of photometry for stars 3m – 16m;
-
•
to create an extensive uniform system of photometric standards;
-
•
to measure coordinates of all objects of with uncertainties within 1 mas and of all other objects with uncertainties within 10 mas.
Photometric system “Lyra” should be able to obtain basic physical parameters of stars and interstellar matter.
The schedule of the“Lyra” experiment are:
| Designing and equipment manufacturing | 2008 – 2013 |
|---|---|
| Performing the experiment | |
| Preprocessing | 2013 – 2017 |
| A preliminary catalogue | |
| Finishing processing | 2017 – 2020 |
| The final catalogue |
2. The principles of the experiment
The main principles of the experiment are
-
•
Scanning mode of observations;
-
•
Time delay and integration (drift) mode;
-
•
10-band photometry;
-
•
Full coverage of the sky.
The optical scheme is classical Ritchey-Chrétien with a lens corrector from fused quartz. Main mirror diameter is 50 cm; focal distance - 3 m. Both mirrors shall be made from silicon carbide.
The orbital period of the ISS is 92 min. One of station axis always directed to Earth center. Unmovable telescope is fastened on the board of ISS. The vizier axis is directed away from the Earth. During every revolution round the Earth, the field of telescope’s view covers a ring stripe on the sky. The orbit inclination is equal 51.6 . Precession shifts the stripe for one third of a degree in every pass of the orbit. Precession period is about 70 days.
If the vizier line lies in orbit plane, then, for one precession period, we cover a large band in the sky along the equator between -52 and +52 (equator mode). To reach polar regions, we must incline the axes of sight to the angle supplementary to orbit inclination (polar mode).
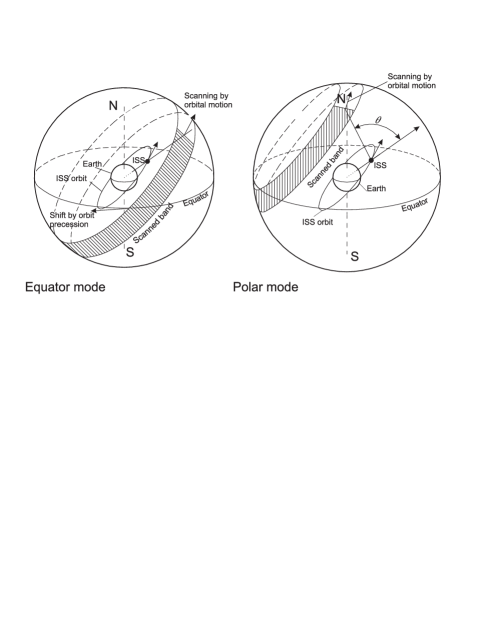
A choice between the two modes will depend on the position of the Sun.
The linear size of the corrected field of view will be about 78 millimeters, which corresponds to 1.5 degrees. 22 CCD matrices connected in pairs will be installed in the focal plane. The first pair (matrix 1 and 2) are uncovered by any filters, but they are coated with antireflective coating. The remaining 10 pairs of matrices will be covered by the interference coating so as to create 10 different photometric bands in the spectral range 200 - 1000 nm. During scanning the sky the stars will pass sequentially through all the matrices and recorded in TDI mode. Rocking and shaking station, distorting the trajectory of the star image in the focal plane will be tracked with six support matrix surrounding the field of main photometer.

3. “Lyra” photometric system
The position and half-width of the proposed photometric bands are given in the Table. In the same table gives the score of the brightest and most objects that can be measured with an error of magnitude 0.1 or 0.01.
| Most faint (mag) | |||||
|---|---|---|---|---|---|
| Most bright | for 1 observation | for all mission | |||
| (nm) | (nm) | (mag) | |||
| 195 | 20 | 6,0 | 9,0 | 13,6 | 13,7 |
| 218 | 20 | 6.0 | 8,9 | 13,6 | 13,6 |
| 270 | 25 | 6,2 | 9,2 | 13,8 | 13,9 |
| 350 | 50 | 7,6 | 10,5 | 15,1 | 15,2 |
| 440 | 100 | 8,8 | 12,5 | 16,9 | 17,0 |
| 550 | 80 | 8,0 | 11,7 | 16,1 | 16,2 |
| 700 | 80 | 6,6 | 10,7 | 15,0 | 15,1 |
| 825 | 80 | 5,6 | 9,7 | 14,0 | 14,1 |
| 930 | 80 | 4,3 | 8,7 | 12,9 | 12,9 |
| 1000 | 100 | 3,3 | 7,7 | 11,9 | 12,0 |
For the brightest objects a special mode will be applied.
4. What can the results of the ”Lyra” experiment give for variable stars and Halo studies?
4.1. For variables stars
Stars in sky regions near the equator will be observed, on average, 20 times per year. When using the polar mode, circumpolar stars will be observed on each pass of the orbit. Thus, each high-declination star will be measured several thousand times. Measuring star brightness simultaneously in 10 filters will permit us to reliably detect known variable stars and discover new ones, making use of the variable’s brightness levels in different filters being correlated. The method for such discoveries was developed in the Sternberg Institute (Mironov et al. 2003.)
4.2. For galactic halo
We hope to solve at least two problems:
-
•
determination of reddening (colour excesses);
-
•
determination of metallicity.
We have calculated several diagrams using atlases of spectral energy distributions (SEDs) and the synthetic photometry method. As initial data we used the atlas of empirical average SEDs by Pickles (1998) and two atlases of the theoretical SEDs by Lejeune et al. (1997, 1998)
On the traditional () diagram a reddening can be obtained for O - B3 spectral types only. Only for these spectra, there are no multiple crossings between the stellar sequences and the reddening line. However, stars of early spectral types usually are located near star formation regions where there are special conditions for interstellar matter.
Determination of reddening using ultraviolet bands.
Ultraviolet bands of the photometric system ”Lyra” ”195”, ”218” and ”270” and colour indices (m195 – m218) and (m218 – m270) make it possible to obtain reliable values of reddening for stars O - F. It is shown on the figure 3.
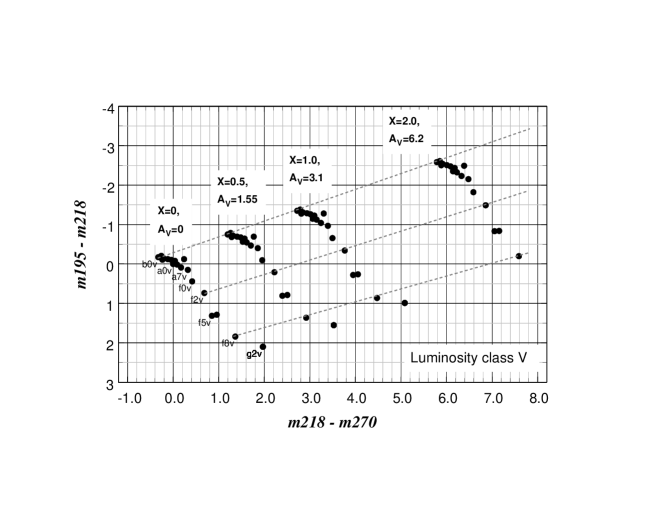
There are no multiple crossings between the stellar sequence and the reddening lines on the figure. The larger the amount of interstellar matter, the larger is one of the colour indices and the smaller is the other one. The initial data for figures 3, 4 and 5 are taken from Pickles (1998) library.
Determination of reddening using G-K stars.
The reddening of G – K stars may be obtained on the two-colour diagram (m350–m700,m700 –m930)
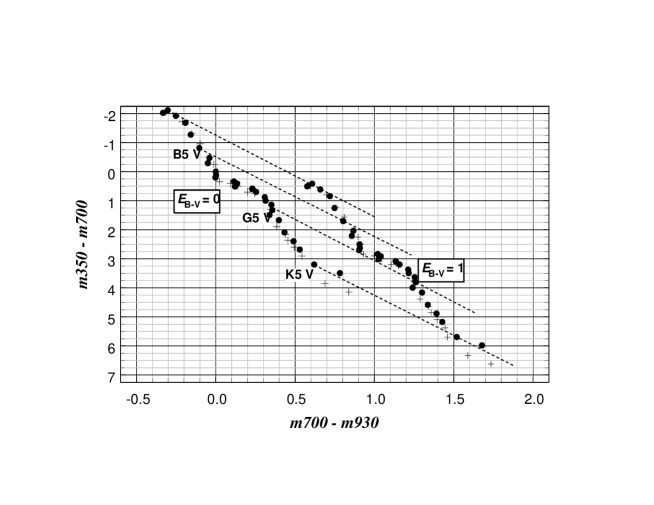
On the figure 4 there are no multiple crossings between the stellar sequence and the reddening lines in the O-B8 and G5-K5 spectral type ranges.
Determination of reddening using M giants.
Usually the slopes of temperature reddening lines and interstellar reddening lines on two-colours diagrams are similar. But some digrams show that for most red stars, the crossing angle of these lines may be not small. To obtain such an effect one of the used photometric bands have to be a band similar to V band.

The two-colour diagram (m440 – m550,m550 –m700) shown on figure 5 allows us to determine reddening using giants M4 and later.
Differentiation of F-G-K-M stars on metallicity.
Figure 6 shows two-color diagram that allows us to divide the stars of spectral classes F - K for the metallicity.
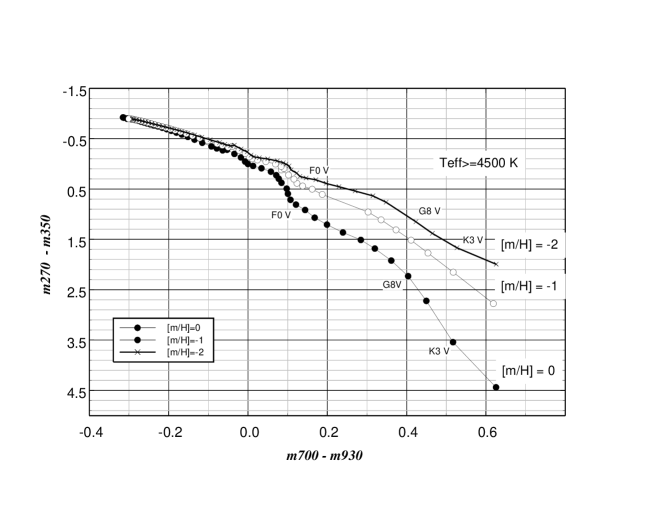
The initial data for the figure 6 are from Lejeune et al. (1997) and Lejeune et al. (1998) libraries.
We are continuing to investigate properties of the photometric system ”Lyra”.
References
- Mironov et al. (2003) Mironov A.V., Zakharov A.I., Nikolaev F.N. 2003, Baltic Astronomy, 12, 589
- Pickles A.J. (1998) Pickles A.J. 1998, Publ. Astron. Soc. Pacific, 110, 863
- Lejeune et al., (1997) Lejeune T., Cuisinier F., Buser R. 1997, 2 Astron. Astrophys. Suppl. Ser. 125, 229
- Lejeune et al., (1998) Lejeune T., Cuisinier F., Buser R. 1998, Astron. Astrophys. Suppl. Ser. 130, 65