On the coldness of the local Hubble flow: the role of baryons
Abstract
Our aim is to investigate whether the presence of baryons can have any significant influence on the properties of the local Hubble flow which has proved to be “cold”. We use two cosmological zoom simulations in the standard CDM cosmology with the same set of initial conditions to study the formation of a local group-like system within a sphere of Mpc. The first one is a pure dark matter simulation (runDM) while a complete treatment of the physics of baryons is introduced in the second one (runbaryons). A simple algorithm based on particles identity allows us to match haloes from the two runs. We found that galaxies identified in runbaryons and their corresponding dark matter haloes in runDM have very similar spatial distributions and dynamical properties on large scales. Then, when analyzing the velocity field and the deviation from a pure Hubble flow in both simulations, namely when computing the dispersion of peculiar velocities of galaxies and those of their corresponding dark matter haloes in runDM, we found no particular differences for distances 1 to 8 Mpc from the local group mass center. This suggests that the presence of baryons have no noticeable impact on the global dynamical properties of the local Hubble flow within such distances. Then, the results indicate that the “true” values can be estimated from the pure dark matter simulation with a mean error of 3 km/s when dark matter haloes are selected with maximum circular velocities of 30 km/s, corresponding to a population of dark matter haloes in runbaryons that host galaxies. By investigating the properties of the Hubble flow at distances 0.7 to 3 Mpc, we also found that the estimation of the total mass enclosed at the radius of the zero-velocity surface , using the spherical infall model adapted to CDM, can be underestimated by at least 50%.
keywords:
Galaxies: Local Group – Galaxies: haloes – Dark matter – Methods: N-body simulations1 Introduction
The study of dynamical and photometric properties of galaxies in the local universe represents an ideal framework to confront predictions of the standard cold dark matter (CDM) model with observations. In particular, an interesting feature of the dynamical properties of the local universe is that the Hubble flow is rather “cold”, e.g. the dispersion in the peculiar velocities within the Hubble flow is quite small, namely 100 km/s (Sandage & Tammann 1975; Giraud 1986; Schlegel et al. 1994; Ekholm et al. 2001, Karachentsev et al. 2003; Macciò, Governato & Horellou 2005; Tikhonov & Klypin 2009).
The presence of the dark energy was proposed as a possible explanation for the smoothness of the local Hubble flow, first argue by Baryshev et al. (2001), Chernin et al. (2001, 2004, 2007) and Teerikorpi et al. (2005) and supported by Macciò, Governato & Horellou (2005) using a set of N-body simulations. However, Hoffman et al. (2007) compared results from their own simulations of CDM and CDM cosmologies with identical parameters, apart from the presence or not of the cosmological constant term. They claimed that no significant differences were noticed in the velocity flow around galaxies having properties similar to those observed in the neighborhood of the Milky Way. A similar conclusion was obtained more recently by Martinez-Vaquero et al. (2009) using a range of N-body simulations in different cold dark matter scenarios. They conclude that the main dynamical parameter that can affect the coldness of the flow is the relative isolation of the Local Group. Another approach was proposed by Peirani & de Freitas Pacheco (2006, 2008) who derived a velocity-distance relation by modifying the Lemaître-Tolman model (TL) with the inclusion of a cosmological constant term. They found that this new relation, which describes the behavior of the Hubble flow near the central dominant objects (2-3 Mpc), in addition to that derived from the “canonical” model (), provide equally acceptable fits to the existing available data. As a consequence, no robust conclusion about the effects of the cosmological constant on the dynamics of groups could be established. Moreover, Axenides & Perivolaropoulos (2002) studied the dark energy effects in the growth of matter fluctuations in a flat universe. They concluded that the dark energy can indeed cool the local Hubble flow but the parameters required for the predicted velocity dispersion to match the observed values are out by observations that constrain either the present dark energy density or the equation of state parameter w(=).
Other cosmological models were proposed to study the local Hubble flow. Dark matter simulations by Governato et al. (1997) for cosmological models with or are, according to these authors, unable to produce systems embedded in regions of “cold” flows, i.e., with 1-D dispersion velocities of approximately 40-50 km/s. Recently, Tikhonov et al. (2009a, 2009b) have compared the observed spectrum of minivoids in the local volume with the spectrum of minivoids determined from the simulations of CDM or WDM models. They found that model predictions and observations match very well provided that galaxies can only be hosted by dark matter haloes with circular velocities greater than 20 km/s (for WDM) and 35 km/s (for CDM). They have also derived rms deviations from the Hubble flow which seem to be consistent with observational values.
All those past numerical works have used collisionless N-body simulations to investigate the puzzle of coldness of the local Hubble flow and thus, the velocity dispersions have been derived by considering the dynamical properties of dark matter haloes supposed to host galaxies. However, it is nonetheless not obvious that positions and velocities of galaxies and their host dark matter haloes are identical. A first element of answer was given by Weinberg et al. (2008) who have studied the subhalo and galaxy populations in a galaxy group simulated either by a collisionless cosmological simulation or a hydrodynamics simulation with the same initial conditions. They found that positions and masses of large subhaloes are very similar in both runs while they can be different for low mass subhaloes whose orbits can be more easily modified by the host halo potential. Past works also suggest the existence of bias between the star and dark matter components (see for instance, Carlberg, Couchman & Thomas 1990; Zhao, Jing & Börner 2002; Sousbie et al. 2008). In the present work, we study possible effects of the presence of baryons in the dynamical properties of the local Hubble flow by using high resolution simulations that include most of the relevant physical processes that lead to the formation of galaxies inside dark matter haloes. This paper is organized as follows: in Sect. 2, we summarize the numerical methodology; in Sect. 3 we present results on the dispersions of peculiar velocities around the mean Hubble local flow derived from our numerical models and, finally, in Sect. 4, our main conclusions are given.
2 Numerical modeling
2.1 Initial conditions and simulation methodology
The cosmological simulations analysed in this work use the technique of “zoom” (Tormen, Bouchet & White 1997). We summarize the main steps here. First, we have performed a cosmological simulation for a CDM universe using WMAP5 parameters (Komatsu et al. 2009), namely , , , km/s/Mpc, and . The simulation was performed in a periodic box of side Mpc with dark matter particles (e.g. with mass resolution of ). The simulation started at and ended at the present time where we have selected one local group (LG) type halo (see section 2.2). In a second step, we have resimulated this LG candidate by using an equivalent resolution of particles within a sphere of Mpc. The particle mass resolution is progressively degraded around this region of interest to reach the lowest resolution of effective particles. Initial conditions have been generated from the MPgrafic code (Prunet et al. 2008), a parallel (MPI) version of Grafic (Bertschinger 2001).
In order to study effects of baryons, we have run 2 simulations using the same set of initial conditions: in the first one, only the dark matter component is considered (referred to as runDM) whereas baryons are included in the second one (referred to as runbaryons) with a full treatment of the physics of baryons (see below). In these cases, the highest mass resolution are (runDM) and , (runbaryons). The Plummer-equivalent force softening adopted for the high mass resolution particles were 1 and 0.5 kpc for dark matter and gas particles respectively and were kept constant in comoving units. An intermediate pure dark matter zoom simulation with a lower resolution (e.g. DM effective particles in the central part) has been realized in order to check the convergence of the dynamical and physical properties of the cental main haloes (masses, relative distance of haloes, etc…).
The simulations were performed using GADGET2 (Springel 2005). As far as the runbaryons is concerned, we have added prescriptions for cooling, star formation, feedback from Type Ia and II supernovae (SN), UV background and metal enrichment. Most of this implementation have been tested (effects of mass resolution on the star formation rate for instance) and used in previous works (see, for instance, Peirani et al. 2009a,b). For the sake of clarity, we summarize the main points in the following.
The evolution of the thermodynamic properties of the gas depends on a range of physical processes. First we use a standard UV-background prescription described in Haardt & Madau (1996). The cooling and star formation (SF) recipes follow the prescriptions of Thomas & Couchman (1992) and Katz, Weinberg & Hernquist (1996), respectively. Gas particles with K cool at constant density with a given metallicity for the duration of a timestep. Gas particles with , number density , overdensity , and form stars according to the standard SFR prescription: , where refers to the stellar density, is the dynamical timescale of the gas, and is the SF efficiency. Instead of creating new (lighter) star particles, we implement the SF prescription in a probabilistic fashion. Assuming a constant, dynamical time scale across the timestep, the probability that a gas particle forms stars in a time is . For each eligible gas particle, we select a random number () between 0 and 1 and convert it into a star if .
Next, star particles are treated as evolving stellar populations that inject energy into the inter-stellar medium, through SN explosions, as a function of time. For this, we consider stellar lifetimes in the mass ranges of and for Type Ia and Type II progenitors, respectively. Using a Salpeter initial mass function for Type II SN, we find that the rate of energy injection is:
| (1) |
where erg, is the mass of the stellar population, and Myr. For Type Ia SN, the heating is delayed, since they appear Gyr after the onset of star formation. Following de Freitas Pacheco (1998), the probability of one event on a timescale after the onset of star formation is given by:
| (2) |
Equations (1) and (2) are used to compute the energy released by SN derived from a star particle (). A fraction of this energy is deposited in the jth neighbour gas particle by applying a radial kick to its velocity with a magnitude , where is the weighting based on the smoothing kernel and is the mass of gas particle j. We note that all gas neighbours are located in a sphere of radius , centered on the SN progenitor, to avoid spurious injection of energy outside the SN’s region of influence. In the following, we use the following standard values: , kpc, and .
| runDM | runbaryons | |||||
| Galaxy | ||||||
| MW | ||||||
| (100 097) | (196 947) | (102 846) | (73 600) | (20 501) | ||
| M31 | ||||||
| (100 052) | (183 926) | (100 856) | (57 223) | (25 847) | ||
| DMW-M31 | 1.01 Mpc | 1.03 Mpc | ||||
Supernovae do not only inject energy to the ISM but also diffuse heavy metals leading to a progressive enrichment of their nearby environment. To estimate the stellar metallicity, we assume that the first generation of stars will have “zero-metallicity” and the subsequent generations will be formed in a medium enriched in metals by the previous generations. To estimate the metal abundance, we have considered two elements: Mg (magnesium), representing the “-abundance” and Fe (iron), representing all heavy elements of the “iron-peak”. The former is produced essentially by the type II events whereas the later is produced mainly by type Ia supernovae.
The amounts of Fe and Mg produced by type II supernovae originating from each stellar cluster are taken from Umeda et al. (2002):
| (3) |
where is the mass of star particle in the simulation. All Fe (or Mg) is produced after only 29 Myr. Using a Salpeter IMF, the fraction by mass of these events is and the average Fe and Mg masses produced by type II supernovae are and . In the case of type Ia supernovae, the amount of Fe and Mg ejected after a given age of a given generation is
| (4) |
where , and (from model W7 by Nomoto et al. 1997).
The mass of Fe and Mg injected in the medium follows the supernovae rate estimated previously, being redistributed according to the smoothing kernel among the gas particles in the sphere of radius . Then, at each timestep, one can estimate the [Fe/H], [Mg/H] and [Mg/Fe] abundances of each gas particle as well as a global metallicity by using the formula derived in Salaris, Chieffi & Straniero (1993), where is the enhancement factor of -elements with respect to iron. In our model, the [Mg/Fe] abundance is used as a proxy of [/Fe]. The inclusion of metal enrichment processes in the present study allows us to improve the treatment of the gas cooling using metal-dependent cooling functions adapted from Surtherland & Dopita (1993). Note that a similar methodology was adopted in previous works (see for instance, Kobayashi 2004; Tornatore et al. 2004; Scannapieco et al. 2005).
2.2 Properties of simulated Local Group type objects
In this study, we focus on pairs of galaxies with physical characteristics similar to the Milky Way-Andromeda pair (MW-M31). Each LG group candidate must satisfy the following criteria:
-
(a)
The group contains two main haloes of comparable mass (), are separated from a distance Mpc and their relative radial velocity is negative.
-
(b)
There is no object with mass greater than and within the distance and Mpc from the center of mass of the main pair of haloes respectively.
-
(c)
There is only one Virgo-like halo () at the distance of to Mpc.
Such selection criteria are quite similar to those used in previous works (Macciò, Governato & Horellou 2005; Hoffman et al. 2008; Tikhonov & Klypin 2009; Martinez-Vaquero et al. 2007, 2009) and then make the comparison of the results easier. Several candidates of pairs of dark matter haloes that satisfy criterion (a) can be easily found but almost all of them are ruled out by criteria (b) and (c). In the end, only one candidate that satisfy all of the above criteria has been found. This latter system has been resimulated with and without baryons and using higher resolutions. The simulations were performed on local parallel supercomputers at IAP (France) and the CPU times for runDM and runbaryons were 2 days and 2.5 months respectively using 32 processors. Table 1 summarizes the main properties of the central objects in both runs and the number of particles considered for each component. In the following, we will mostly characterize dark matter haloes by their maximum circular velocity which can defined by , where is the mass enclosed at radius r. can be estimated without any accurate estimate of the physical boundary of the objects which can be proved to be difficult especially for subhaloes.
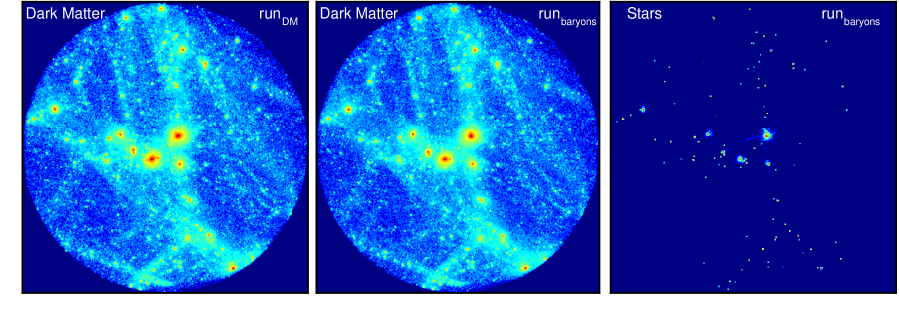
Fig. 1 shows the projected density of dark matter from runDM and runbaryons as well as the projected density of stars within a sphere of physical radius 4 Mpc. The distributions of dark matter look very similar between the two simulations. However, the dark matter haloes seem to be more concentrated when baryons are included in the simulation. This can be explained by the fact that dissipation of the gas (from radiative cooling processes) and subsequent star formation lead to a steeper DM density profile due to adiabatic contraction. This process can also be observed in dark matter substructures which become less sensitive to tidal torques and will survive a longer time in their host haloes, as has been extensively discussed in the past literature (Blumenthal et al. 1986; Gnedin et al. 2004; Duffy et al. 2010 and references therein).
2.3 Mock catalogs of dark matter haloes and galaxies
One of the main purposes of this work is to study how the inclusion of baryons may affect the dynamical properties of the simulated local universe. Then, we have used a simple algorithm which allows a direct comparison between the two simulations.
First, we have prepared mock catalogs of dark matter haloes and galaxies at for each simulation. To do this we have used the public code AMIGA111http://popia.ft.uam.es/AMIGA (Knollmann & Knebe 2009) which is an efficient halo and substructure finder by identifying local density maxima in an adaptively smoothed density field. The use of this code is also attractive since subhaloes are separated form their parent haloes and each (sub)halo center is estimated accurately by an iterative algorithm, which is crucial in this study. For each object, we define the virial radius (and thus the virial mass ) as the radius where the enclosed mean density is times the critical density, , where . can be computed from the spherical top-hat collapse model, and in the case of a flat cosmology with , one can use the fitting formula from Bryan & Norman (1998) which depends on both cosmology and redshift:
| (5) |
| (6) |
| (7) |
In the cosmology used for the present study, at . Then, only bound structures with at least 100 dark matter particles (e.g. a mass higher than in runDM) were retained in the different catalogs. In the following, SPH haloes refers to objects identified in runbaryons which consists of a single dark matter halo containing a fraction of gas and (or not) a galaxy, namely a bound structure with at least 80 star particles (corresponding to a mass of ).
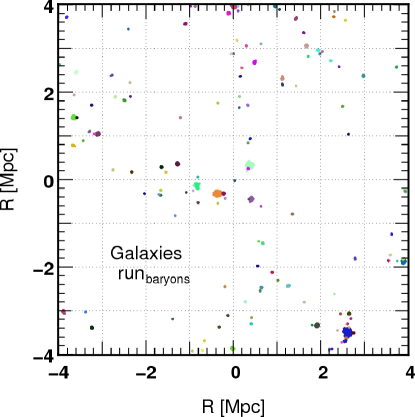
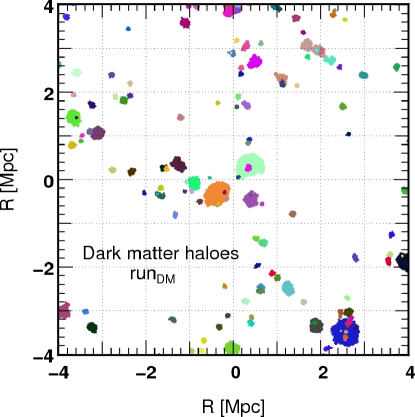
Once the two catalogs are built, we match the SPH haloes to their equivalent DM haloes of runDM by using the following algorithm. Since each particle in the simulation can be identified, it is possible to obtain the constitution of each SPH and DM halo at . If more than 50% of dark matter particles of a given SPH halo is found in a dark matter halo of runDM, we assume that both objects are the same. To illustrate this, Fig. 2 shows the distribution of all galaxies that have a corresponding dark matter halo in runDM within a distance of 4 Mpc from the LG mass center. However, it is worth mentioning that a small number of SPH haloes have no corresponding dark matter halo in runDM. These SPH haloes are mainly substructures belonging to the most massive objects such as the MW or M31 haloes. In runDM, they don’t exist anymore, mainly because they have been completely disrupted by tidal torques. Such a statement has already been studied in great detail in previous works (see for instance, Nagai & Kravtsov 2005; Libeskind et al. 2010, Klimentowski et al. 2010).
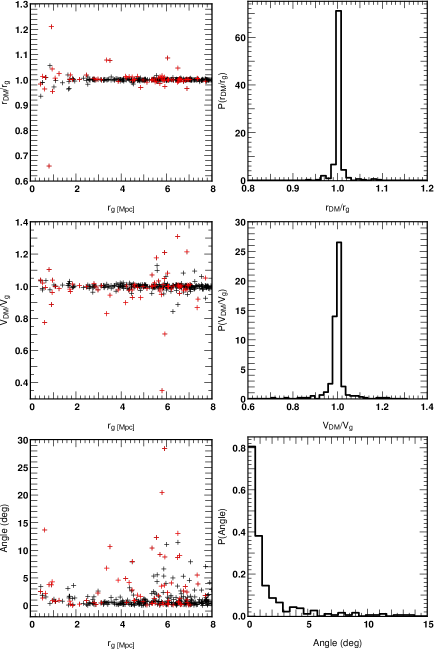
It is now interesting to study the statistical differences between the radial distances (in the frame of the Local Group) and peculiar velocity of galaxies (,) identified from runbaryons and those of their corresponding dark matter haloes in runDM (,) at . The main results are shown in Fig. 3 where the probability distribution functions of the position ratio , the velocity norm ratio and the angle (,) are plotted. Fig. 3 also shows the variations of , and (,) with respect to positions . It appears clearly that most of the galaxies have very similar position and velocity properties to their corresponding dark matter haloes. However, in some cases, we notice important differences between the two runs. This happens mainly for substructures () in more massive objects where their dynamics and orbits are more likely to be modified by the halo potential, as previously observed by Weinberg et al. (2008). Moreover, a detailed study by Libeskind et al. (2010) has also shown that subhaloes in hydrodynamic runs tend to be more radially concentrated than those in pure dark matter ones.
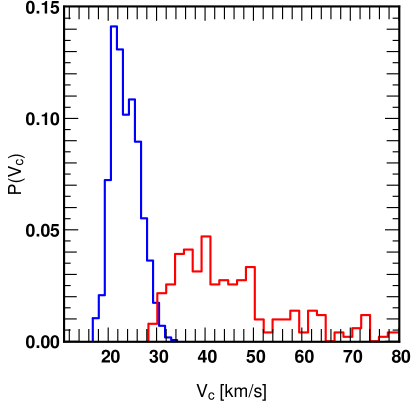
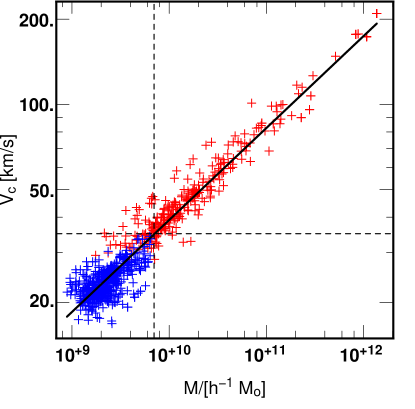
Among the population of SPH haloes, there is a subpopulation of dark matter haloes that contain no stars and thus no galaxy. From a theoretical point of view, the existence of such dark halo populations can be explained by the fact that their star formation have been suppressed by feedback processes such as UV-background (Thoul & Weinberg 1996; Bullock, Kravtsov & Weinberg 2000; Somerville 2002; Ricotti, Gnedin & Shull 2002; Benson et al. 2002; Read, Pontzen & Viel 2006; Hoeft et al. 2006; Okamoto, Gao & Theuns 2008). In particular, the presence of a photoionizing background suppresses the formation of galaxies with circular velocities km/s (Thoul & Weinberg 1996; Bullock, Kravtsov & Weinberg 2000) and a similar result has been derived by Tikhonov & Klypin (2009) in order to explain the observed size of local voids, using models with . Moreover, Hoeft et al. (2006) have also studied the formation of dwarf galaxies in voids using high-resolution hydrodynamical simulations including UV-background. They derived a critical mass for haloes at , , below which the cooling of gas is suppressed and similar results have been derived by Okamoto, Gao & Theuns 2008). Then, we have compare the properties of dark matter haloes of runDM that have either a corresponding galaxies or a dark halo in runbaryons. In Fig. 4, the probability distribution function is represented for the maximum circular velocity of DM haloes from runDM and the variations of as respect to their total halo mass. The results suggest that there is a critical value ( km/s) where the star formation is suppressed, in good agreement with past works. Moreover, dark matter haloes that have corresponding starless SPH haloes in runbaryons are characterized by km/s and have a mass lower than . Note that, the circular velocity of dark matter haloes of runDM can be well approximated by km in good agreement with Hoeft et al. (2006) and Klypin, Trujillo-Gomez & Primack (2010).
| R(Mpc) | a | b | c | d | e | f | g |
|---|---|---|---|---|---|---|---|
| 1-2 | 51.4 (17) | 50.1 (17) | 51.4 (17) | 52.8 (17) | 48.5 (7) | 52.0 (20) | 59.1 (59) |
| 1-3 | 45.2 (37) | 42.4 (37) | 45.1 (36) | 44.3 (36) | 39.0 (14) | 44.1 (41) | 47.3 (126) |
| 1-4 | 58.5 (66) | 54.8 (66) | 57.5 (64) | 56.2 (64) | 48.2 (21) | 53.9 (72) | 57.0 (217) |
| 1-5 | 66.9 (125) | 61.4 (125) | 61.9 (114) | 61.6 (114) | 69.0 (48) | 64.8 (134) | 65.0 (372) |
| 1-6 | 75.1 (188) | 68.2 (188) | 72.3 (172) | 71.1 (172) | 74.3 (69) | 72.8 (192) | 70.1 (532) |
| 1-7 | 83.5 (267) | 75.2 (267) | 81.4 (246) | 80.7 (246) | 82.7 (92) | 79.9 (269) | 77.6 (724) |
| 1-8 | 98.9 (331) | 90.4 (331) | 98.5 (308) | 97.9 (308) | 101.8 (120) | 94.7 (332) | 91.5 (904) |
| 0.0 | 2.3 | 3.0 | 4.9 | 3.0 | 5.1 |
a computed from galaxies identified in runbaryons (Sample ).
b computed from galaxies identified in runbaryons (Sample ) but corrected from distance errors.
c computed from galaxies identified in runbaryons that have a corresponding DM halo in runDM (Sample ).
d computed from DM haloes identified in runDM that have a corresponding galaxy in runbaryons (Sample ).
e computed from DM haloes identified in runDM with a maximum circular velocity 45 km/s (Sample ).
f computed from DM haloes identified in runDM with a maximum circular velocity 35 km/s (Sample ).
g computed from DM haloes identified in runDM with a maximum circular velocity 20 km/s (Sample ).
3 The local Hubble flow
The local Hubble flow has proved to be cold according to past observational analysis. As mentioned in the introduction, this puzzle has been studied in various numerical works but no one so far has investigated the impact of baryons, the main purpose of this work.
In the following, the peculiar velocity dispersion in the local volume is estimated by using the root mean square (RMS) of the residual from the global Hubble flow, defined by:
| (8) |
where and are radial velocities and radial distances of galaxies (or dark matter haloes) in the frame of the Local Group where the origin matches with the mass center of the MW-M31 pair, and is the global Hubble flow. In order to compare with recent works, and more specifically with the analysis of Tikhonov & Klypin (2009) and Martinez-Vaquero et al. (2009), we have estimated using different samples of dark matter haloes or galaxies with distances between 1 to D Mpc (where D2, 3, 4, 5, 6, 7 and 8 Mpc) and considering , with km/s/Mpc. However, it is worth mentioning that for distances within 3 Mpc, due to the decelerating influence of the main central objects to nearby low mass objects, the Hubble flow is not well described by (see Fig. 7) and one should use another relation such as the one derived in Peirani & de Freitas Pacheco (2008). Then, the study has been limited to a distance of 8 Mpc to avoid to be in the vicinity of the boundary of the highest resolution domain. First, sample includes all galaxies identified in runbaryons and represents therefore the fiducial sample. For this case only, has been estimated either by assuming a 10% error as the mean error of distance measurements (referred to as ) or with no error (referred to as ). Samples and regroup galaxies and their corresponding dark matter haloes in runDM respectively and have therefore the same number of objects which permits a direct comparison between the two runs. Finally, samples , and gather dark matter haloes extracted from runDM with circular velocities higher than 45, 30 and 20 km/s respectively.
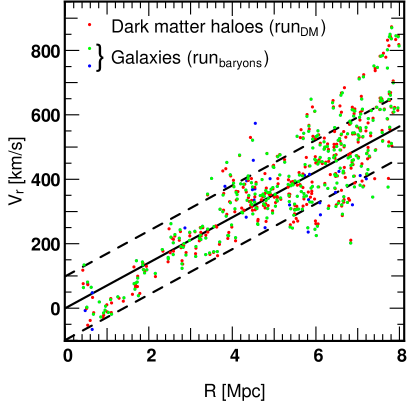
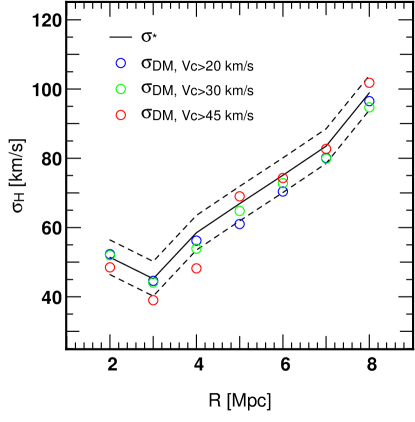
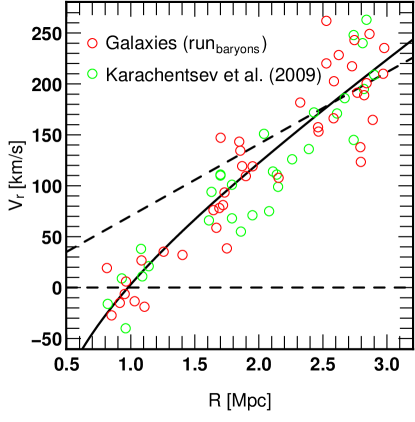
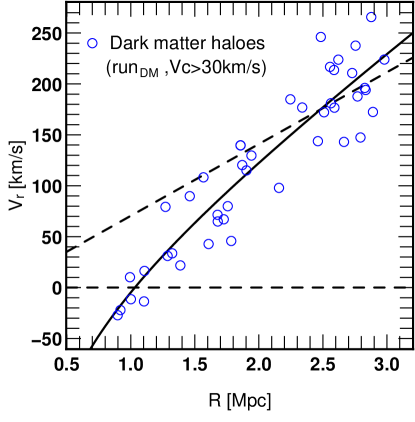
Fig. 5 shows the Hubble diagram for galaxies and dark matter haloes belonging to sample , and . As expected from results presented in the previous section, radial distances and velocities of galaxies and those of their corresponding dark matter haloes in runDM follow the same trend. Such a statement is also confirmed by Table 2 where all the values derived at different distances from the LG mass center and for different samples are shown. In particular, values derived from samples and are very close and suggests that the presence of baryons does not affect the velocities dispersion of satellites around the main pair at distances 1-8 Mpc. Moreover, results from samples , and show that estimations of from the pure dark matter simulation give similar values than those derived from the fiducial sample as it can been clearly seen in Fig. 6. For instance, when dark haloes are selected with km/s, the number of objects considered is quite close to the “true” number of galaxies and the mean error on is in order of km/s. However, when haloes are selected with km/s and km/s, both cases lead to an estimation of with a mean error of km/s as respect to values although the number of objects taken into account for the computation are underestimated or overestimated respectively.
To finish, it is instructive to compare the velocity dispersion values derived from our numerical model to values obtained from the analysis by Tikhonov & Klypin (2009) who have considered the most complete observational data using an updated version of the Karachentsev et al. (2004) sample of galaxies. The number of galaxies used to compute (first column of Table 2) is in quite good agreement with number of galaxies considered within 1-8 Mpc (see their Table. 3). However, we found that values derived in this work tend to be (%) smaller within 1-8 Mpc. We have also compared in Fig. 7 our simulated data to updated data on distances and velocities of galaxies for distances Mpc without an additional dipole component (Karachentsev et al. 2009). The nice agreement between simulated data and observations lead to similar values of the dispersion of peculiar velocities. Indeed, using in this case derived in Peirani & de Freitas Pacheco (2008), we found km/s from observational data whereas km/s and km/s respectively for galaxies from runbaryons and dark matter haloes from runDM with km/s. But an important feature of the Hubble flow at such distances is the decelerating influence of the central main objects on nearby galaxies which lead the radial velocities-distances regression to cross the line of zero velocity at the turnaround radius R0. In this regard, Lynden-Bell (1981) and Sandage (1986) proposed an alternative method to the virial relation in order to estimate the mass of the Local Group, which can be extended to other systems dominated either by one or a pair of galaxies. Based on the Lemaître-Tolman (LT) model (Lemaître 1933; Tolman 1934), they show that, if the velocity field close to the main central body (probed by satellites) allows the determination of R0, then the total central mass can be calculated straightforwardly from the relation
| (9) |
where T0 is the age of the universe and G is the gravitational constant. In a flat cosmological model with a cosmological constant , equation (9) needs to be modified as follows (Karachentsev et al. 2007):
| (10) |
where
| (11) |
We have estimated from our two mock catalogs of galaxies and haloes by fitting the formula derived in Peirani & de Freitas Pacheco (2008) to our simulated data. From the best fit solutions, we obtained Mpc (galaxies sample) and Mpc (for dark matter haloes sample with km/s). Using and km/s/Mpc, one can derive from Eq. (10) the total masses enclosed at radius , namely (galaxy sample) and (dark matter haloes sample) respectively. However, the total mass enclosed in a radius of 1 Mpc is from both simulations and suggest that masses derived from Eq. (10) are underestimated by a factor 1.5-1.7.
4 Discussion and Conclusions
In the present paper, we have used cosmological N-body simulations with and without a complete treatment of the physics of baryons to study the formation of a local group type halo. We have first identified a LG system in a simulation with a low mass particle resolution, using standard criteria. Then, the best candidate has been re-simulated with higher resolution using the technique of zoom. This approach differs from the technique of constrained simulations used for instance in the CLUES project (Yepes et al. 2009), which include the correct motion and position of objects in a large volume such as the Local Supercluster, the Virgo and the Coma cluster and the Great Attractor (see also Lavaux 2010).
We focus on the dynamical properties of the local Hubble flow and in particular, the influence of baryons. From the two runs, we built mock catalogs of either galaxies or dark matter haloes and computed their velocities as respect to the mass center of the central main pair (Milky Way-M31). We found that the dispersions of peculiar velocities around the mean local Hubble flow of galaxies in runbaryons and those of their corresponding dark matter haloes in runDM are very close for distances to 8 Mpc. Moreover, similar values (with mean errors km/s) are also obtained for samples of dark matter haloes extracted from runDM with constraint of their maximum circular velocity. These results suggest that the global dynamical properties of the Hubble flow is not affected by the presence of baryons. Such a result is not very surprising since galaxies are expected to form in the gravitational potential well of dark matter haloes. Therefore, their properties are expected to be closely related to those of their host haloes. This statement is confirmed on large scales as shown in Figs. 2 and 3. However, some discrepancies between positions and dynamical properties of galaxies and those of their corresponding haloes may raised in the case of low mass objects in denser environment. For instance, the presence of baryons is supposed to favor the survival of substructures inside massive haloes against tidal striping (see Duffy et al. 2010 and references therein) and can affect their distribution (Weinberg et al. 2008; Libeskind et al. 2010, Knebe et al. 2010). But these effects seem to have no particular consequences in the estimation of the global values. It should also be pointed out that runbaryons does not include any prescriptions of strong feedback such as galactic winds or Sedov shock waves that are expected to lead to a significant ejection of gas from the central region of forming galaxies. As a result, the fraction of baryons (in the form of stars and cold gas) in the central region of simulated massive galaxies such as the Milky Way or M31 is close to the cosmological baryonic fraction (see Table 1) whereas observations suggest lowest values (Fukugita, Hogan & Peebles 1998; Bell et al. 2003). However, no one has solved this “missing baryon problem” yet and recent studies even suggest that theoretical sources of strong winds such as AGN and supernovae are insufficient to explain the missing baryons in Milky Way type galaxies (see for instance Anderson & Bregman 2010; Silk & Nusser 2010). Although the present study mainly focus on lower mass galaxies () in which supernovae feedback is supposed to have a significant impact in their formation, the other sources of strong feedback should be taken into account as well. Then, a natural extension of this work would be to add these processes while increasing the mass resolution in the simulation (see for instance Ceverino & Klypin 2009) to see whether the conclusions presented here (especially the distribution of galaxies as respect to their corresponding dark matter haloes) are significantly affected of not.
In good agreement with previous theoretical and numerical works, we found that the halo population in the pure dark matter run can be divided into two groups according to their maximum circular velocity . There is indeed a critical value, km/s (corresponding to haloes with mass lower than in runDM), below which the corresponding SPH haloes don’t host any galaxy. Such a phenomenon may be explained by the fact that the cooling of gas is expected to be suppressed by feedback processes such as a UV-photoionisation in low mass haloes (see references in paragraph 2.3). As regards this point, we cannot exclude the fact that the numerical resolution used in this work may affect the results especially for low mass systems. However, haloes with mass of are composed by particles and this seems reasonable for the estimation of the thermodynamic properties of the gas component. Then, table 2 indicates that the number of dark matter haloes in runDM selected with km/s is actually quite close to the real number of galaxies selected runbaryons. Therefore, one can use this single criteria to select dark matter haloes in a collisionless simulation to have an good estimation of . The existence of a dark halo population in the Local Group can also have important consequences in understanding the discrepancies between the large number of subhaloes present in simulations but not observed (Kauffmann, White & Guiderdoni 1993; Moore et al. 1999; Klypin et al. 1999). This problem is beyond the scope of this paper and will be investigated in detail in a forthcoming paper.
The velocity dispersion obtained from our fiducial model (e.g. from galaxies) is in quite good agreement with observational expectations. For instance, with added corrections for distance errors, we obtained for Mpc, a value which tend to be even lower that the one derived from observational analysis, namely 99.3 km/s (Tikhonov & Klypin 2009) and with a reasonable number of galaxies considered. For distances from 0.7 to 3 Mpc, we also found a nice agreement between our simulated data and observational ones from Karachentsev et al. (2009). Then, these results suggest that there is no particular problem with the CDM model in reproducing the velocity dispersion derived from observational analysis. A similar conclusion was obtained from Martinez-Vaquero et al. (2009) who found that a non-negligible fraction of LG like objects simulated form various cosmological models present a value close to (and even smaller) than the observed value. Moreover, similar results have been also obtained from the analysis of Tikhonov & Klypin (2009). Since the present study has been limited to only one realization, due to the high computational cost when the physics of baryons is included in the simulations, general conclusions cannot be drawn. However, one of our main criteria to select LG candidates was their relative isolation (no massive galaxies within 3 Mpc). We stress that we found only one candidate (among 16 MW-M31 pair candidates) that was satisfying all the criteria. This raised the question whether the local group is located in a particular place of the universe or not.
To finish, we have also compared our simulated data to observational ones for Mpc. The nice agreement between them allows us to test models, in particular the estimation of the total mass enclosed at the zero-velocity surface radius using the Lemaître-Tolman model adapted to CDM. It appears that the estimation of the LG mass using this approach is underestimated by at least 50%. This is probably due to the fact that, on the one hand, the hypothesis of a spherical infall collapse is not valid anymore in this specific case. On the other hand, the mass enclosed within is not constant in the time, as assumed by the TL model (e.g. no mass accretion), and this effect may have an important influence in the estimation of the final total mass.
Acknowledgment
I acknowledge support from the “Agence National de la recherche” ANR-08-BLAN-0222-02. It is a pleasure to thank the anonymous referee for his/her useful comments which have significantly improved this paper. I warmly thanks C. Alard, S. Colombi, J. Devriendt, R. Gavazzi, M. Hudson, Y. Kakazu, I. D. Karachentsev, A. Klypin, G. Mamon, R. Mohayaee, J. A. de Freitas Pacheco, C. Pichon, S. Prunet, J. Silk and T. Sousbie for interesting discussions. I also thanks D. Munro for freely distributing his Yorick programming language (available at http://yorick.sourceforge.net/) which was used during the course of this work. This work was carried within the framework of the Horizon project (http://www.projet-horizon.fr).
References
- [] Anderson, M. E., & Bregman, J. N. 2010, ApJ, 714, 320
- [] Axenides, M., & Perivolaropoulos, L. 2002, Phys. Rev. D, 65, 127301
- [] Baryshev, Y. V., Chernin, A. D., & Teerikorpi, P. 2001, A&A, 378, 729
- [] Bell, E. F., McIntosh, D. H., Katz, N., & Weinberg, M. D. 2003, ApJL, 585, L117
- [] Benson, A. J., Frenk, C. S., Lacey, C. G., Baugh, C. M., & Cole, S. 2002, MNRAS, 333, 177
- [] Bertschinger, E. 2001, ApJS, 137, 1
- [] Blumenthal, G. R., Faber, S. M., Flores, R., & Primack, J. R. 1986, ApJ, 301, 27
- [] Bryan, G. L., & Norman, M. L. 1998, ApJ, 495, 80
- [] Bullock, J. S., Kravtsov, A. V., & Weinberg, D. H. 2000, ApJ, 539, 517
- [] Carlberg, R. G., Couchman, H. M. P., & Thomas, P. A. 1990, ApJL, 352, L29
- [] Ceverino, D., & Klypin, A. 2009, ApJ, 695, 292
- [] Chernin, A., 2001, Phys. Usp. 44, 1099
- [] Chernin, A. D., Karachentsev, I. D., Valtonen, M. J., Dolgachev, V. P., Domozhilova, L. M., & Makarov, D. I. 2004, A&A, 415, 19
- [] Chernin, A. D., et al. 2007, arXiv:0706.4068
- [] Davis M. , Efstathiou G. , Frenk C. S. , White S. D. M. , 1985, ApJ 292, 371
- [1998] de Freitas Pacheco, J. A. 1998, AJ, 116, 1701
- [] Duffy, A. R., Schaye, J., Kay, S. T., Dalla Vecchia, C., Battye, R. A., & Booth, C. M. 2010, arXiv:1001.3447
- [] Ekholm, T., Baryshev, Y., Teerikorpi, P., Hanski, M. O., & Paturel, G. 2001, A&A, 368, L17
- [] Fukugita, M., Hogan, C. J., & Peebles, P. J. E. 1998, ApJ, 503, 518
- [] Giraud, E., 1986, A&A, 170, 1
- [] Gnedin, O. Y., Kravtsov, A. V., Klypin, A. A., & Nagai, D. 2004, ApJ, 616, 16
- [] Governato, F., Moore, B., Cen, R., Stadel, J., Lake, G., & Quinn, T. 1997, New Astronomy, 2, 91
- [] Haardt, F., & Madau, P. 1996, ApJ, 461, 20
- [] Hoeft, M., Yepes, G., Gottlöber, S., & Springel, V. 2006, MNRAS, 371, 401
- [] Hoffman, Y., Martinez-Vaquero, L. A., Yepes, G., & Gottlöber, S. 2008, MNRAS, 386, 390
- [] Karachentsev, I. D., et al. 2003, A&A, 398, 479
- [] Karachentsev, I. D., Karachentseva, V. E., Huchtmeier, W. K., & Makarov, D. I. 2004, AJ, 127, 2031
- [] Karachentsev, I. D., et al. 2007, AJ, 133, 504
- [] Karachentsev, I. D., Kashibadze, O. G., Makarov, D. I., & Tully, R. B. 2009, MNRAS, 393, 1265
- [] Katz, N., Weinberg, D. H., & Hernquist, L. 1996, ApJS, 105, 19
- [] Kauffmann G., White S. D. M. & Guiderdoni B., 1993, MNRAS 264, 201
- [] Klimentowski, J., Łokas, E. L., Knebe, A., Gottlöber, S., Martinez-Vaquero, L. A., Yepes, G., & Hoffman, Y. 2010, MNRAS, 402, 1899
- [] Klypin A., Kravtsov A. V., Valenzuela O. & Prada F., 1999, ApJ 522, 82
- [] Klypin, A., Trujillo-Gomez, S., & Primack, J. 2010, arXiv:1002.3660
- [] Knebe, A., Libeskind, N. I, Knollmann, S. R., Yepes, G., Gottloeber, S., & Hoffman, Y. 2010, arXiv:1002.2853
- [] Knollmann, S. R., & Knebe, A. 2009, ApJS, 182, 608
- [] Kobayashi, C. 2004, MNRAS, 347, 740
- [] Komatsu, E., et al. 2009, ApJS, 180, 330
- [] Lavaux, G. 2009, arXiv:0912.3525
- [1] Lemaître, G., 1933, Ann. Soc. Sci. Bruxelles, A53, 51
- [] Libeskind, N. I., Yepes, G., Knebe, A., Gottlöber, S., Hoffman, Y., & Knollmann, S. R. 2010, MNRAS, 401, 1889
- [2] Lynden-Bell, D., 1981, The Observatory 101, 111
- [] Macciò, A. V., Governato, F., & Horellou, C. 2005, MNRAS, 359, 941
- [] Martinez-Vaquero, L. A., Yepes, G., & Hoffman, Y. 2007, MNRAS, 378, 1601
- [] Martinez-Vaquero, L. A., Yepes, G., Hoffman, Y., Gottlöber, S., & Sivan, M. 2009, MNRAS, 397, 2070
- [] Moore B., Ghigna S., Governato F., Lake G., Quinn T., Stadel J. & Tozzi P., 1999, ApJ 524, L19
- [] Nagai, D., & Kravtsov, A. V. 2005, ApJ, 618, 557
- [] Nomoto, K., Iwamoto, K., Nakasato, N., Thielemann, F.-K., Brachwitz, F., Tsujimoto, T., Kubo, Y., & Kishimoto, N. 1997, Nuclear Physics A, 621, 467
- [] Okamoto, T., Gao, L., & Theuns, T. 2008, MNRAS, 390, 920
- [] Peirani, S., & de Freitas Pacheco, J. A. 2006, New Astronomy, 11, 325
- [] Peirani, S., & de Freitas Pacheco, J. A. 2008, A&A, 488, 845
- [] Peirani, S., Hammer, F., Flores, H., Yang, Y., & Athanassoula, E. 2009, A&A, 496, 51
- [] Peirani, S., Crockett, R. M., Geen, S., Khochfar, S., Kaviraj, S., & Silk, J. 2009, arXiv:0912.2629
- [] Prunet, S., Pichon, C., Aubert, D., Pogosyan, D., Teyssier, R., & Gottloeber, S. 2008, ApJS, 178, 179
- [] Read, J. I., Pontzen, A. P., & Viel, M. 2006, MNRAS, 371, 885
- [] Ricotti, M., Gnedin, N. Y., & Shull, J. M. 2002, ApJ, 575, 49
- [] Salaris, M., Chieffi, A., & Straniero, O. 1993, ApJ, 414, 580
- [] Sandage, A. and Tammann, G.A. 1975, ApJ, 196, 313
- [3] Sandage, A., 1986, ApJ, 307, 1
- [] Scannapieco, C., Tissera, P. B., White, S. D. M., & Springel, V. 2005, MNRAS, 364, 552
- [] Schlegel, D., Davis, M., Summers, F., & Holtzman, J. A. 1994, ApJ, 427, 527
- [] Silk, J., & Nusser, A. 2010, arXiv:1004.0857
- [] Somerville, R. S. 2002, ApJL, 572, L23
- [] Sousbie, T., Courtois, H., Bryan, G., & Devriendt, J. 2008, ApJ, 678, 569
- [] Springel, V. 2005, MNRAS, 364, 1105
- [] Sutherland, R. S., & Dopita, M. A. 1993, ApJS, 88, 253
- [] Teerikorpi, P., Chernin, A. D., & Baryshev, Y. V. 2005, A&A, 440, 791
- [] Thomas, P. A., & Couchman, H. M. P. 1992, MNRAS, 257, 11
- [] Thoul, A. A., & Weinberg, D. H. 1996, ApJ, 465, 608
- [] Tikhonov, A. V., & Klypin, A. 2009a, MNRAS, 395, 1915
- [] Tikhonov, A. V., Gottlöber, S., Yepes, G., & Hoffman, Y. 2009b, MNRAS, 399, 1611
- [4] Tolman, R.C., 1934, Proc. Nat. Acad. Sci. 20, 169
- [] Tormen, G., Bouchet, F. R., & White, S. D. M. 1997, MNRAS, 286, 865
- [] Tornatore, L., Borgani, S., Matteucci, F., Recchi, S., & Tozzi, P. 2004, MNRAS, 349, L19
- [] Umeda, H., Nomoto, K., Tsuru, T. G., & Matsumoto, H. 2002, ApJ, 578, 855
- [] Weinberg, D. H., Colombi, S., Davé, R., & Katz, N. 2008, ApJ, 678, 6
- [] Yepes, G., Martínez-Vaquero, L. A., Gottlöber, S., & Hoffman, Y. 2009, American Institute of Physics Conference Series, 1178, 64
- [] Zhao, D., Jing, Y. P., Börner, G. 2002, ApJ, 581, 876