11email: ctsourak@cs.cmu.edu, 11email: tolliver@cs.cmu.edu
22institutetext: Center for Neuroscience University of Pittsburgh, Center for the Neural Basis of Cognition, USA
22email: mat90@pitt.edu
33institutetext: Departments of Oncology and Human Genetics, Drexel University, USA
44institutetext: Department of Biological Sciences, Carnegie Mellon University, USA
44email: russells@andrew.cmu.edu
CGHTRIMMER: Discretizing noisy Array CGH Data
Abstract
The development of cancer is largely driven by the gain or loss of subsets of the genome, promoting uncontrolled growth or disabling defenses against it. Identifying genomic regions whose DNA copy number deviates from the normal is therefore central to understanding cancer evolution. Array-based comparative genomic hybridization (aCGH) is a high-throughput technique for identifying DNA gain or loss by quantifying total amounts of DNA matching defined probes relative to healthy diploid control samples. Due to the high level of noise in microarray data, however, interpretation of aCGH output is a difficult and error-prone task.
In this work, we tackle the computational task of inferring the DNA copy number per genomic position from noisy aCGH data. We propose CGHtrimmer, a novel segmentation method that uses a fast dynamic programming algorithm to solve for a least-squares objective function for copy number assignment. CGHtrimmer consistently achieves superior precision and recall to leading competitors on benchmarks of synthetic data and real data from the Coriell cell lines. In addition, it finds several novel markers not recorded in the benchmarks but plausibly supported in the oncology literature. Furthermore, CGHtrimmer achieves superior results with run-times from 1 to 3 orders of magnitude faster than its state-of-art competitors.
CGHtrimmer provides a new alternative for the problem of aCGH discretization that provides superior detection of fine-scale regions of gain or loss yet is fast enough to process very large data sets in seconds. It thus meets an important need for methods capable of handling the vast amounts of data being accumulated in high-throughput studies of tumor genetics.
1 Introduction
Tumorigenesis is a complex phenomenon often characterized by the successive acquisition of combinations of genetic aberrations that result in malfunction or disregulation of genes. There are many forms of chromosome aberration that can contribute to cancer development, including polyploidy, aneuploidy, interstitial deletion, reciprocal translocation, non-reciprocal translocation, as well as amplification, again with several different types of the latter (e.g., double minutes, HSR and distributed insertions [1]). Identifying the specific recurring aberrations, or sequences of aberrations, that characterize particular cancers provides important clues about the genetic basis of tumor development and possible targets for diagnostics or therapeutics. Many other genetic diseases are also characterized by gain or loss of genetic regions, such as Down Syndrome (trisomy 21) [24], Cri du Chat (5p deletion) [25], and Prader-Willi syndrome (deletion of 15q11-13) [5] and recent evidence has begun to suggest that inherited copy number variations are far more common and more important to human health than had been suspected just a few years ago [45]. These facts have created a need for methods for assessing DNA copy number variations in individual organisms or tissues.
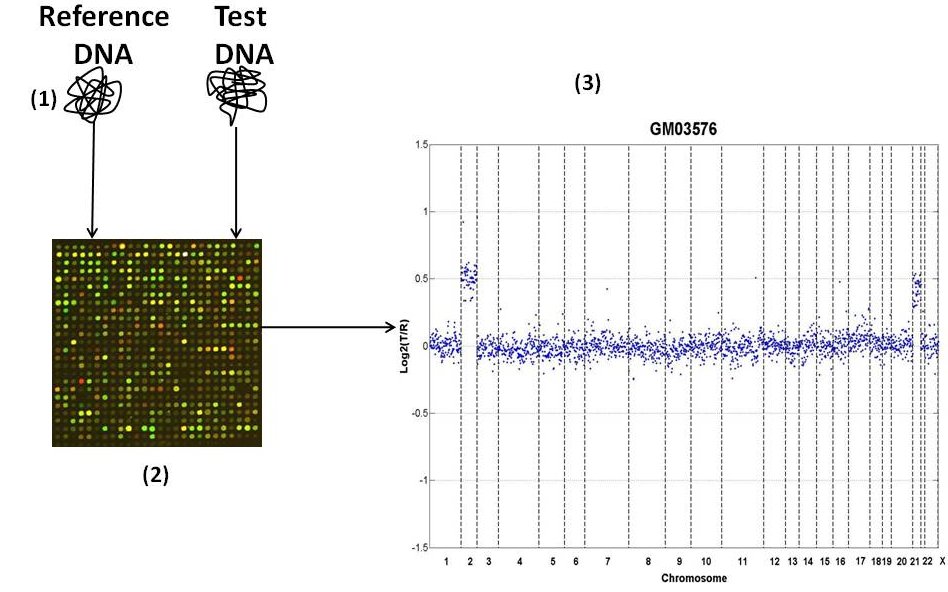
In this work, we focus specifically on array-based comparative genomic hybridization (aCGH) [4, 35, 18, 34], a method for copy number assessment using DNA microarrays that remains, for the moment, the leading approach for high-throughput typing of copy number abnormalities. The technique of aCGH is schematically represented in Figure 1. A test and a reference DNA sample are differentially labeled and hybridized to a microarray and the ratios of their fluorescence intensities is measured for each spot. A typical output of this process is shown in Figure 1 (3), where the genomic profile of the cell line GM05296 [39] is shown for each chromosome. The x-axis corresponds to genomic position and the y-axis corresponds to a noisy measurement of the ratio for each genomic position. For healthy diploid organisms, =2 and is the DNA copy number we want to infer from the noisy measurements. For more details on the use of aCGH to detect different types of chromosomal aberrations, see [1].
Converting raw aCGH log fluorescence ratios into discrete DNA copies numbers is an important but non-trivial problem in using aCGH to study cancer progression. Finding DNA regions that consistently exhibit chromosomal losses or gains in cancers provides a crucial means for locating the specific genes involved in development of different cancer types. It is therefore important to distinguish, when a probe shows unusually high or low fluorescence, whether that aberrant signal reflects experimental noise or a probe that is truly found in a segment of DNA that is gained or lost. Furthermore, successful discretization of array CGH data is crucial for understanding the process of cancer evolution, since discrete inputs are required for a large family of successful evolution algorithms, e.g., [8, 9]. It is worth noting that manual annotation of such regions, even if possible [39], is tedious and prone to mistakes due to several sources of noise (impurity of test sample, noise from array CGH method, etc.).
Many algorithms and objective functions have thus been proposed for the problem of discretizing and segmenting aCGH data. Many methods, starting with Fridlyand et al. [11], treat aCGH segmentation as a hidden Markov model (HMM) inference problem. The HMM approach has since been extended in various ways, such as through the use of Bayesian HMMs [12], incorporation of prior knowledge of locations of DNA copy number polymorphisms [37], and the use of Kalman filters [38]. Other approaches include wavelet decompositions [14], quantile regression [10], expectation-maximization in combination with edge-filtering [27], genetic algorithms [17], clustering-based methods [44, 42], variants on Lasso regression [40, 15], and various problem-specific Bayesian [2], likelihood [16], and other statisical models [26]. A dynamic programming approach, in combination with expectation maximimization, has been previously used by Picard et al. [33]. Lai et al. [21] and Willenbrock et al. [43] have conducted extensive experimental analysis of the range of available methods, with two in particular standing out as the leading approaches in practice. One of these top methods is CGHseg [32], which assumes that a given CGH profile is a Gaussian process whose distribution parameters are affected by abrupt changes at unknown coordinates/breakpoints. The other is Circular Binary Segmentation [30] (CBS), a modification of binary segmentation, originally proposed by Sen and Srivastava [36], which uses a statistical comparison of mean expressions of adjacent windows of nearby probes to identify possible breakpoints between segments combined with a greedy algorithm to locally optimize breakpoint positions.
Our main contribution in this work is a new algorithm, CGHtrimmer, for denoising and segmentation of aCGH data. We develop a novel objective function for the problem based on least-squares minimization of errors combined with a regularization parameter to favor contiguity across segments. We show how to solve efficiently for this objective function through dynamic programming. We then validate the method, in comparison to the leading CBS and CGHseg methods, on a combination of synthetic and real benchmarks. Finally, we show that CGHtrimmer yields superior accuracy in identifying known breakpoints while performing one to three orders of magnitude faster than the comparative methods. The remainder of the paper is organized as follows: Section 2 presents our proposed method and its theoretical analysis. Section 3 describes the experimental setup and shows the experimental results of our method compared to two state-of-art methods [30, 32] on both synthetic and real aCGH data. Section 4 concludes the paper with a brief summary and discussion.
2 Proposed Method
| Symbol | Description |
|---|---|
| measurement of in the -th probe | |
| n | number of probes |
| T | DNA copy number |
| R | reference value, equal to 2 for diploid organisms |
| K | number of segments to be fitted |
| regularization parameter | |
| Average of points , | |
| Sum of squared errors | |
| CBS | Circular binary segmentation [30] |
| CGHseg | Picard et al. [32] |
We formulate the problem of denoising aCGH data as a least squares problem with a penalty/regularization term for the number of segments. Table 1 shows the symbols used throughout the paper for convenience. Let be a set of points, . Our goal is to find a sequence of piecewise constant segments which minimize the sum of squared errors per segment and the number of segments . Ideally, our algorithm will fit the data with piecewise constant segments corresponding to the true DNA copy number at each genomic position. The intuition for penalizing the number of segments is that we expect a strong spatial coherence between nearby probes. Gains and losses are likely to occur for DNA segments covering many probes, and adjacent probes should therefore usually have the same copy number. We avoid making explicit assumptions about the statistical nature of the signal (although we note that the least squares method can be interpreted as a maximization of the likelihood function under the assumption that noise derives from identically distributed Gaussian random variables) since we do not believe we have a strong empirical basis for exactly capturing the true correlation structure of aCGH data. To solve this optimization problem, we define the key quantity , given by the following equation:
| (1) |
The recursion equation 1 has a straightforward interpretation: is equal to the minimum cost of fitting a set of piecewise constant segments from point to given that the last change in copy numbers occured between points and plus the cost of fitting a segment is . The second term is the minimum squared error for fitting a constant segment on points , which is obtained for the constant segment with value equal to the average intensity of the points in the segment, i.e., . Recursion 1 directly implies a dynamic programming algorithm, the CGHtrimmer algorithm presented as Algorithm 1. For each point , we find a point such that is the minimum index over all points before such that points through belong to the same segment. Since aCGH data are given in the log scale, we first exponentiate the points, then fit the constant segment by taking the average of the exponentiated values from the hypothesized segment, and then return to the log domain by taking the logarithm of that constant value. Observe that one can fit a constant segment by averaging the log values using Jensen’s inequality, but we favor an approach more consistent with the prior work, which typically models the data assuming i.i.d. Gaussian noise in the linear domain. The algorithm decides which points will be assigned to the same segment by tracing back, starting from the last point , using the breakpoint variables until it assigns the first point to a segment. The main computational bottleneck of CGHtrimmer is the computation of an auxiliary matrix , an upper diagonal matrix for which is the minimum squared error of fitting a segment from points . To avoid a naïve algorithm that would simply find the average of those points and then compute the squared error, resulting in time, we take advantage of the following theorem:
Theorem 2.1
Let and be the average and the minimum squared error of fitting a constant segment for points . Then the following equations hold:
| (2) |
| (3) |
For a proof, see [20]. Equations 2 and 3 provide us a way to compute means and least squared errors online, leading to the Algorithm 2 for computing matrix .
The resulting method has time and space complexity. The algorithm needs to store two matrices, and , in addition to the size- and matrices needed for the dynamic programming. Therefore the space complexity is . The and matrices each have entries and require time to compute each entry, while computing the and entries requires at most time for each of entries. Therefore the total running time is .
3 Results
| Dataset | Availability | |
|---|---|---|
| Lai et al. | [21] | |
| http://compbio.med.harvard.edu/ | ||
| Willenbrock et al. | [43] | |
| http://www.cbs.dtu.dk/~hanni/aCGH/ | ||
| Coriell Cell lines | [39] | |
| http://www.nature.com/ng/journal/v29/n3/ | ||
| Berkeley Breast Cancer | [28] | |
| http://icbp.lbl.gov/breastcancer/ |
This section is organized as follows: first we describe the experimental setup and how we trained our model. Then we present our experimental results on both synthetic and real data.
3.1 Experimental Setup and Datasets
CGHtrimmer is implemented in MATLAB. The experiments run in a 4GB RAM, 2.4GHz Intel(R) Core(TM)2 Duo CPU, Windows Vista machine. Our methods were compared to existing MATLAB implementations of the CBS algorithm, available via the Bioinformatics toolbox, and the CGHseg algorithm, generously provided by by Franc Picard [32]. CGHseg was run using heteroscedastic model under the Lavielle criterion [22]. Additional tests using the homoscedastic model showed substantially worse performance and are omitted here. All methods were compared using previously developed benchmark datasets, shown in Table 2. Follow-up analysis of detected regions was conducted by manually searching for significant genes in the Genes-to-Systems Breast Cancer Database http://www.itb.cnr.it/breastcancer [41] and validating their positions with the UCSC Genome Browser http://genome.ucsc.edu/. The Atlas of Genetics and Cytogenetics in Oncology and Haematology http://atlasgeneticsoncology.org/ was also used to validate the significance of reported cancer-associated genes.
3.2 Picking
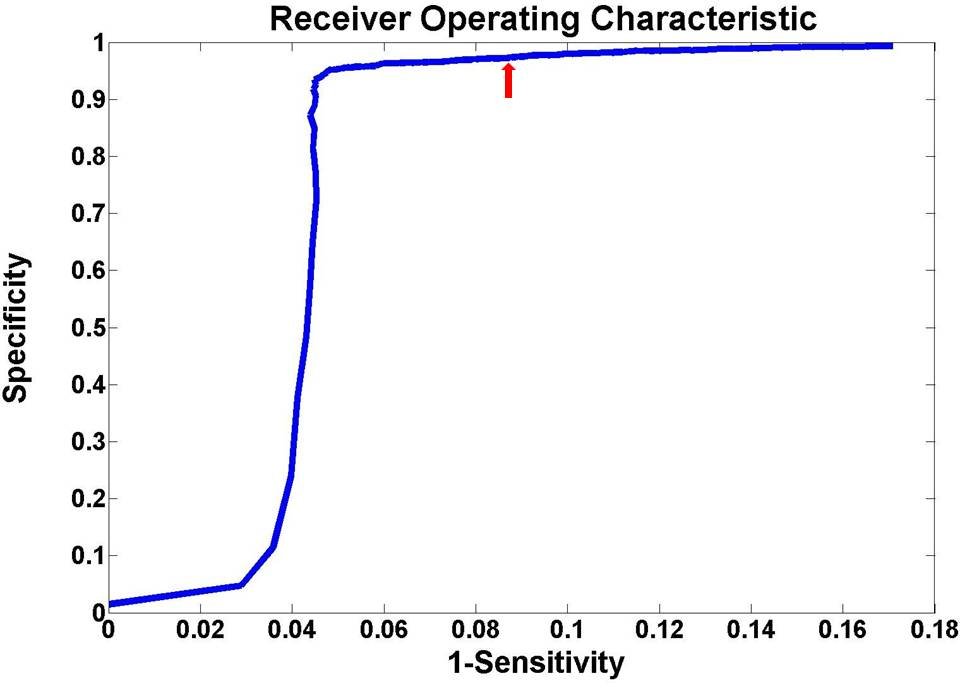
The performance of our algorithm depends on the value of the parameter , which determines how much each segment “costs.” Clearly, there is a tradeoff between bigger and smaller values: excessively large will lead the algorithm to output a single segment while excessively small will result in each point being fit as its own segment. We pick our parameter using data published in [43]. These data have been generated by modeling real CGH data, thus capturing their nature better than other simplified synthetic data and also making them a good training dataset for our model. We used this dataset to generate a Receiver Operating Characteristic (ROC) curve using values for ranging from 0 to 4 with increment 0.01 using one of the four datasets in [43] (“above 20”). The resulting curve is shown in Figure 2. We then selected , which achieves high precision (0.98) and high recall (0.91). All subsequent results reported were obtained by setting equal to 0.2.


3.3 Synthetic Data
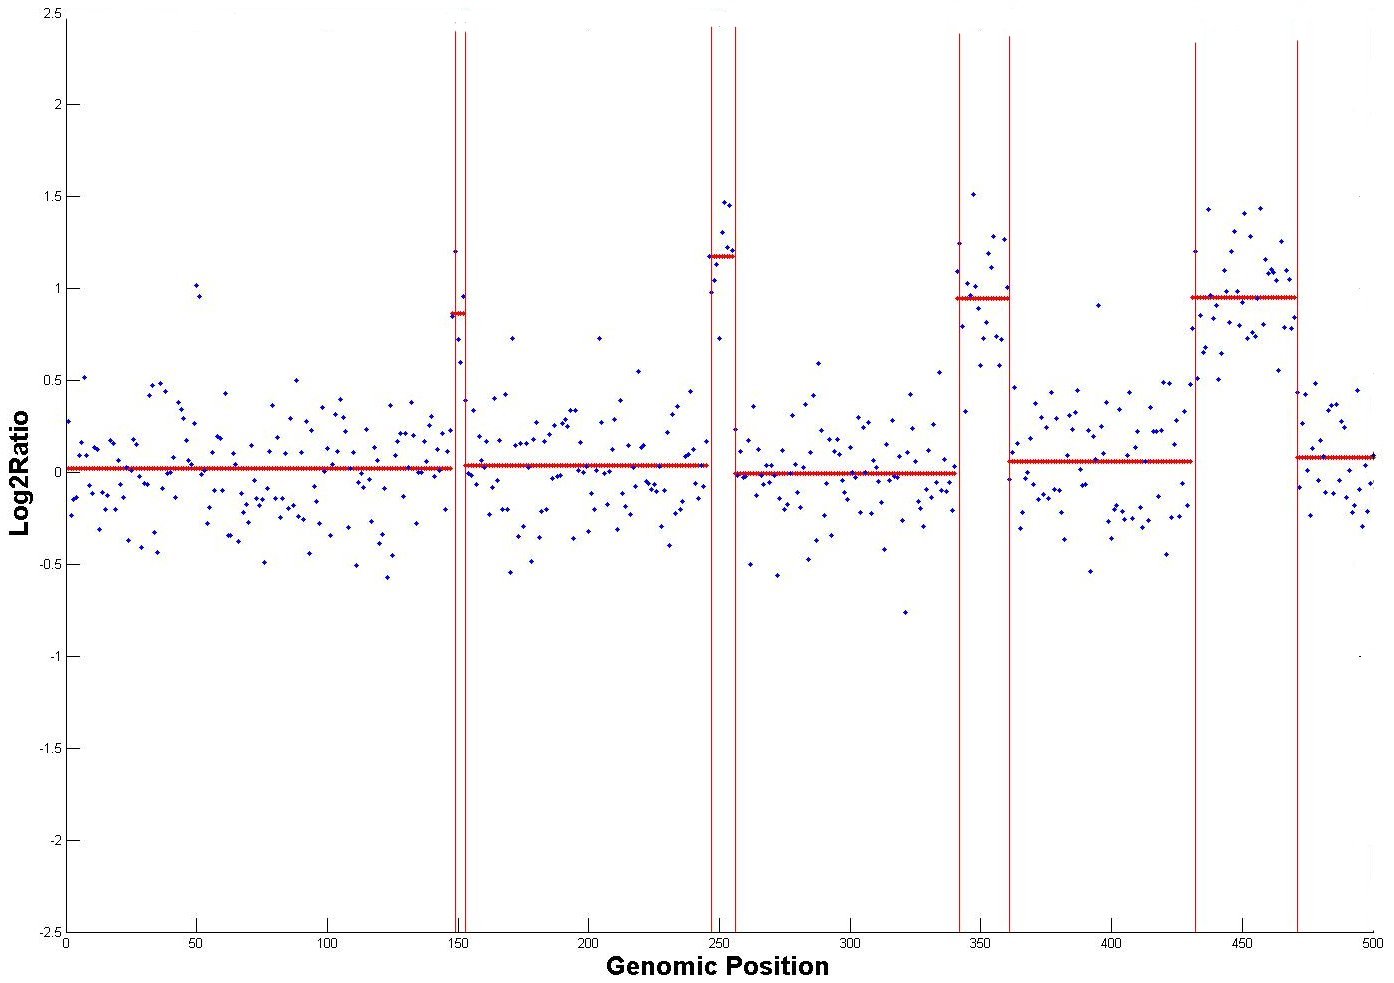
We use the synthetic data published in [21]. The data consist of five aberrations of increasing widths of 2, 5, 10, 20 and 40 probes, respectively, with Gaussian noise N(0,0.252). Figure 3 shows the performance of CGHtrimmer, CBS, and CGHseg. Both CGHtrimmer and CGHseg correctly detect all aberrations, while CBS misses the first, smallest region. Run time for CGHtrimmer is 0.007 sec, compared to 1.23 sec for CGHseg and 60 sec for CBS.
3.4 Coriell Cell Lines
| Cell Line/Chromosome | CGHtrimmer | CBS | CGHseg |
| GM03563/3 | ✓ | ✓ | ✓ |
| GM03563/9 | ✓ | No | ✓ |
| GM03563/False | - | - | - |
| GM00143/18 | ✓ | ✓ | ✓ |
| GM00143/False | - | - | - |
| GM05296/10 | ✓ | ✓ | ✓ |
| GM05296/11 | ✓ | ✓ | ✓ |
| GM05296/False | - | - | 4,8 |
| GM07408/20 | ✓ | ✓ | ✓ |
| GM07408/False | - | - | - |
| GM01750/9 | ✓ | ✓ | ✓ |
| GM01750/14 | ✓ | ✓ | ✓ |
| GM01750/False | - | - | - |
| GM03134/8 | ✓ | ✓ | ✓ |
| GM03134/False | - | - | 1 |
| GM13330/1 | ✓ | ✓ | ✓ |
| GM13330/4 | ✓ | ✓ | ✓ |
| GM13330/False | - | - | - |
| GM03576/2 | ✓ | ✓ | ✓ |
| GM03576/21 | ✓ | ✓ | ✓ |
| GM03576/False | - | - | - |
| GM01535/5 | ✓ | ✓ | ✓ |
| GM01535/12 | ✓ | No | ✓ |
| GM01535/False | - | - | 8 |
| GM07081/7 | ✓ | ✓ | ✓ |
| GM07081/15 | No | No | No |
| GM07081/False | - | - | 11 |
| GM02948/13 | ✓ | ✓ | ✓ |
| GM02948/False | 7 | 1 | 2 |
| GM04435/16 | ✓ | ✓ | ✓ |
| GM04435/21 | ✓ | ✓ | ✓ |
| GM04435/False | - | - | 8,17 |
| GM10315/22 | ✓ | ✓ | ✓ |
| GM10315/False | - | - | - |
| GM13031/17 | ✓ | ✓ | ✓ |
| GM13031/False | - | - | - |
| GM01524/6 | ✓ | ✓ | ✓ |
| GM01524/False | - | - | - |
The first real dataset we use to evaluate our method is the Coriell cell line BAC array CGH data [39], which is widely considered a “gold standard” dataset. The dataset is derived from 15 fibroblast cell lines using the normalized average of fluorescence relative to a diploid reference. To call gains or losses of inferred segments, we assign each segment the mean intensity of its probes and then apply a simple threshold test to determine if the mean is abnormal. We follow [3] in favoring 0.3 out of the wide variety of thresholds that have been used [29].
Table 3 summarizes the performance of CGHtrimmer, CBS and CGHseg relative to previously annotated gains and losses in the Corielle dataset. The table shows notably better performance for CGHtrimmer compared to either alternative method. CGHtrimmer finds 22 of 23 expected segments with one false positive. CBS finds 20 of 23 expected segments with one false positive. CGHseg finds 22 of 23 expected segments with seven false positives. CGHtrimmer thus achieves the same recall as CGHseg while outperforming it in precision and the same precision as CBS while outperforming it in recall. In cell line GM03563, CBS fails to detect a region of two points which have undergone a loss along chromosome 9, in accordance with the results obtained using the Lai et al. [21] synthetic data. In cell line GM03134, CGHseg makes a false positive along chromosome 1 which both CGHtrimmer and CBS avoid. In cell line GM01535, CGHseg makes a false positive along chromosome 8 and CBS misses the aberration along chromosome 12. CGHtrimmer, however, performs ideally on this cell line. In cell line GM02948, CGHtrimmer makes a false positive along chromosome 7, finding a one-point segment in 7q21.3d at genomic position 97000 whose value is equal to 0.732726. All other methods also make false positive errors on this cell line. In GM7081, all three methods fail to find an annotated aberration on chromosome 15. In addition, CGHseg finds a false positive on chrosome 11.
CGHtrimmer also substantially outperforms the comparative methods in run time, requiring 5.78 sec for the full data set versus 8.15 min for CGHseg (an 84.6-fold speedup) and 47.7 min for CBS (a 495-fold speedup).
3.5 Breast Cancer Cell Lines
To further illustrate the performance of CGHtrimmer and compare it to CBS and CGHseg, we applied it to the Berkeley Breast Cancer cell line database [28]. The dataset consists of 53 breast cancer cell lines that capture most of the recurrent genomic and transcriptional characteristics of 145 primary breast cancer cases. We do not have an accepted “answer key” for this data set, but it provides a more extensive basis for detailed comparison of differences in performance of the methods on common data sets, as well as an opportunity for novel discovery. While we have applied the methods to all chromosomes in all cell lines, space limitations prevent us presenting the full results here. We therefore arbitrarily selected three of the 53 cell lines and selected three chromosomes per cell line that we believed would best illustrate the comparative performance of the methods. The Genes-to-Systems Breast Cancer Database http://www.itb.cnr.it/breastcancer [41] was used to identify known breast cancer markers in regions predicted to be gained or lost by one or more of the methods, with the UCSC Genome Browser http://genome.ucsc.edu/ used to verify the placement of genes.
We note that CGHtrimmer again had a substantial advantage in run time. For the full data set, CGHtrimmer required 22.76 sec, compared to 23.3 min for CGHseg (a 61.5-fold increase), and 4.95 hrs for CBS (a 783-fold increase).
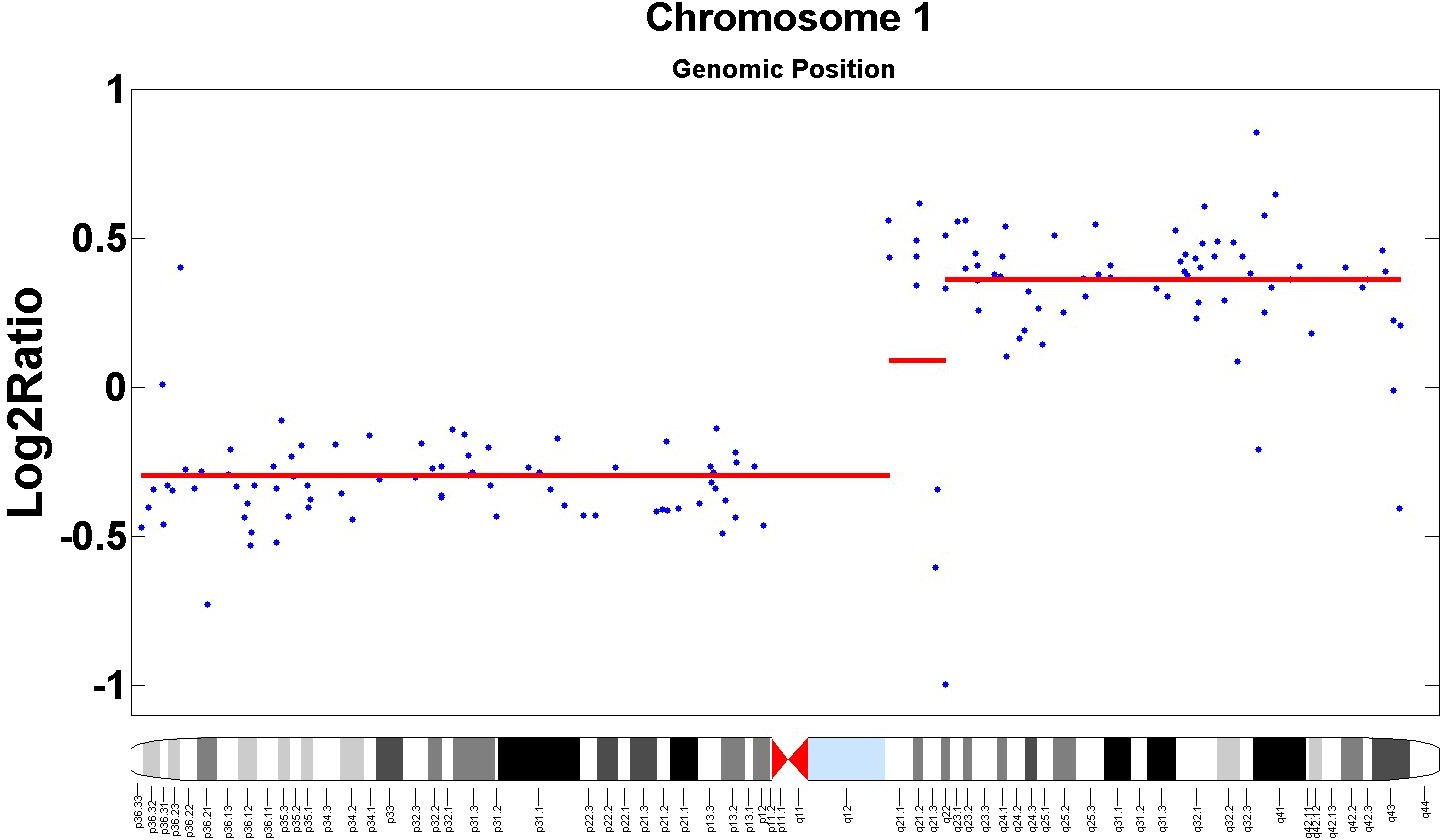
Cell Line BT474:
Figure 4 shows the performance of each method on the BT474 cell line. The three methods report different results for chromsome 1, as shown in Figures 4(a,b,c), with all three detecting amplification in the q-arm but differing in the detail of resolution. CGHtrimmer is the only method that detects region 1q31.2-1q31.3 as aberrant. This regions hosts gene NEK7, a candidate oncogene [19] and gene KIF14, a predictor of grade and outcome in breast cancer [7]. CGHtrimmer and CBS annotate the region 1q23.3-1q24.3 as amplified. This region hosts several genes previously implicated in breast cancers [41], such as CREG1 (1q24), POU2F1 (1q22-23), RCSD1 (1q22-q24), and BLZF1 (1q24). Finally, CGHtrimmer alone reports independent amplification of the gene CHRM3, a a marker of metastasis in breast cancer patients [41].
 |
 |
 |
| (a) | (b) | (c) |
 |
 |
 |
| (d) | (e) | (f) |
 |
 |
 |
| (g) | (h) | (i) |
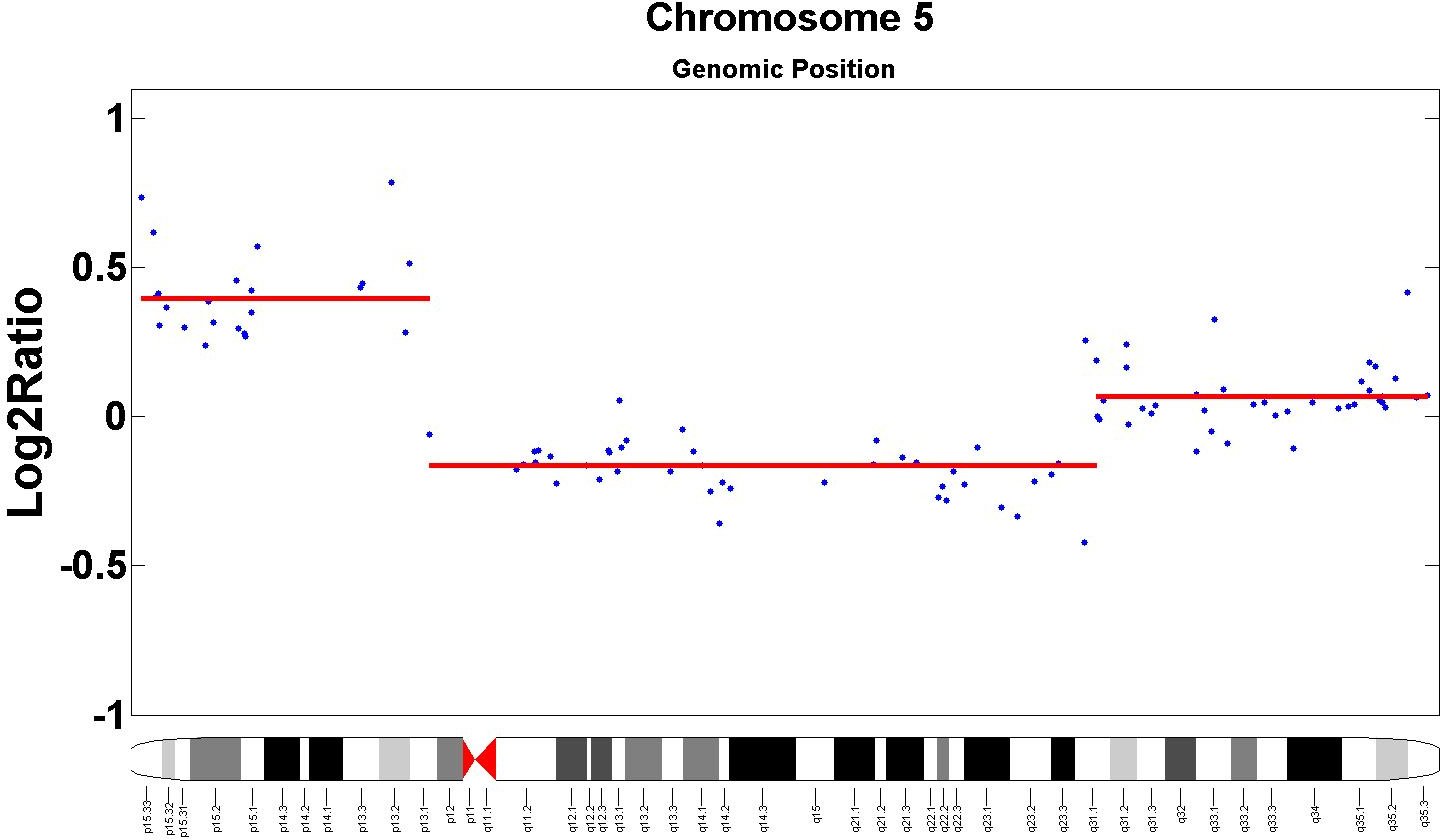
For chromosome 5 (Figures 4(d,e,f)), the behavior of the three methods is almost identical, with all three reporting amplification of a region known to contain many breast cancer markers, including MRPL36 (5p33), ADAMTS16 (5p15.32), POLS (5p15.31), ADCY2 (5p15.31), CCT5 (5p15.2), TAS2R1 (5p15.31), ROPN1L (5p15.2), DAP (5p15.2), ANKH (5p15.2), FBXL7 (5p15.1), BASP1 (5p15.1), CDH18 (5p14.3), CDH12 (5p14.3), CDH10 (5p14.2 - 5p14.1), CDH9 (5p14.1) PDZD2 (5p13.3), GOLPH3 (5p13.3), MTMR12 (5p13.3), ADAMTS12 (5p13.3 - 5p13.2), SLC45A2 (5p13.2), TARS (5p13.3), RAD1 (5p13.2), AGXT2 (5p13.2), SKP2 (5p13.2), NIPBL (5p13.2), NUP155 (5p13.2), KRT18P31 (5p13.2), LIFR (5p13.1) and GDNF (5p13.2) [41]. The only difference in the assignments is that CBS fits one more probe to this amplified segment.
Finally, for chromosome 17 (Figures 4(g,h,i)), like chromosome 1, all three detect amplification but CGHtrimmer predicts a finer breakdown of the amplified region into independently amplified segments. All three detect amplification of a region including the major breast cancer biomarkers HER2 (17q21.1) and BRCA1 (17q21) and the additional markers MSI2 (17q23.2) and TRIM37 (17q23.2) [41]. While the more discontiguous picture produced by CGHtrimmer may appear to be a less parsimonious explanation of the data, a complex combination of fine-scale gains and losses in 17q is in fact well supported by the literature [31].
Cell Line HS578T:
 |
 |
 |
| (a) | (b) | (c) |
 |
 |
 |
| (d) | (e) | (f) |
 |
 |
 |
| (g) | (h) | (i) |
Figure 5 compares the methods on cell line HS578T for chromosomes 3, 11 and 17. Chromosome 3 (Figures 5(a,b,c)) shows identical prediction of an amplification of 3q24-3qter for all three methods, a region including the key breast cancer markers PIK3CA (3q26.32) [23], and additional breast-cancer-associated genes TIG1 (3q25.32), MME (3q25.2), TNFSF10 (3q26), MUC4 (3q29), TFRC (3q29), DLG1 (3q29) [41]. CGHtrimmer and CGHseg also have identical predictions of normal copy number in the p-arm, while CBS reports an additional loss between 3p21 and 3p14.3. We are unaware of any known gain or loss in this region associated with breast cancer.
For chromosome 11 (Figures 5(d,e,f)), the methods again present an identical picture of loss at the q-terminus (11q24.2-11qter) but detect amplifications of the p-arm at different levels of resolution. CGHtrimmer and CBS detect gain in the region 11p15.5, the site of the HRAS breast cancer metastasis marker [41]. In contrast to CBS, CGHtrimmer detects an adjacent loss region. While we have no direct evidence this loss is a true finding, the region of predicted loss does contain EIF3F (11p15.4), identified as a possible tumor suppressor whose expression is decreased in most pancreatic cancers and melanomas [41]. We can thus conjecture that EIF3F is also a tumor suppressor in breast cancers.
 |
 |
 |
| (a) | (b) | (c) |
 |
 |
 |
| (d) | (e) | (f) |
 |
 |
 |
| (g) | (h) | (i) |
On chromosome 17 (Figures 5(g,h,i)), the three methods behave similarly, with all three predicting amplification of the p-arm. CBS places one more marker in the amplified region causing it to cross the centromere while CGHseg breaks the amplified region into three segments by predicting additional amplification at a single marker.
Cell Line T47D:
Figure 6 compares the methods on chromosomes 1, 8, and 20 of cell line T47D. On chromosome 1 (Figure 6(a,b,c)), all three methods detect loss of the p-arm and predominant amplification of the q-arm. CBS infers a presumably spurious extension of the p-arm loss across the centromere into the q-arm, while the other methods do not. The main differences between the three methods appear on the q-arm of chromosome 1. CGHtrimmer and CGHseg both detect a small region of gain proximal to the centromere at 1q21.1-1q21.2, followed by a short region of loss spanning 1q21.3-1q22. CBS merges these into a single longer region of normal copy number. The existence of a small region of loss at this location in breast cancers is supported by prior literature [6].
The three methods provide comparable segmentations of chromosome 11 (Figure 6(d,e,f)). All predict loss near the p-terminus, a long segment of amplification stretching across much of the p- and q-arms, and additional amplification near the q-terminus. CGHtrimmer, however, breaks this q-terminal amplification into several sub-segments at different levels of amplification while CBS and CGHseg both fit a single segment to that region. We have no empirical basis for determining which segmentation is correct here. CGHtrimmer does appear to provide a spurious break in the long amplified segment that is not predicted by the others.
Finally, along chromosome 20 (Figure 6(g,h,i)), the output of the methods is similar, with all three methods suggest that the q-arm has an aberrant copy number, an observation consistent with prior studies [13]. The only exception is again that CBS fits one point more than the other two methods along the first segment, causing a likely spurious extension of the p-arm’s normal copy number into the q-arm.
4 Conclusions
We have presented CGHtrimmer, a new algorithm for detecting genomic regions of loss or gain in aCGH data. We compared CGHtrimmer to two widely used methods, CBS [30] and CGHseg [32] that have previously been identified as the most successful among many options in the literature [21]. CGHtrimmer shows performance identical to CGHseg and superior to CBS on a synthetic benchmark and superior performance to both on a benchmark of real cell line data. Further demonstration of the methods on selected regions from a large breast cancer cell line dataset suggests that CGHtrimmer is generally superior at detecting fine-scale variations in aCGH data, while avoiding apparently spurious or misplaced breakpoints assigned by the other methods. Where results differ between the methods, there is usually good support in the literature for the CGHtrimmer segmentation. Furthermore, CGHtrimmer achieves superior accuracy with run times more than 50-fold faster than CGHseg and more than 500-fold faster than CBS.
Acknowledgement
The authors would like to thank F. Picard for providing the MATLAB for the method of [32] and Ayshwarya Subramanian for helpful discussions.
Funding
The authors were supported in this work by U.S. National Institutes of Health award # 1R01CA140214.
References
- [1] D. Albertson and D. Pinkel. Genomic microarrays in human genetic disease and cancer. Human Molecular Genetics, 12:145–152, 2003.
- [2] D. Barry and J. A. Hartigan. A bayesian analysis for change point problems. Journal of the American Statistical Association, 88(421):309–319, 1993.
- [3] B. Bejjani, R. Saleki, B. Ballif, E. Rorem, K. Sundin, A. Theisen, C. Kashork, and L. Shaffer. Use of targeted array-based cgh for the clinical diagnosis of chromosomal imbalance: is less more? Am J Med Genet A., pages 259–67, 2005.
- [4] G. Bignell, J. Huang, J. Greshock, S. Watt, A. Butler, S. West, M. Grigorova, K. Jones, W. Wei, M. Stratton, A. Futreal, B. Weber, M. Shapero, and R. Wooster. High-resolution analysis of dna copy number using oligonucleotide microarrays. Genome Research, pages 287–295, 2004.
- [5] M. G. Butler, F. J. Meaney, and C. G. Palmer. Clinical and cytogenetic survey of 39 individuals with prader-labhart-willi syndrome. American Journal of Medical Genetics, 23:793–809, 1986.
- [6] N. Chunder, S. Mandal, D. Basu, A. Roy, S. Roychoudhury, and C. K. Panda. Deletion mapping of chromosome 1 in early onset and late onset breast tumors–a comparative study in eastern india. Pathol Res Pract, 199:313–321, 2003.
- [7] T. Corson, A. Huang, M.-S. Tsao, and B. L. Gallie. Kif14 is a candidate oncogene in the 1q minimal region of genomic gain in multiple cancers. Oncogene, 24:4741–4753, 2005.
- [8] R. Desper, F. Jiang, O.-P. Kallioniemi, H. Moch, C. H. Papadimitriou, and A. A. Schäffer. Inferring tree models for oncogenesis from comparative genome hybridization data. Journal of Computational Biology, 6(1):37–52, 1999.
- [9] R. Desper, F. Jiang, O.-P. Kallioniemi, H. Moch, C. H. Papadimitriou, and A. A. Schäffer. Distance-based reconstruction of tree models for oncogenesis. Journal of Computational Biology, 7(6):789–803, 2000.
- [10] P. H. Eilers and R. X. de Menezes. Quantile smoothing of array cgh data. Bioinformatics, 21(7):1146–1153, April 2005.
- [11] J. Fridlyand, A. M. Snijders, D. Pinkel, D. G. Albertson, and A. N. Jain. Hidden markov models approach to the analysis of array cgh data. J. Multivar. Anal., 90(1):132–153, 2004.
- [12] S. Guha, Y. Li, and D. Neuberg. Bayesian hidden markov modeling of array cgh data. Harvard University, Paper 24, 2006.
- [13] J. Hodgson, K. Chin, C. Collins, and J. Gray. Genome amplification of chromosome 20 in breast cancer. Breast Cancer Res Treat., 2003.
- [14] L. Hsu, S. Self, D. Grove, Randolph, K. Wang, J. Delrow, L. Loo, and P. Porter. Denoising array based comparative genomic hybridization data using wavelets. Biostatistics, 6:211–226, 2005.
- [15] T. Huang, B. Wu, P. Lizardi, and H. Zhao. Detection of dna copy number alterations using penalized least squares regression. Bioinformatics, 21:3811–3817, 2005.
- [16] P. Hupé, N. Stransky, J.-P. Thiery, F. Radvanyi, and E. Barillot. Analysis of array cgh data: from signal ratio to gain and loss of dna regions. Bioinformatics, 20(18):3413–3422, 2004.
- [17] K. Jong, E. Marchiori, G. Meijer, A. van der Vaart, and B. Ylstra. Breakpoint identification and smoothing of array comparative genomic hybridization data. Bioinformatics, 20(18):3636–3637, 2004.
- [18] A. Kallioniemi, O. Kallioniemi, D. Sudar, D. Rutovitz, J. Gray, F. Waldman, and D. Pinkel. Comparative genomic hybridization for molecular cytogenetic analysis of solid tumors. Science, 258(5083):818–821, 1992.
- [19] M. Kimura and Y. Okano. Identification and assignment of the human nima-related protein kinase 7 gene (nek7) to human chromosome 1q31.3. Cytogenet. Cell Genet., 2001.
- [20] D. E. Knuth. Seminumerical Algorithms. Addison-Wesley, 1981.
- [21] W. R. Lai, M. D. Johnson, R. Kucherlapati, and P. J. Park. Comparative analysis of algorithms for identifying amplifications and deletions in array cgh data. Bioinformatics, 21(19):3763–3770, 2005.
- [22] M. Lavielle. Using penalized contrasts for the change-point problem. Signal Processing, 85(8):1501–1510, 2005.
- [23] J. W. Lee, Y. H. Soung, S. Y. Kim, H. W. Lee, W. S. Park, S. W. Nam, S. H. Kim, J. Y. Lee, N. J. Yoo, , and S. H. Lee. Pik3ca gene is frequently mutated in breast carcinomas and hepatocellular carcinomas. Oncogene, 2005.
- [24] J. Lejeune, M. Gautier, and R. Turpin. Etude des chromosomes somatiques de neuf enfants mongoliens. Comptes Rendus Hebdomadaires des Seances de l’Academie des Sciences (Paris), 248(11):1721–1722, 1959.
- [25] J. Lejeune, J. Lafourcade, R. Berger, J. Vialatta, M. Boeswillwald, P. Seringe, and R. Turpin. Trois ca de deletion partielle du bras court d’un chromosome 5. Compte Rendus de l’Academie des Sciences (Paris), 257:3098, 1963.
- [26] D. Lipson, Y. Aumann, A. Ben-Dor, N. Linial, and Z. Yakhini. Efficient calculation of interval scores for dna copy number data analysis. In RECOMB, pages 83–100, 2005.
- [27] C. L. Myers, M. J. Dunham, S. Y. Kung, and O. G. Troyanskaya. Accurate detection of aneuploidies in array cgh and gene expression microarray data. Bioinformatics, 20(18):3533–3543, December 2004.
- [28] R. Neve, K. Chin, J. Fridlyand, J. Yeh, F. Baehner, T. Fevr, N. Clark, N. Bayani, J. Coppe, and F. Tong. A collection of breast cancer cell lines for the study of functionally distinct cancer subtypes. Cancer Cell, 10:515–527, 2006.
- [29] G. Ng, J. Huang, I. Roberts, and N. Coleman. Defining ploidy-specific thresholds in array comparative genomic hybridization to improve the sensitivity of detection of single copy alterations in cell lines. Journal of Molecular Diagnostics, 2006.
- [30] A. B. Olshen, E. S. Venkatraman, R. Lucito, and M. Wigler. Circular binary segmentation for the analysis of array-based dna copy number data. Biostatistics, 5(4):557–572, October 2004.
- [31] B. Orsetti, M. Nugoli, N. Cervera, L. Lasorsa, P. Chuchana, L. Ursule, C. Nguyen, R. Redon, S. du Manoir, C. Rodriguez, and C. Theillet. Genomic and expression profiling of chromosome 17 in breast cancer reveals complex patterns of alterations and novel candidate genes. Cancer Research, 2004.
- [32] F. Picard, S. Robin, M. Lavielle, C. Vaisse, and J. J. Daudin. A statistical approach for array cgh data analysis. BMC Bioinformatics, 6, 2005.
- [33] F. Picard, S. Robin, E. Lebarbier, and J. J. Daudin. A segmentation/clustering model for the analysis of array cgh data. Biometrics, 63, 2007.
- [34] D. Pinkel, R. Segraves, D. Sudar, S. Clark, I. Poole, D. Kowbel, C. Collins, W.-L. Kuo, C. Chen, and Y. Zha. High resolution analysis of DNA copy number variation using comparative genomic hybridization to microarrays. Nature Genetics, 25:207 – 211, 1998.
- [35] J. R. Pollack, C. M. Perou, A. A. Alizadeh, M. B. Eisen, A. Pergamenschikov, C. F. Williams, S. S. Jeffrey, D. Botstein, and P. O. Brown. Genome-wide analysis of dna copy-number changes using cdna microarrays. Nature Genetics, 23:4146, 1999.
- [36] A. Sen and M. Srivastava. On tests for detecting change in mean. Annals of Statistics, 3:98–108, 1975.
- [37] S. P. Shah, X. Xuan, R. J. Deleeuw, M. Khojasteh, W. L. Lam, R. Ng, and K. P. Murphy. Integrating copy number polymorphisms into array cgh analysis using a robust hmm. Bioinformatics, 22(14), July 2006.
- [38] Y. Shi, F. Guo, W. Wu, and E. P. Xing. Gimscan: A new statistical method for analyzing whole-genome array cgh data. In RECOMB, pages 151–165, 2007.
- [39] A. Snijders, N. Nowak, R. Segraves, S. Blackwood, N. Brown, J. Conroy, G. Hamilton, A. Hindle, B. Huey, K. Kimura, S. Law, K. Myambo, J. Palmer, B. Ylstra, J. Yue, J. Gray, A. Jain, D. Pinkel, and D. Albertson. Assembly of microarrays for genome-wide measurement of DNA copy number. Nature Genetics, 29:263–264, 2001.
- [40] R. Tibshirani and P. Wang. Spatial smoothing and hot spot detection for cgh data using the fused lasso. Biostatistics (Oxford, England), 9(1):18–29, January 2008.
- [41] F. Viti, E. Mosca, I. Merelli, A. Calabria, R. Alfieri, and L. Milanesi. Ontological enrichment of the Genes-to-Systems Breast Cancer Database. Communications in Computer and Information Science, 46:178–182, 2009.
- [42] P. Wang, Y. Kim, J. Pollack, B. Narasimhan, and R. Tibshirani. A method for calling gains and losses in array cgh data. Biostatistics, 6(1):45–58, January 2005.
- [43] H. Willenbrock and J. Fridlyand. A comparison study: applying segmentation to array cgh data for downstream analyses. Bioinformatics, 21(22):4084–4091, November 2005.
- [44] B. Xing, C. Greenwood, and S. Bull. A hierarchical clustering method for estimating copy number variation. Biostatistics, 8:632–653, 2007.
- [45] F. Zhang, W. Gu, M. E. Hurles, and J. R. Lupski. Copy number variation in human health, disease, and evolution. Annual Review of Genomics and Human Genetics, 10:451–481, 2009.