HST SPECTROPHOTOMETRY AND MODELS FOR SOLAR ANALOGS
Abstract
Absolute flux distributions for seven solar analog stars are measured from 0.3 to 2.5 m by HST spectrophotometry. In order to predict the longer wavelength mid-IR fluxes that are required for JWST calibration, the HST SEDs are fit with Castelli & Kurucz model atmospheres; and the results are compared with fits from the MARCS model grid. The rms residuals in 10 broad band bins are all 0.5% for the best fits from both model grids. However, the fits differ systematically: The MARCS fits are 40–100 K hotter in , 0.25–0.80 higher in , 0.01–0.10 higher in , and 0.008–0.021 higher in the reddening , probably because their specifications include different metal abundances. Despite these differences in the parameters of the fits, the predicted mid-IR fluxes differ by only 1%; and the modeled flux distributions of these G stars have an estimated ensemble accuracy of 2% out to 30 m.
1 Introduction
The James Webb Space Telescope (JWST) requires flux standards in the 0.8–30 m region. To define reference absolute flux distributions at the longer wavelengths, stellar model SEDs can be anchored to precision Hubble Space Telescope (HST) spectrophotometry at 0.3–2.5 m and extrapolated into the mid-IR. A variety of stellar types helps guard against systematic effects in the modeling and extrapolation process, while several standards of each type provide a statistical reduction of the random errors in the measured fluxes and in the fitting process. Three types: white dwarfs (WDs), A stars, and G stars are chosen because of the precision of the existing HST spectrophotometry from the STIS () and NICMOS () instruments. For this paper, the SEDs of seven G stars are determined by STIS spectra in the wavelength region below 1 m, while the longer wavelengths to 2.5 m are based on NICMOS grism data. These seven SEDs are archived in the CALSPEC database of HST flux standards111http://www.stsci.edu/hst/observatory/cdbs/calspec.html/ as *_stisnic_003.fits and include vectors of estimates of the statistical and systematic uncertainties, the resolution (FWHM), the data quality, and the total exposure time, in addition to the wavelength and flux vectors.
The pure hydrogen WD stars G191B2B, GD71, and GD153 are the primary calibrators for the HST spectrophotometry; and these three reference SEDs show internal consistency to better than 1% (Bohlin 2007, Bohlin, Riess, & de Jong 2006; Bohlin, Dickinson, & Calzetti 2001.) The fainter WD LDS749B fits the continuum of its pure helium model to a similar excellent accuracy (Bohlin & Koester 2008). Nine A star standards have been published by Bohlin & Cohen (2008) and are also observed by the Infrared Array Camera (IRAC) on the Spitzer Space Telescope (Reach et al. 2005). Seven of these resolution NICMOS flux distributions fit their A star model SEDs to 1%.
In addition to the Castelli & Kurucz (2004 CK04) grid used by Bohlin & Cohen (2008) to model the A stars, the MARCS222http://www.marcs.astro.uu.se grid (Gustafsson et al. 2008) is available for models cooler than K. The subset of MARCS grids with plane-parallel structure and solar metal abundances is used to model the G stars. For the G star spectrophotometry discussed in this paper, the broad band HST fluxes and both sets of models all agree to 0.5%. The ability to provide a consistent set of model flux distributions that fit the measured SEDs of WDs, A stars, and G stars lends confidence to this system of high precision HST standard stars.
2 Solar Models
Kurucz (2004)333http://kurucz.harvard.edu/stars/sun has produced a finely sampled solar model SED (fsunallp). Figure 1 compares both this special solar spectrum and the MARCS model to the same CK04 model interpolated in the CK04 grid. All three model SEDs are for the same effective temperature K, surface gravity , metallicity [M/H] , and the turbulent velocity km/s, except that the Kurucz fsunallp model has km/s. Shortward of 0.45 m, where the line blanketing is severe, the MARCS model differs from the CK04 model by more than 5% in the bottom panel of Figure 1, and the Kurucz (2004) and CK04 models differ by up to 3% in the top panel. In this region of severe line blanketing, the models are most sensitive to the input parameters. For example, changing only the from two to one km/s increases the mean flux in the 0.30–0.37 m range by 5%, while affecting the fluxes longward of 0.40 m by 1%.
Longward of 0.6 m, the Kurucz (2004) and CK04 models differ smoothly by up to 2% in the top panel; however, the ratios in the two panels of Figure 1 match to 1%. This match between the Kurucz (2004) and MARCS models suggests that the CK04 models may have a slight IR excess with respect to the band. Furthermore, direct comparisons of the CK04 models with the HST observations also show similar residuals in the 1–2.5 m region. Thus, for solar analog stars with within a few hundred degrees of the Sun, the first-order correction in the top panel should be an improvement to the CK04 grid models longward of 1 m. In the 4.2–7 m region where the Kurucz (2004) model overestimates the strength of the main CO band absorption (Kurucz, private communication), no correction is made to the CK04 grid models. Whenever CK04 is mentioned below, this correction procedure that is based on the Kurucz special solar model is implicit from 1–4.2 m and longward of 7 m. The correction is smooth and does not exceed 0.5% beyond 7 m.
3 Model Parameters for the Best Fit to HST Fluxes
Following the technique of Bohlin & Cohen (2008), values for , , , and the selective dust extinction between the and bands, , are derived by fitting the HST observational SEDs with model atmospheres from the grid of Castelli & Kurucz (2004 CK04). Figure 2 compares the observations to the best fitting CK04 models. Similarly, Figure 3 shows the ratio of the observations to the best fit from the MARCS grid (Gustafsson, et al. 2008). Each reddened model is normalized to the observed flux averaged over 0.6–0.9 m. The reddening curve used to correct for the extinction as a function of wavelength and is from Cardelli, Clayton, & Mathis (1989, CCM) at wavelengths shorter than 2 m and is from Chiar & Tielens (2006) at longer wavelengths. Both the level and slope of the two extinction curves are matched at 2 m.
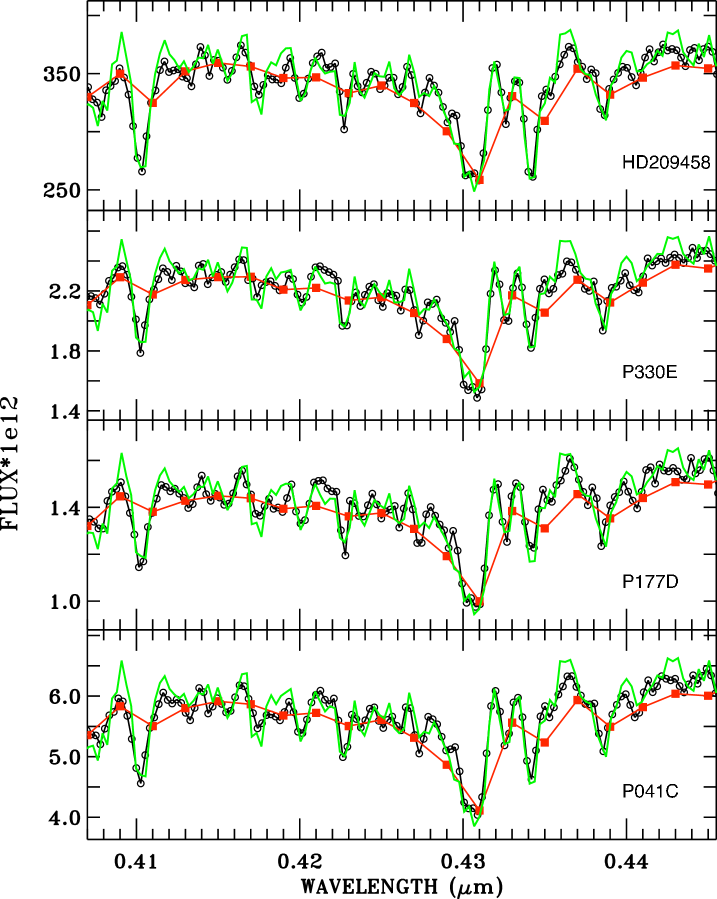
In Figures 2–3, the ratios of the observations to the models appear as small circles at a resolution of . The large scatter in these narrow band small circles at the shorter wavelengths demonstrates the Kurucz (2005) claim that exact model fits are currently hopeless because of poor and incomplete atomic line data and because of elemental abundance uncertainties, especially in regions of strong line blanketing. Typically for solar type stars, the model computations show a line blanketing that exceeds 20% below 0.45 m. However, averages over broad bands should be accurate because of the statistical nature of the uncertainties of the absorption line strengths. For the fainter stars in the three top panels, the signal to noise of the observations is poor; and much of the fine structure is just noise. For the four brighter stars, Figure 4 illustrates the source of the fine structure in one narrow wavelength region. Longward of 0.42 m, the CK04 models in Figure 4 are low, which causes the peaks around 0.43 m that often rise above 1.05 in Figure 2. Similarly, the MARCS models are systematically higher than the observations near 0.41 m, which causes the narrow dips at that wavelength in Figure 3. The use of models for narrow band calibrations is problematic because of deviations from the true observed flux and because of the coarse wavelength grid for the CK04 models. For calibrations in narrow bands with a spectral resolution comparable to the observations, the finite resolution of the observations may also cause errors to the extent that spectral features fall in the band pass and to the extent there is noise in the observed flux. Whenever possible, narrow band filters and spectroscopic sensitivities are best measured using a standard star with minimal spectral structure in the region of interest. The effects of the resolution and noise can be alleviated by fitting a smooth function to the sensitivity as a function of wavelength in the case of a spectrograph calibration; but narrow band filter calibrations suffer errors directly from all the above problems.
Table 1 lists the broad band regions used to minimize the rms scatter in the fitting procedure. The averages over the first two broad bands show opposite behavior as a function of gravity, in the sense that the flux decreases at 0.300–0.372 m and increases at 0.372–0.455 m as increases. These two bands provide a strong constraint on the derived values for in the temperature regime of the program solar analog stars. For example, an increase of 10% in the first to the second broad band flux ratio represents a change of in . Because the uncertainties in the NICMOS data are larger than for STIS, the NICMOS bands are wider. Furthermore, an extra uncertainty of 1–2% exists where the NICMOS non-linearity correction of Bohlin, Riess, & de Jong (2006) is the largest at 1–1.3 m. Therefore, this 1–1.3 m region is not used to constrain the model fits. The large open circles in Figures 2–3 represent the average ratio in each of these 10 continuum regions, while the rms value appearing for each star represents the scatter about the fit in the 10 broad bands. There is only one NICMOS observation of P177D longward of 1.9 m, so the last broadband is not used for the fitting of P177D. The granularities of the fits are 20 K, 0.05, 0.01, and 0.001 in , , , and , respectively.
Table 2 summarizes the results of the best fits for the two sets of models. The residual broad band rms values are all 0.5% for both the CK04 and MARCS model fitting.
4 Comparison of CK04 and MARCS Results
There are systematic differences in the models: the MARCS and the CK04 best fits differ by up to +100 K in , +0.8 in , +0.10 in [M/H], and +0.021 in , even though both grids are computed for plane parallel structure and with km/s. These differences are probably due largely to different adopted abundances. The Marcs models use the relative abundances and the fractional abundance by mass of chemical elements heavier than helium from Grevesse, Asplund, & Sauval (2007), while CK04 adopt the abundances of Grevesse & Sauval (1998) with .
The low values from the CK04 grid for with respect to the MARCS results and with respect to the 4.44 solar value may indicate that the metallicities adopted for the MARCS models are more realistic in the heavily line blanketed 0.3–0.455 m region that is of primary importance for the determination of . Whatever the true cause of the low values for for the CK04 fits, there is little effect on the mid-IR flux, which is the main goal of this work. For example in the worst case of P177D with the lowest of 3.60, increasing to the canonical solar value of 4.44 makes large changes of a few percent in the two shortest wavelength broad bands, as expected. The 0.3–0.372 m ratio drops by 6%, while the next band at 0.372–0.455 m increases by 3%. In these heavily line-blanketed regions, such deviations can be explained by abundance errors and uncertainties in the atomic physics used by CK04. However, at the longer wavelengths, where the goal is to accurately predict the flux, the maximum difference between the of 3.60 and 4.44 models is 0.2%. The values for and the reddening are much more important than for determining the IR fluxes with respect to the 0.6–0.9 m normalization region.
The MARCS models are indexed by a quantity [Fe/H], which represents the logarithm of the number of iron atoms relative to hydrogen by number; and [Fe/H] indicates a solar abundance. The upper () and lower () cases must not be confused; but as long as models with enhanced alpha elements are not considered, then the fraction of metals by mass, , scales directly with the total metal number density relative to the Sun, [Fe/H] = [M/H], where M represents the total metallicity. A quirk of the MARCS grid is that for [Fe/H] , a solar relative metallicity among the heavy elements is classified as “alpha-poor,” while models with enhanced oxygen and alpha elements with respect to iron are denoted as “standard.” Hence, for the six stars with metallicities lower than solar, the “alpha-poor” MARCS grid is utilized.
Despite the differences in the models, the comparison in Figure 5 of the best fitting CK04 and MARCS models for each star typically agree to 1% in broad continuum bands. The systematically higher temperatures for the MARCS fits are partially compensated by higher reddenings. Unfortunately, this comparison between CK04 and MARCS extends only to 20 m, which is the long wavelength limit of the MARCS grid. Because JWST requires flux standards to 30 m, the CK04 models are the baseline, while the agreement with the independent MARCS grid sets a lower limit of 1% to the uncertainty in the modeled IR SEDs.
In addition to this systematic uncertainty in the G star models, the systematic uncertainty in the SEDs of the primary pure hydrogen WDs that are the basis for the HST flux scale must be included in the error analysis. The error model of Bohlin (2003) assigns a 1% uncertainty in the flux relative to the 0.55 m flux for these WDs longward of 1.5 m. For models in the range of the results of Table 2, a delta of 18 K, e.g., for models with vs. 5818 K, the change in the 1.5/0.55 m flux ratio is 1%. However, this possible error in the HST flux scale causes little extra error in the extrapolated G star fluxes, because the ratio of these two 5800 K models is rather flat beyond 1.5 m, increasing to an error of only 1.2% at 30 m. Thus, combining the 1% uncertainty in the G star models with a 1% uncertainty in the primary WD models, a limit of 2% to the systematic uncertainty for the modeled mid-IR fluxes relative to the band is conservative, except in the unlikely case that both model grids have errors in the mid-IR that are large and of similar amount.
The CK04 fits often show somewhat lower rms residuals in Table 2; and the CK04 fits are usually closer to the canonical solar values of K, while the MARCS models are closer to the solar . A difference common to all seven stars in Figure 5 is the rise of 2% from 4 m to the maximum of the CO fundamental band strength at 4.6 m, where the modeling is severely challenged by the difficulties of the molecular physics and the tenuousness of the solar atmosphere at the height of the temperature minimum where CO is most abundant. Precision JWST/NIRSPEC spectrophotometry of the G stars relative to the WD and A stars should determine the true strength of the CO bands, which will enable better estimates of the SEDs of the G type standards in this region of greatest uncertainty.
5 HD209458
HD209458 has a planetary transit that reduces the flux by 1.6% (Wittenmyer et al. 2005). However, the length of the transit is only 3 hours from phase 0.98–1.02 in the 3.5 day orbital period. The ephemeris is precisely known; and any observation of HD209458 can be checked for dimming caused by a transit. The STIS and NICMOS observations utilized here are all obtained outside of transit. The precise period is days with an uncertainty of 0.016 s, so that an uncertainty of the time of zero phase is less than one minute for 36 years after 2003, when the time of zero phase was measured precisely. The heliocentric phase at any time is the fractional part of , where is the Reduced Julian Date, i.e., with 2,400,000 days subtracted. For example, the STIS observation at 2001 October 28 22:13:24 UT is at JD or at a phase of , i.e., . For precise estimates, the difference in light travel time to the Earth instead of the Sun must be accounted. For the ecliptic latitude of for HD2090458, this time difference is in the range 7.3 minutes, i.e., 0.001 in phase.
During secondary eclipse at phase 0.5, Knutson, et al. (2008) report flux decreases of 0.09%, 0.21%, 0.30%, 0.24%, and 0.26% at 3.6, 4.5, 5.8, 8.0, and 24 m, respectively, while Rowe et al. (2006) constrain the planetary flux contribution to 0.01% in the 0.4–0.7 m band. Thus, the model predictions for the SED of HD209458 are in error by small fractions of a percent as a function of wavelength due to the contribution from the hot Jupiter planet. Outside of eclipse, Cowan et al. (2007) constrain the variation with phase to be 0.15% at 8 m.
Also, the temperatures for HD209458 of 6080 and 6160 K in Table 2 are near those summarized by Wittenmyer et al. (2005), especially the value of 6099 44 K of Fischer & Valenti (2005), who find , and [Fe/H]. The special model with K and for HD209458444http://kurucz.harvard.edu/stars/hd209458/ constructed by Kurucz in 2005 agrees with the best fit CK04 model to within about 2% longward of 0.4 m, when the two models are normalized at 0.6–0.9 m.
6 The Sun as a Solar Analog Star
Figure 6 shows the comparison between the solar observations and the models, in analogy with the stellar observations in Figures 2–3. The flux of the Sun is from Thuillier et al. (2003, Th03), where observations from the ATLAS and EURECA missions with the Space Shuttle are referenced to the Heidelberg Observatory blackbody absolute-flux standard. Rieke et al. (2008) have adopted the Th03 flux distribution for their solar SED below 2.4 m. The agreement between the shapes of the observed and modeled SED does not achieve the 1% goal, as illustrated in the bottom two panels, where the Th03 measurements differ from both models by 4% near 2 m. Thus, either the measured Th03 fluxes or both special solar models have the wrong -band to -band flux ratio. The Th03 uncertainty at 2 m is quoted as 1.3% in Table III of Th03 but grows to “2%” in the Conclusions section, which also quotes a 2–3% uncertainty below 0.85 m. Thus, an error of 4% in the ratio of the 2 to 0.55 m Th03 fluxes is conceivable. If the Th03 solar SED does actually have errors as large as 4%, then the HST SEDs may be more accurate with their estimated uncertainty of 2% in relative flux.
Conversely, if the models have small systematic errors, for example, in the abundances, then somewhat different models will fit the TH03 fluxes better. In the upper two panels, the best fits from the respective grids suggest that a model with a somewhat lower metallicity may be required for the Sun, i.e., and for the best fits from the CK04 and MARCS grids, respectively.
At the longer wavelengths, Figure 7 illustrates the ratio of three other candidate solar SEDs to the baseline CK04 model. In the bottom panel, the agreement of the MARCS SED with CK04 is generally within 1%, except in the problematic CO band around 4.6 m. In the middle panel from 0.5–2.4 m, the comparison with Rieke et al. (2008) is the same as shown for the comparison with Th03 in the bottom panel of Figure 6, except for the more drastic smoothing. Longward of 2.4 m, the agreement of CK04 with the model used by Rieke et al. (2008) is excellent, i.e., within the estimated uncertainty of 2%. In the top panel, the comparison is with the best fit CK04 model from Figure 6. The ratio of this cooler model SED with lower gravity and lower metallicity to the baseline CK04 model rises to 1.06 at 30 m. Such a large discrepancy as 1.06 seems unlikely given the excellent agreement among the standard CK04, MARCS, and Rieke models longward of 2.4 m. Thus, the most likely conclusion seems to be that the ratio of the Th03 flux at 2 m to the Th03 flux shortward of 1 m is too high by 4%. The only other possibility is that all the models are wrong by a similar amount in their to band and band to 30 m flux ratios.
7 Summary
Absolute flux standards with spectral types of G are required for JWST calibration. None of the seven HST stellar G-type stars is a true “solar analog” in the sense that the shape of the SED matches either the Th03 solar flux measurements or the standard Kurucz (fsunallp) or MARCS solar model to 1% over the whole 0.3–2.5 m observed range. However, STIS and NICMOS spectrophotometry measure the flux distributions of these seven G stars, which fit CK04 and MARCS model atmospheres from 0.3–2.4 m within an rms scatter of 0.5% in broad wavelength bands. These models are normalized to the HST SEDs and are used to extend the measured fluxes to longer wavelengths. The seven composite observed plus model SEDs are archived in the CALSPEC database of HST flux standards555http://www.stsci.edu/hst/observatory/cdbs/calspec.html/ as *_stisnic_003.fits.
Emission from dust rings like the one around Vega often contribute added mid-IR flux; but JWST observations can identify discrepantly large cases of excess emission longward of 10 m, if no other mid-IR data are available before JWST operations begin. A separate paper with additional authors is planned, which will compare the SEDs of some of these G stars and a set of HST WDs and A stars with the revised Spitzer calibration of Rieke et al. (2008).
References
- (1)
- (2) Bohlin, R. C. 2003, in 2002 HST Calibration Workshop, (Baltimore: STScI), S. Arribas, A. Koekemoer, & B. Whitmore, eds., p. 115
- (3) Bohlin, R. C. 2007, in ASP Conf. Ser. 364, The Future of Photometric, Spectrophotometric, and Polarimetric Standardization, ed. C. Sterken (Ann Arbor, MI: Sheridan Books), p. 315; also arXiv:0608.715 [astro-ph]
- (4) Bohlin, R. C., & Cohen, M. 2008, AJ, 136, 1171
- (5) Bohlin, R. C., Dickinson, M. E., & Calzetti, D. 2001, AJ, 122, 2118
- (6) Bohlin, R. C., & Koester, D. 2008, AJ, 135, 1092
- (7) Bohlin, R. C., Riess, A., & de Jong, R. 2006, Instrument Science Report, NICMOS 2006–002, (Baltimore: STScI)666This STScI internal document can be found at: http://www.stsci.edu/hst/nicmos/documents/isrs/.
- (8) Cardelli, J., Clayton, G., & Mathis, J. 1989, ApJ, 345, 245 (CCM)
- (9) Castelli, F., & Kurucz, R. 2004, IAU Symp. No. 210, Modeling of Stellar Atmospheres, eds. N. Piskunov, W. Weiss, & D. Gray 2003, poster A20; also arXiv:0405.087 [astro-ph] (CK04)
- (10) Chiar, J., & Tielens, A. 2006, ApJ, 637, 774
- (11) Cowan, N. B., Agol, E., & Charbonneau, D. 2007, MNRAS, 379, 641
- (12) Fischer, D. A., & Valenti, J. 2005, ApJ, 622, 1102
- (13) Grevesse, N., Asplund, M., & Sauval, A. J. 2007, Sp. Sci. Rev., 130, 105
- (14) Grevesse, N., & Sauval, A. J. 1998, Sp. Sci. Rev., 85, 161
- (15) Gustafsson, B., Edvardsson, B., Eriksson, K., Jorgensen, U. G., Nordlund, A., & Plez, B. 2008, A&A, 486, 951
- (16) Knutson, H. A., Charbonneau, D., Allen, L. E., Burrows, A., & Megeath, S. T. 2008, ApJ, 673, 526
- (17) Kurucz, R. L. 2004, http://kurucz.harvard.edu/
- (18) Kurucz, R. L. 2005, New atlases for solar flux, irradiance, central intensity, and limb intensity. Presented at the workshop “ATLAS12 and Related Codes” held in Trieste 11–15 July, 2005, Memorie della Socienta Astronomica Italiana Supplementi, vol. 8, pp. 158–160
- (19) Reach, W. T., et al. 2005, PASP, 117, 978
- (20) Rieke, G. H., et al. 2008, AJ, 135, 2245
- (21) Rowe, J. F. et al. 2006, ApJ, 646, 1241
- (22) Thuillier, G., Herse, M., Labs, D., Foujols, T., Peetermans, W., Gillotay, D., Simon, P., & Mandel, H. 2003, Sol. Phys., 214, 1 (Th03)
- (23) Wittenmyer, R. A., et al. 2005, ApJ, 632, 1157
| Wavelength Range (m) |
|---|
| 0.300–0.372 |
| 0.372–0.455 |
| 0.455–0.550 |
| 0.550–0.650 |
| 0.650–0.750 |
| 0.750–0.850 |
| 0.850–1.000 |
| 1.300–1.550 |
| 1.550–1.900 |
| 1.900–2.400 |
| Star | R.A. | Decl. | [M/H] | rms (%) | [M/H] | rms (%) | |||||||||
|---|---|---|---|---|---|---|---|---|---|---|---|---|---|---|---|
| J2000 | J2000 | CK04 | MARCS | ||||||||||||
| P041C | 14 51 58.19 | +71 43 17.3 | 12.01 | 5960 | 3.95 | 0.02 | 0.027 | 0.31 | 6020 | 4.65 | 0.03 | 0.038 | 0.34 | ||
| P177D | 15 59 13.59 | +47 36 41.8 | 13.48 | 5780 | 3.60 | 0.031 | 0.24 | 5860 | 4.30 | 0.049 | 0.29 | ||||
| P330E | 16 31 33.85 | +30 08 47.1 | 13.01 | 5820 | 4.00 | 0.035 | 0.28 | 5920 | 4.60 | 0.056 | 0.41 | ||||
| HD209458 | 22 03 10.8 | +18 53 04 | 7.65 | 6080 | 4.00 | 0.005 | 0.15 | 6160 | 4.45 | 0.021 | 0.24 | ||||
| C26202 | 3 32 32.88 | 27 51 48.0 | 16.64 | 6100 | 4.30 | 0.035 | 0.34 | 6200 | 4.55 | 0.054 | 0.47 | ||||
| SF1615+001A | 16 18 14.23 | +00 00 08.4 | 16.75 | 5800 | 4.10 | 0.104 | 0.29 | 5840 | 4.45 | 0.112 | 0.43 | ||||
| SNAP-2 | 16 19 46.13 | +55 34 17.7 | 16.2 | 5740 | 4.05 | 0.036 | 0.34 | 5800 | 4.85 | 0.048 | 0.46 | ||||