HR 7355 – another rapidly braking He-strong CP star?
Abstract
Context. Strong meridional mixing induced by rapid rotation is one reason why all hot main-sequence stars are not chemically peculiar. However, the finding that the He-strong CP star HR 7355 is a rapid rotator complicates this concept.
Aims. Our goal is to explain the observed behaviour of HR 7355 based on period analysis of all available photometry.
Methods. Over two years, we acquired 114 new BV observations of HR 7355 at observatories in Arizona, U.S.A and Cape Town, South Africa. We performed period analyses of the new observations along with new analyses of 732 archival measurements from the Hipparcos and ASAS projects.
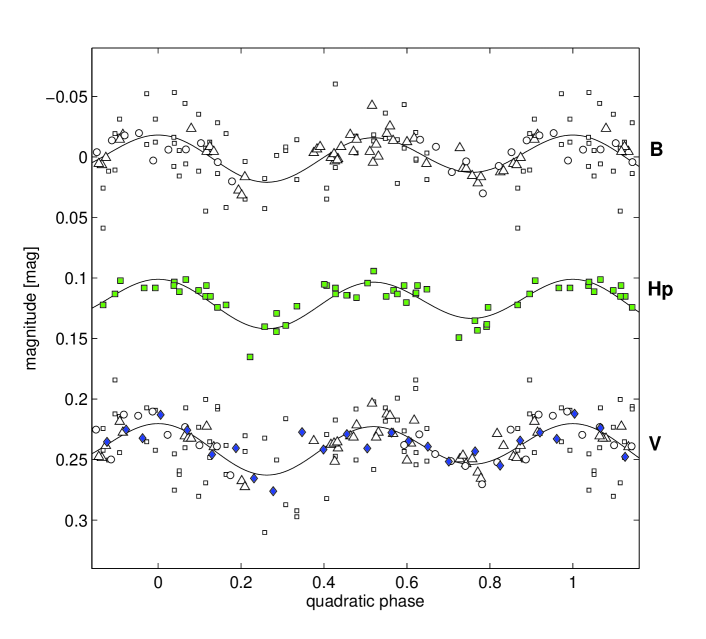
Results. We find that the light curves of HR 7355 in various filters are quite similar, with amplitudes 0.035(4), 0.036(4), and 0.038(3) mag in , Hp, and , respectively. The light curves are double-peaked, with unevenly deep minima. We substantially refine the rotational period to be , indicating that HR 7355 is the most rapidly rotating CP star known. Our period analyses reveal a possible lengthening of the rotational period with .
Conclusions. We conclude that the shape and amplitude of HR 7355 light curves are typical of magnetic He-strong CP stars, for which light variations are the result of photospheric spots on the surface of a rotating star. We hypothesise that the light variations are caused mainly by an uneven distribution of overabundant helium on the star’s surface. We briefly describe and discuss the cause of the rapid rotational braking of the star.
Key Words.:
stars: chemically peculiar – stars: variables – stars: individual HR 7355 – stars: rotation1 Introduction
Chemically peculiar (CP) stars are an important class of stars that occupy the upper main sequence, where radiative diffusion and gravitational settling result in atmospheric chemical abundances that differ remarkably from the Sun’s. According to their patterns of chemical anomalies, CP stars are classified into several subclasses that also follow a temperature sequence. Among them, SrCrEu, Si, He-weak, and He-strong stars have strong global magnetic fields. These “magnetic” CP (mCP) stars also exhibit synchronous variability in their spectra and brightness with periods longer than one half of a day. Their photometric amplitudes are a few hundredths of magnitude.
mCP stars have inhomogeneous surface distributions of chemical elements as determined from their rotationally modulated spectral-line variability (e.g., Lüftinger et al. 2010a, b). The uneven surface distribution of various elements, together with rotation, has been presumed to be the main cause of these stars’ light variability. Line blanketing caused by overabundant elements, mainly iron-group metals and b–f transitions, may induce the flux redistribution providing the mechanism for the light variability (Lanz et al. 1996). A strong magnetic field may also influence the light curves (e.g., Kochukhov et al. 2005).
Krtička et al. (2007, 2009) used surface abundance maps to simulate successfully the light curves of the He-strong star HD 37776 and the Si star HR 7224. They demonstrated that the inhomogeneous surface distribution of silicon, iron, and helium, along with the b–f and b–b transitions of these elements, accounted for most of the light variability in these CP stars.
The light curves of magnetic CP stars are stable on a timescale of decades or more and so indicate persistency of their spectroscopic and photometric spots. We can observe period changes in their light curves in only a few cases (Mikulášek et al. 2008b, and references therein).
It is generally expected that the meridional currents induced by the rapid rotation of hot MS stars are able to erase the effects of the slow diffusion of chemical elements and thus prevent the formation of CP abundance anomalies. We study therefore the light variability of HR 7355, which is one of the most rapidly rotating mCP stars.
2 The star
HR 7355 (HD 182180, HIP 95480) is a bright ( mag) but poorly studied southern B2V star. It is known to be a rapid rotator, Oksala et al. (2010) evaluating its projected equatorial velocity to be . The Hipparcos catalog (ESA 1997) classified the star as an “unsolved variable”, but Koen & Eyer (2002) reanalysed the Hipparcos photometry and found a frequency of variation of .
The first detailed study of HR 7355 was performed by Rivinius et al. (2008), who describe the star as a helium-strong CP star with Balmer emission. They argue that the true period, corresponding to the star’s rotational period, is twice that derived by Koen & Eyer (2002): . This suggests that HR 7355 is the most rapidly rotating He-strong CP star known.
In the present study, we analyse our new and archival photometry of HR 7355 to determine the star’s periodicity and light curve shape at various epochs between 1990 and 2009.
2.1 Parameters of the star
We estimate the mass and age of HR 7355 using the revised version of the Hipparcos catalogue (van Leeuwen 2007), the Geneva and Strömgren photometry (from GCPD111http://obswww.unige.ch/gcpd), and the isochrones of the Padova group (Marigo et al. 2008).
The Geneva colours (Cramer 1999) are consistent with a B2 V star. The index shows no peculiarity beyond what we would expect for a classical CP4 star (Paunzen et al. 2005). From the various Geneva indices and the available Strömgren photometry, we deduce a reddening of mag and an effective temperature of 18 000 K. The photometric estimates for the absolute magnitude, , vary between and mag. The parallax gives a distance of 273(26) pc and an absolute magnitude of mag (assuming = 6.02 mag). This result is fainter than those estimated from the photometric indices, which may be a result of the star’s rapid rotation.
We estimate the age of HR 7355 to be between 15 and 25 Myr, as derived from the parallax-based and the photometry-based values of , respectively. We note that Westin (1985) lists (23.9 Myr) for HR 7355. Consequently, HR 7355 appears to be near the middle of its main-sequence lifetime. We derive a mass of 6.3(0.3) M☉ from the parallax-based . The photometry-based absolute magnitude would result in a higher mass.
From its distance and the Galactic coordinates, we derive the Galactic [X,Y] distances/coordinates of HR 7355 to be pc. Comparing these values and their uncertainties with the borders of the Scorpius-Centaurus association (Preibisch & Mamajek 2008), we find that HR 7355 is probably beyond the outer edge of the association. The mean proper motion of the association is mas yr-1 (de Zeeuw et al. 1999), compared to mas yr-1 for HR 7355. Given its motion direction and apparent age, we suggest that HR 7355 does not originate in the Scorpius-Centaurus association.
3 Photometric data of HR 7355
3.1 New photometry
Most of our new photometry of HR 7355 was acquired with the T3 0.4 m automatic photoelectric telescope (APT) at Fairborn Observatory in southern Arizona during 2008 May and June. The T3 APT uses a temperature-stabilised EMI 9924B photomultiplier tube to measure photon count rates sequentially through and filters. For additional details about the collection and reduction of the APT data, see cf. Mikulášek et al. (2008b) and references therein. The comparison and check star used by the APT were HD 179520 and HD 181240, respectively. The southern declination of HR 7355 () causes airmass values of for all of our APT measurements. The standard deviation of the difference between variable and comparison stars is mag, twice the typical scatter with this telescope. Thus we acquired 43 and 38 measurements.
We also obtained seven continuous hours of photometry with a photoelectric photometer attached to a 0.28 m reflector on the night of 2009 July 26 UT at the private observatory of one of us (SNdV) in Cape Town, South Africa. We acquired 17 and 16 measurements in and . The comparison and check stars were the same as used by the APT; the scatter in the observations was 0.01 mag. When combined with the APT measurements, these continuous single-night observations helped us to minimise the aliasing inherent in single-sight data sets.
The newly acquired photometric data are available through SIMBAD111http://cdsweb.u-strasbg.fr/cgi-bin/qcat?J/A+A/ or the On-line database of photometric observations of mCP stars222http://astro.physics.muni.cz/mcpod.
3.2 Archival photometry
The Hipparcos photometry (ESA 1997) of HR 7355 consists of 57 measurements in (scatter of 23 mmag), 45 in Hp ( mmag), and 56 in ( mmag). The data cover the period from 1990 March to 1993 March.
The continuously updated archive of the All Sky Automated Survey (ASAS) (Pojmański 2002) is a useful source of photometric observations of stars near the equator. Unfortunately, the precision for relatively bright stars is poor – the data have significant non-Gaussian scatter with plenty of outliers. Furthermore, the data contain a long-term trend with a range of 0.05 mag.
Nonetheless, the ASAS data are the only photometric data of HR 7355 available in the period between the end of the Hipparcos mission (1993) and the start of our own photometry (2008). We extracted only the individual measurements with a quality of “A” or “B” and removed the long-term trend. This resulted in an ASAS data set of 574 observations covering the time interval from 2001 February to 2009 October. These data have a scatter of 50 mmag.
Therefore, we consider in our period analysis a total of 846 measurements spread over 20 years.
4 The ephemeris
4.1 The period
The periodogram of all available HR 7355 photometry displays only two prominent peaks – one at a period of and the second at – that agree well with the previous determinations of Koen & Eyer (2002) and Rivinius et al. (2008). The shorter period is the consequence of the double-peaked nature of the light curve (see Fig. 1). This period is shorter than the critical period of centrifugal disruption of main-sequence stars of the same spectral type and so cannot represent HR 7355’s rotation period, which we take to be . The longer period is also compatible with the period of the well documented spectral and spectropolarimetric variations (Oksala et al. 2010; Rivinius et al. 2010).
4.2 The light variations model
The double-waved light curves in , Hp, and are similar (see Fig. 1), differing only slightly in their effective amplitudes (for the definition see Mikulášek et al. 2007), where the subscript denotes the filter colour. Light-curve magnitudes can then be expressed as
| (1) |
where is the magnitude in colour observed by -th observer, is the mean magnitude, which can be variable over the long term. This was the case for ASAS measurements, where we had to assume a cubic trend. The function is the simplest normalised periodic function that represents the observed photometric variations of HR 7355 in detail. The phase of maximum brightness is defined to be 0.0, and the effective amplitude is defined to be 1.0. The function, being the sum of three terms, is described by two parameters and , where quantifies the difference in depths of the primary and the secondary minima and expresses any asymmetry in the light curve
| (2) |
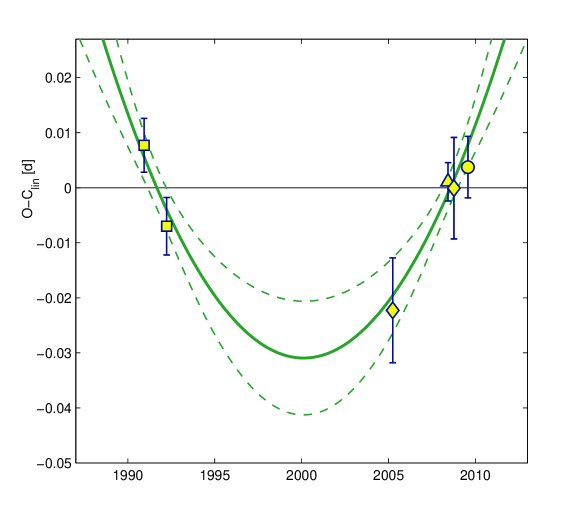
where is the phase function of time described in Mikulášek et al. (2008b). The O-C diagram (see Fig. 2) indicates that the function may be parabolic; thus, we assumed it to have the form
| (3) |
where is the maximum nearest the weighted center of the observations, is the period of the linear fit, is the time derivative of the period (assumed to be constant here), and and are constants determined by the data distribution in time so that the first and second terms in Eq. (3) are orthogonal, such that , where .
All 19 model parameters were computed simultaneously by a weighted non-linear LSM regression applied to the complete observational material without any artificial divisions.
4.3 Results
We determined the model parameters , s y-1, and . Time of the primary maximum being given by
| (4) |
where is an integer. The effective amplitudes are almost identical and equal to 0.035(4), 0.036(4), and 0.038(3) mag in B, Hp, and , respectively, , and .
The reliability of the LSM procedure results depends critically on the appropriateness of the chosen model for the description of the reality – in our case light variations over the past twenty years. Inspecting Fig. 1, we can conclude that the model of light curves described by Eqs. (1) and (4.2) is fully adequate.
Adequacy of the quadratic model used for the phase function Eq. (3) can be tested by changes in mutual phase shifts of observed light curves. The shift (O-C)k can be evaluated for any subset of observational data by the relation: (O-C), where are deviations of observed magnitudes from the fit, and are time derivatives of the fitted function (Mikulášek et al. 2006). From Fig. 2 containing shifts of 6 observational data subsets with respect to the linear ephemeris, we conclude that our quadratic model of the phase function in Eq. (3) is acceptable.
To be sure that non-zero is not a mere conjunction of the non-Gaussian noise in ASAS data, we treated the observational set excluding all the ASAS data. Even in this case, we obtained , supporting the reality of the period lengthening.
5 Discussion
5.1 HR 7355 – the most rapidly rotating CP star
The rotational period of HR 7355 is among the shortest known to date for CP stars: HD 164429 (, Adelman 1999); HD 124224 = CU Vir (, Sokolov 2000); HD 92385 (, ESA 1997). Among these fast rotating CP stars, HR 7355 is the hottest, most massive and, consequently, the largest thus, we conclude that HR 7355 has the largest equatorial rotational velocity ( using the parallax-based for a B2 V star and the period) and also the highest ratio of equatorial velocity to critical equatorial velocity among all known CP stars. Therefore, we consider HR 7355 to be the most rapid rotator of all known chemically peculiar stars. Because of its rapid rotation, it can serve as an important benchmark for theories describing the influence of rotational mixing on chemical peculiarity.
5.2 Nature of the light variation
Our analysis of the , Hp, and light curves demonstrates that all three passbands have the same effective amplitude. This suggests that the variability mechanism at optical wavelengths could be unique (Mikulášek et al. 2008a). We suggest that these light variations are caused by the uneven distribution of optically active, overabundant elements on the surface of the star. Unfortunately, we do not have maps of the abundance distribution or spectrograms suitable for their creation.
We consider the possibility that the broad-band optical light variability in HR 7355 arises from variations in the spectral lines of , , and , as depicted for HR 7355 in Fig. 1 of Rivinius et al. (2008). They compare the line profiles of two spectra obtained at quadrature (HJD and HJD , as defined for Eq. (3)); their first spectrum was thus taken shortly after secondary light maximum, while the second was acquired at the secondary light minimum. The only overabundant element whose line intensity reaches maximum in the optical is helium (see the relevant analysis of He-strong HD 37776 in Krtička et al. 2007). Lines of the other ions mentioned above are relatively weak and nearly constant. The photometric effect of the weak emission in H is also negligible.
We modelled the light curves of HR 7355 with the code described by Krtička et al. (2007) assuming the inclination angle of ( km s-1, Oksala et al. 2010) and found that two circular, helium-rich spots with [He/H]=1.4 and radii on opposite hemispheres of HR 7355 reproduce the observed light variations in all three passbands. We therefore conclude that light variations in HR 7355 may be the result of the uneven distribution of helium.
This hypothesis should be tested with Doppler tomography, which we plan to do in the near future.
5.3 Rotational braking and its nature
An increase in the rotational period with is observed at the level of certainty. During the past 20 years, the period has increased by 2.1 s! Unfortunately, no observations were taken in the interval 1994-2000. This adds some uncertainty to our quadratic fit of the O-C residuals. If the period change were real, then HR 7355 would be the fourth known CP star displaying an increase in its rotational period.
The star is similar in several aspects to the most rapidly braking He-strong CP star HD 37776 with a well-determined year-1 (Mikulášek et al. 2008b). The period increase in HR 7355 could also be interpreted as a deceleration of the rotation of its surface layers due to momentum loss by a magnetically confined stellar wind (see also ud-Doula et al. 2009). However, a possible change in the rate of period change for HD 37776 ( d-1) suggests that the process of the rotational braking need not be fully monotonic!
Both stars have strong magnetic fields; that of HR 7355 is approximately dipolar ranging in strength from -2 kG to +2.5 kG (Oksala et al. 2010), while the field of HD 37776 is dominated by a quadruple component (Thompson & Landstreet 1985). However, the main difference between the stars discussed here is their age. While HD 37776 is a very young CP star with an age of around 1 Myr, HR 7355 is about twenty times older (see Sect. 2.1). Because the characteristic braking time of HR 7355 ( yr) is about fifty times shorter than its stellar age, it seems probable that variations in rotational period are confined to the outer layers of the star. The period variations could be cyclic with a long interval of period increase followed by a rapid period decrease. The period decrease may be caused by greater friction between the surface and inner layers of the star caused by, e.g., reconnection events. The length of this cycle can be roughly estimated as the time when the surface layers lag behind the inner part of the star by one revolution (i.e., ). This produces estimates of 35 yr and 45 yr for HR 7355 and HD 37776, respectively. The hypothesis should be tested a few decades hence with additional observations.
6 Conclusions
We have improved the accuracy of the rotational period of the most rapidly rotating CP star HR 7355 to and determined its rate of period change to be . We propose that the period variations could be cyclic on a timescale of a few decades. Observed light variations may be caused by the uneven surface distribution of overabundant helium. HR 7355 remains a very appealing target for continued photometric and spectroscopic observations, as well as for the modelling of its unusual behaviour.
Acknowledgements.
Supports of grants GAAV IAA301630901 and MEB 060807/WTZ CZ-11/2008 are acknowledged. GWH acknowledges long-term support from NASA, NSF, Tennessee State University, and the state of Tennessee through its Centers of Excellence program. EP acknowledges support by the City of Vienna (Hochschuljubiläumsstiftung project: H-1930/2008). We thank to dr. D. A. Bohlender for his inspiring refereeing of the article.References
- Adelman (1999) Adelman, S. 1999, A&AS, 136, 379
- Cramer (1999) Cramer, N. 1999, New Astronomy, 43, 343
- de Zeeuw et al. (1999) de Zeeuw, P. T., Hoogerwerf, R., & de Bruijne, J. H. J., et al. 1999, AJ, 117, 354
- ESA (1997) ESA 1997, in The Hipparcos and Tycho Catalogues, ESA SP-1200, Noordwijk
- Koen & Eyer (2002) Koen, C. & Eyer, L. 2002, MNRAS, 331, 45
- Kochukhov et al. (2005) Kochukhov, O., Khan, S., & Shulyak, D. 2005, A&A, 433, 671
- Krtička et al. (2009) Krtička, J., Mikulášek, Z., Henry, G.W., et al. 2009 A&A, 499, 567
- Krtička et al. (2007) Krtička, J., Mikulášek, Z., Zverko, J., & Žižňovský, J. 2007, A&A, 470, 1089
- Lanz et al. (1996) Lanz, T., Artru, M.-C., Le Dourneuf, M., & Hubeny, I. 1996, A&A, 309, 218
- Lüftinger et al. (2010a) Lüftinger, T., Fröhlich, H.-E., Weiss, W. W., et al. 2010, A&A, 509, A43
- Lüftinger et al. (2010b) Lüftinger, T., Kochukov, O., Ryabchikova, T., et al. 2010, A&A, 509, A71
- Marigo et al. (2008) Marigo, P., Girardi, L., Bressan, A., et al. 2008, A&A, 482, 883
- Mikulášek et al. (2008a) Mikulášek, Z., Gráf, T., Krtička, J., Zverko, J., & Žižňovský, J. 2008a, Contrib. Astron. Obs. Sk. Pleso, 38, 363
- Mikulášek et al. (2007) Mikulášek, Z., Janík, J. Zverko, J., et al. 2007, Astron. Nachr., 328, 10
- Mikulášek et al. (2008b) Mikulášek, Z., Krtička, J., Henry, G. W., et al. 2008b, A&A, 485, 585
- Mikulášek et al. (2006) Mikulášek, Z., Wolf, M., Zejda, M., & Pecharová, P. 2006, Ap&SS, 304, 363
- Oksala et al. (2010) Oksala, M., Wade, G., Wagner, M., et al. 2010, MNRAS, submitted
- Paunzen et al. (2005) Paunzen, E., Stütz, Ch., & Maitzen, H. M. 2005, A&A, 441, 631
- Pojmański (2002) Pojmański, G. 2002, Acta Astron., 52, 397
- Preibisch & Mamajek (2008) Preibisch, T., & Mamajek, E. 2008, Handbook of Star Forming Regions, Vol. II: The Southern Sky ASP Monograph Publications, Vol. 5. Ed.Bo Reipurth, 235
- Rivinius et al. (2008) Rivinius, T., Štefl, S., Townsend, R.H.D., & Baade, D. 2008, A&A, 482, 255
- Rivinius et al. (2010) Rivinius, T., Szeifert, T., Barrera, L., et al. 2010, MNRAS, submitted
- Sokolov (2000) Sokolov, N.A. 2000, A&A, 353, 707
- ud-Doula et al. (2009) ud-Doula, A., Owocki, S. P., & Townsend, R.H.D. 2009, MNRAS, 392, 1022
- Thompson & Landstreet (1985) Thompson, I.B., & Landstreet, J.D. 1985, ApJ, 289, L9
- van Leeuwen (2007) van Leeuwen, F. 2007, A&A, 474, 653
- Westin (1985) Westin, T. N. G. 1985, A&AS, 60, 99